IPC-TM-650 EN 2022 试验方法.pdf - 第33页
This method is summarized by equations (1) through (3) below. S R&r =( S R 2 + S r 2 ) 1 / 2 ( 1 ) where, S r = Rx K 1 / 5.15 S R = [ ( R – X xK 2 ) 2 – ( 28.1 x S r 2 nxk ) ] 1 / 2 / 5.15 ( 2 ) and where = R = Σ m i…

2 Applicable Documents
The applicable document will be
the test procedure under evaluation.
3
Test Specimens
The test specimens used will be as
specified in the test procedure under investigation.
The number and types of test materials to be used will
depend on the range of levels in the class of materials to be
tested. If it is known that precision is worse at one end of the
range, evaluations could be limited to that end of the range. In
general, evaluations should be performed on all combinations
of materials, levels, test set-ups, and test conditions. If
resources are limited, begin the study with those combina-
tions deemed to be the most critical, or where measurement
error is likely to be greatest.
The number of samples will also depend on the difficulty
involved in obtaining, processing, and distributing the test
specimens, the difficulty, length of time required for, and
expense of performing the test, and other prior known infor-
mation.
This test method will assume that measurements can be
repeated on the same sample. For situations where this is not
possible or the sample is consumed during the test, see 6.3.
4
Apparatus
The apparatus used will be as specified by
the test procedure under investigation.
The resolution of the measurement apparatus should be suf-
ficient to achieve the desired accuracy of the measurement.
For example, if you were to measure mass, and expect to
measure it to 1 gm, the balance should be able to measure to
at least 0.1 gm.
5
Procedure
5.1 Planning the Evaluation
Keep
the evaluation as
simple as possible to obtain estimates of within and between
tester variability that are free of unintended secondary effects.
A particular test condition could be different combinations of
laboratories, operators, equipment, etc.
Be sure the procedure under evaluation is complete and
describes the test parameters as well as recommended tech-
niques for controlling variability. Include known best practices
and draw extensively on the experience of test users.
The method used in this procedure allows for up to ten test
conditions. Solicit participants from among the community of
facilities with the proper test equipment, competent operators
and familiarity with the test. In order to obtain representative
precision estimates, do not select only from a small group of
users who are considered exceptionally qualified. Be sure to
specify any special calibration procedures or material prepara-
tion requirements.
The analysis method used in this procedure allows up to five
repeated measurements per sample. The test samples should
be carefully prepared in order to be as consistent and homo-
geneous as possible. Try to limit the lots of raw materials and
processing facilities used. Randomize the samples prior to
dividing into test groups. Prepare more than the material
required to ensure adequate amount is available for the study
in case of lost or damaged specimens, errors, test set-up, etc.
Carefully package and label the samples. Assign serial num-
bers, if possible. Identify the version of the test procedure and
specify care and handling procedures. Provide a data sheet,
and describe any documentation required. Require a test log,
and insist that all observations of any unusual events be
recorded.
5.2
Conducting the Evaluation
Ensure
the samples are
inspected on receipt. Send replacement units if damaged or
tests are performed improperly. Follow the documented test
procedure carefully to ensure no unusual variation is intro-
duced.
Inspect the data sheets when returned. Review the test logs
for unusual events. Review the measurements for level and
consistency. Question unusual data points. Incorrect readings
and typographical errors must be corrected prior to analysis.
5.3
Analyzing the Data
Analysis
may be performed on the
Measurement Precision data sheet or on other applicable
software. A Measurement Precision Calculator has been pre-
pared to perform the calculations using the equations shown
below (see 6.5).
This evaluation technique is called the Average and Range
Method and partitions the total measurement precision (S
R&r
)
into
two portions: the with-in test condition variation, called
repeatability (S
r
)
and between test condition variation, called
reproducibility (S
R
).
The method does this by calculating an
estimate of the standard deviation of the measurement
repeatability by using the range of the repeated measure-
ments with-in each test condition, and by calculating an esti-
mate of the standard deviation of the reproducibility by using
the range between different test condition averages.
For normally distributed parameters, these two standard
deviations are combined to estimate the total measurement
precision by taking the square root of the sum of the squares.
IPC-TM-650
Number
1.9
Subject
Measurement
Precision Estimation for Variables Data
Date
01/03
Revision
A
P
age2of10
This
method is summarized by equations (1) through (3)
below.
S
R&r
=(S
R
2
+ S
r
2
)
1/2
(1)
where,
S
r
= Rx
K
1
/
5.15
S
R
=
[
(R
–
X
xK
2
)
2
–
(
28.1
x S
r
2
nxk
)
]
1/2
/
5.15 (2)
and where
=
R
=
Σ
m
i=1
Σ
n
j=l
R
ij
mxn
(3)
R
ij
=
Range of repeated readings for test condition i and
sample j
m = number of test conditions
n = number of samples
R
–
X
=
Range of operator averages - the maximum Test
condition average, minus the minimum test condition
average.
k = number of repeated readings
The K factors, K
1
,K
2
,
and K
3
are
noted in Table 1 below.
5.4
Evaluating Process Capability of Measurement Sys-
tem
The
estimated standard deviation of the total measure-
ment precision, S
R&r
,
can be used to evaluate the capability of
the measurement process. This capability assessment is per-
formed by comparing the estimated measurement precision
to the specification tolerances and to total product variation.
5.4.1
Capability Assessment 1 – Gage Repeatability and
Reproducibility (GRR)
The
precision-to-tolerance ratio,
GRR, shows what percent of the specification window is con-
sumed by measurement uncertainty, and is defined as:
GRR =
5.15 x S
R&r
USL − LSL
x
100 (4)
where,
USL = upper specification limit and
LSL = lower specification limit
This equation is defined for situations where both specification
limits exist. It would not be evaluated where only an upper or
lower limit exists. A factor of 5.15 is used to calculate the 99%
confidence interval on the total measurement precision.
Another commonly used factor is 6 used to represent a
99.975% confidence interval.
5.4.2
Capability Assessment 2 – Precision to Variation
Ratio (PV)
The
precision-to-variation ratio shows what per-
centage of the total observed product variation can be attrib-
uted to measurement uncertainty. It is calculated as follows:
PV =
S
R&r
2
S
T
2
x
100 (5)
Where
S
T
2
= S
R&r
2
+ S
P
2
(6)
And
where
S
P
=R
P
xK
3
(7)
R
p
=
The range between the maximum and minimum part
measurement averages. K
3
is
noted in Table 1, above.
5.4.3
Measurement Tolerance
The
measurement toler-
ance defines a confidence half interval around the measured
value using the estimated measurement precision.
TOL = 2.57 x S
R&r
(8)
The
factor 2.57 is used to give the 99% confidence half inter-
val. Thus there is a 99% chance that the true (but unknown)
value of the parameter being measured will fall with-in ± TOL
of the measured value.
5.5
Preparing Analysis Conclusions
Goals
for measure-
ment precision should be established before the study begins.
The goals should be established using knowledge of the
anticipated levels of product variability (or process capability),
specifications, customer needs and the possible impact of
dispositioning test samples improperly (see 6.4).
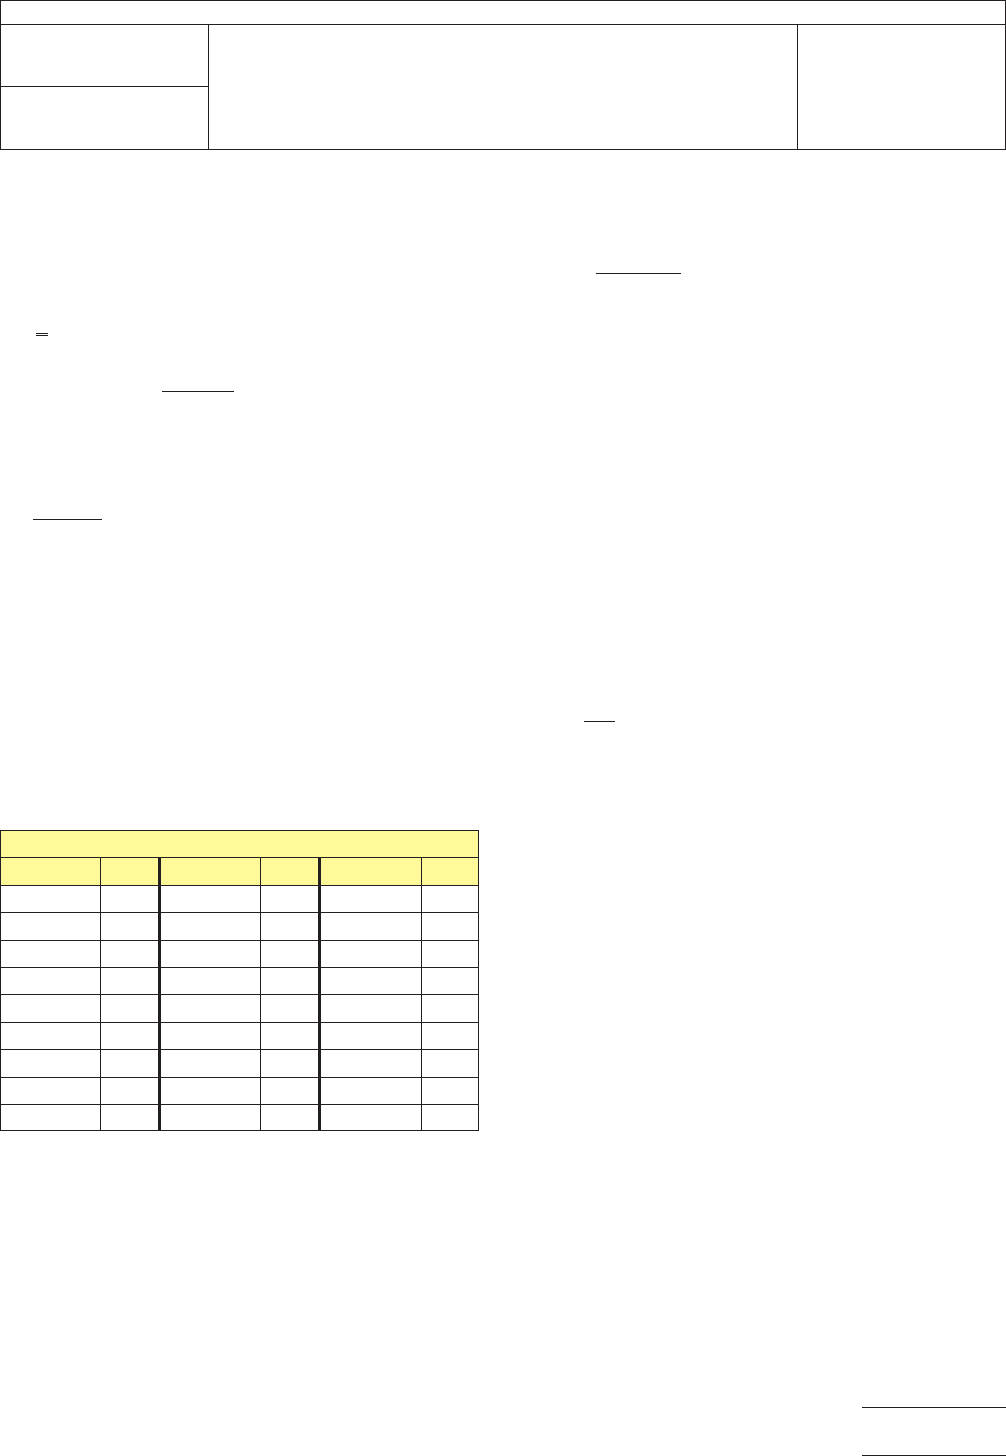
T
able 1 K Factors
K
Factors
Readings K
1
Conditions
K
2
Samples
K
3
2
4.57 2 3.65 2 3.65
3 3.04 3 2.70 3 2.70
4 2.50 4 2.30 4 2.30
5 2.21 5 2.08 5 2.08
6 2.03 6 1.93 6 1.93
7 1.90 7 1.82 7 1.82
8 1.81 8 1.74 8 1.74
9 1.73 9 1.67 9 1.67
10 1.67 10 1.62 10 1.62
IPC-TM-650
Number
1.9
Subject
Measurement
Precision Estimation for Variables Data
Date
01/03
Revision
A
P
age3of10
电子技术应用 www.ChinaAET.com
As
a rule of thumb, the guidelines shown in Table 2 have been
extensively applied.
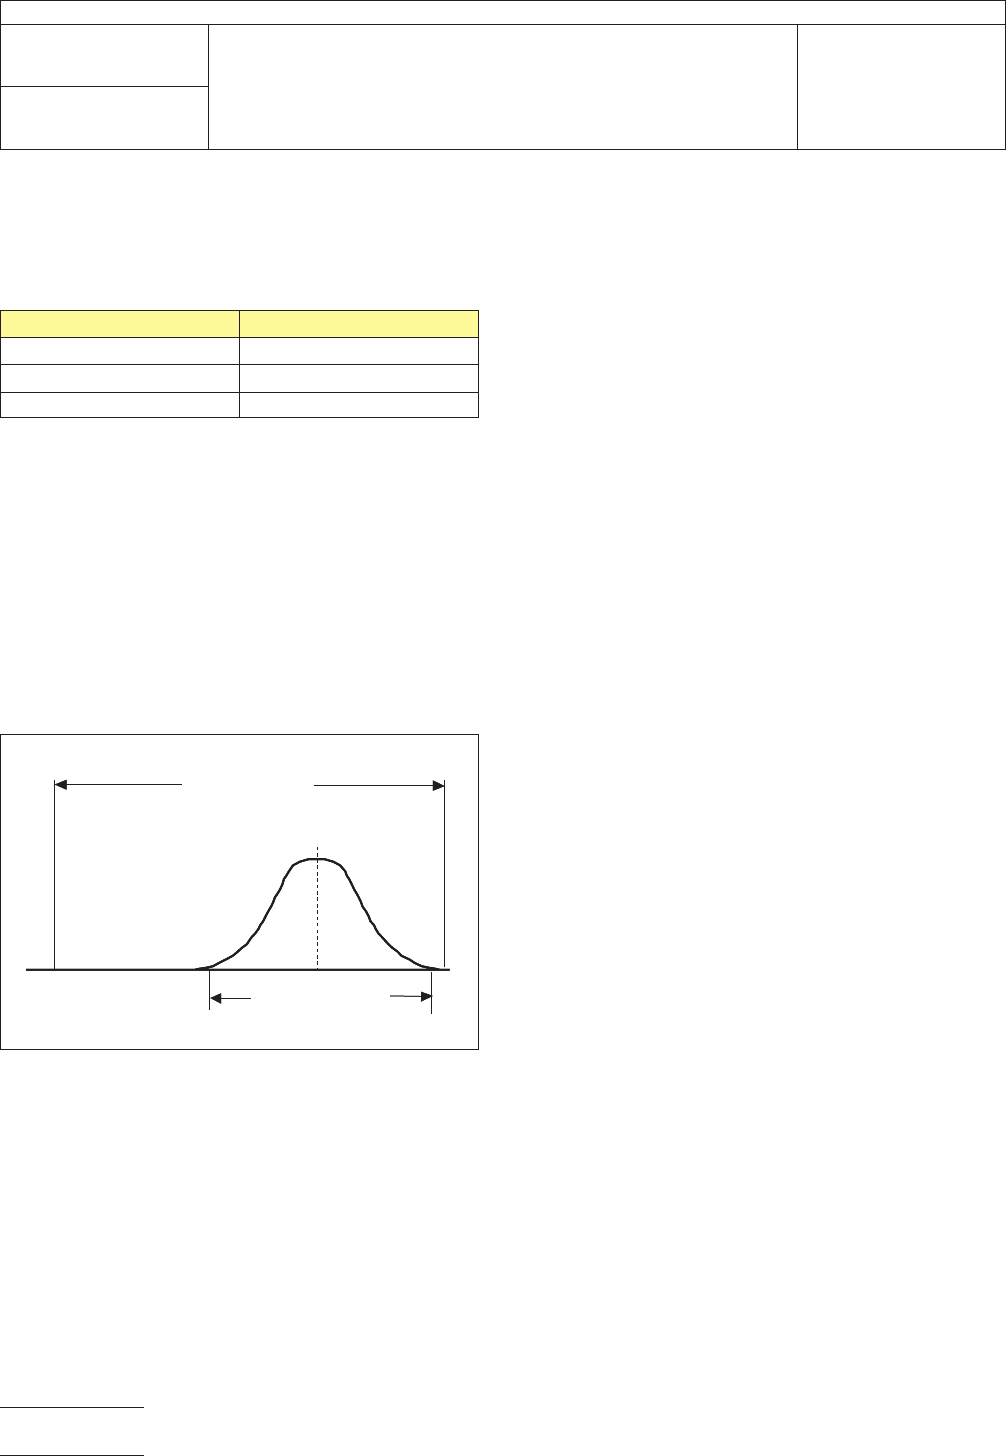
In this table, test measurement precision would be acceptable
if it is less than 10% of the specification width and less than
10% of the total product variation. A test precision that is
more than 30% of the specification width, or more than 30%
of the total product variation, would need improvement. A test
precision more than 10% but less than 30% of specification
width or total product variation would represent marginal mea-
surement precision, and should be improved. An illustration of
the relationship between specification limits and measurement
uncertainty is shown in Figure 2.
If measurement precision is judged to be marginal or worse,
for either GRR or PV, steps should be taken to reduce the
measurement variability. The repeatability and reproducibility
estimates can be examined to determine the largest contribu-
tor to total measurement uncertainty. If the largest component
of variation is repeatability, the cause of variability is with-in a
given test condition. Probable causes include problems with
calibration, lack of operator controls, excessive within part
variation or equipment problems. If the largest component of
variation is reproducibility, the cause of variability is between
test conditions. The probable causes include difference in test
procedural problems test methods, or equipment calibration.
An acceptable GRR or PV value indicates that the test method
precision is adequate and should yield data with reasonable
certainty.
6
Notes
6.1 Measurement System Properties
An
ideal measure-
ment system would have a number of properties including the
following:
a. The measurement system would have adequate resolution.
b. The measurement system would be in statistical control,
the variation in the measurements would be due to com-
mon or random causes only, with all special or definable
causes removed.
c. The variability of the measurement error would be small
when compared to the manufacturing product variability.
d. The variability of the measurement error would be small
when compared with the specification limits.
6.2
Sources of Measurement Variation
A
measurement
system may exhibit several types of variation, including the
following:
a. Accuracy (or bias) – The difference between an observed
measurement and the true (but perhaps unknown) value
being measured.
b. Precision – The closeness to each other of repeated mea-
surements of the same quantity. Precision can be sepa-
rated into two components:
Repeatability – Variation of a measurement system that is
obtained by repeating measurements on the same
sample(s) by the same procedure under the same mea-
surement conditions including the same operator.
Reproducibility – Variation among the averages of mea-
surements made under different measurement conditions
such as different operators, equipment, and/or locations.
c. Stability (or drift) – The variation observed when repeating
measurements on the same device and the same test set-
up, over an extended period of time.
d. Linearity – The difference in bias values through the
expected operating range of the measurement instrument.
This test method has addressed item 6.2.b above. The other
sources of variation are addressed in the references (see 6.4).
T
able 2 Recommended Evaluation
Criteria for GRR and PV
GRR
and PV Rating
>30
Needs improvement
10 to 30 Marginal
<10 Acceptable
IPC-19-2
Figure
2 Depiction of the Relationship Between
Measurement Precision and the Specification Limits
Spec Width
LSL
USL
Measurement
Precision
IPC-TM-650
Number
1.9
Subject
Measurement
Precision Estimation for Variables Data
Date
01/03
Revision
A
P
age4of10
电子技术应用 www.ChinaAET.com