IPC-TM-650 EN 2022 试验方法.pdf - 第31页
1 Scope Tests performed on presumably identical samples under seemingly identical conditions do not always yield iden- tical results. This is due in part to errors inherent in every measurement. During the development of…

Measurement Systems Analysis For Binary Data
Test Effectiveness Calculator
Version 1.0, August 2002
Introduction
Welcome to the Measurement Precision Calculator. This utility is intended to
perform the calculations for Measurement Precision Studies as described
in the IPC test method IPC-TM 1.8.
This unility is useful for situations where the measurement data is recorded
in binary format,, such as pass/fail or go/no-go.
Please refer to the test method before beginning the measurement precision study.
The test method defines the terms and equations used in detail.
Refer to the User Guide for further detailed instructions.
This workbook includes the following
- A blank spreadsheet to enter measurements
- A spreadsheet with example data
- A form for manual data entry, if desired.
The test data should be entered into the yellow areas on the
data entry spreadsheet. Code results as "A" and "R".
This is a beta version of this software.
Your comments and suggestions would be appreciated.
If you have any questions, please contact:
1
Scope
Tests
performed on presumably identical samples
under seemingly identical conditions do not always yield iden-
tical results. This is due in part to errors inherent in every
measurement. During the development of a new test proce-
dure or use of an existing test procedure, this variability must
be understood and precautions taken to ensure that it is con-
trolled to within necessary limits. Performance of this test
method will help to estimate measurement error and trouble-
shoot possible causes. It can provide evidence that a new test
procedure is suitable for use when submitted for review, or an
existing test procedure is capable of measuring the applicable
parameter.
This method provides a simple, easy to use, standard proce-
dure for determining the precision of a test method using the
average and range method. It can be used on tests that
involve measurements that yield continuous data. The calcu-
lations shown in this procedure are streamlined versions; use-
ful for situations where up to five repeated readings are taken
on each of up to 10 samples by up to 10 test laboratories,
operators or test conditions.
This procedure is not useful for measurements which result in
binary data, such as pass-fail or go-no go results, or where
more than five repeated measurements or more than ten labo-
ratories or conditions are used. These situations are covered
under other methods. (see 6.3)
1.1
Definitions
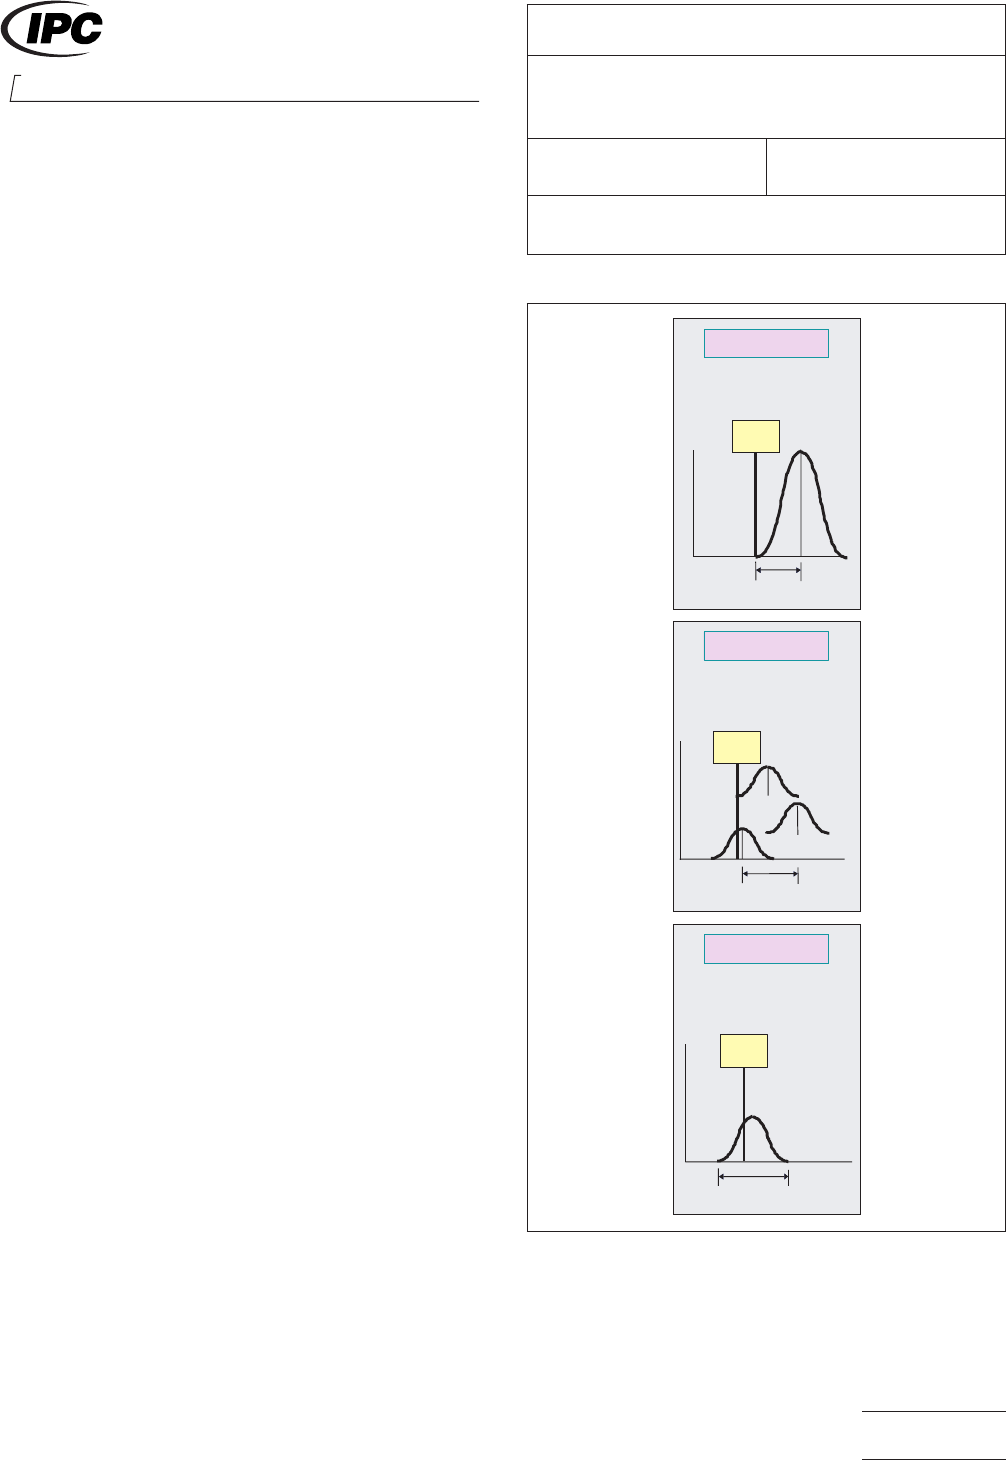
Accuracy
(Bias) –
The
difference between an observed
measurement and the true (but perhaps unknown) value being
measured (see Figure 1).
Continuous
Data –
Numerical
data that can take any con-
ceivable value within an observed range and forms a distribu-
tion about a mean value.
Precision
–
The
closeness to each other of repeated mea-
surements of the same quantity.
Repeatability
–
Variation
of a measurement system that is
obtained by repeating measurements on the same sample(s)
by the same procedure under the same measurement condi-
tions (see Figure 1).
Reproducibility
–
Variation
among the averages of measure-
ments made under different measurement conditions such as
different
operators, equipment, and/or locations (see Figure 1).
Resolution
–
The
size of the smallest increment on the mea-
surement instrument under examination. This value is fre-
quently used in the advertising literature to classify the instru-
ment.
IPC-19-1
Figure
1 Measurement Repeatibility and Reproducibility
Repeatibility
Reproducibility
Accuracy
Accuracy
Reproducibility
Repeatibility
How close is the
measurement to the
true value?
True
value
How close are a series of
measurements by several
people on the same part on
the same equipment?
True
value
True
value
How close is a series of
measurements on one
part by one person?
Operator A
Operator C
Operator
B
2215
Sanders Road
Northbrook, IL 60062-6135
IPC-TM-650
TEST METHODS MANUAL
Number
1.9
Subject
Measurement
Precision Estimation for Variables
Data
Date
01/03
Revision
A
Originating Task Group
Measurement Precision Task Group (7-11a)
Material
in this Test Methods Manual was voluntarily established by Technical Committees of IPC. This material is advisory only
and its use or adaptation is entirely voluntary. IPC disclaims all liability of any kind as to the use, application, or adaptation of this
material. Users are also wholly responsible for protecting themselves against all claims or liabilities for patent infringement.
Equipment referenced is for the convenience of the user and does not imply endorsement by IPC.
P
age1of10
ASSOCIATION CONNECTING
ELECTRONICS INDUSTRIES
®

2 Applicable Documents
The applicable document will be
the test procedure under evaluation.
3
Test Specimens
The test specimens used will be as
specified in the test procedure under investigation.
The number and types of test materials to be used will
depend on the range of levels in the class of materials to be
tested. If it is known that precision is worse at one end of the
range, evaluations could be limited to that end of the range. In
general, evaluations should be performed on all combinations
of materials, levels, test set-ups, and test conditions. If
resources are limited, begin the study with those combina-
tions deemed to be the most critical, or where measurement
error is likely to be greatest.
The number of samples will also depend on the difficulty
involved in obtaining, processing, and distributing the test
specimens, the difficulty, length of time required for, and
expense of performing the test, and other prior known infor-
mation.
This test method will assume that measurements can be
repeated on the same sample. For situations where this is not
possible or the sample is consumed during the test, see 6.3.
4
Apparatus
The apparatus used will be as specified by
the test procedure under investigation.
The resolution of the measurement apparatus should be suf-
ficient to achieve the desired accuracy of the measurement.
For example, if you were to measure mass, and expect to
measure it to 1 gm, the balance should be able to measure to
at least 0.1 gm.
5
Procedure
5.1 Planning the Evaluation
Keep
the evaluation as
simple as possible to obtain estimates of within and between
tester variability that are free of unintended secondary effects.
A particular test condition could be different combinations of
laboratories, operators, equipment, etc.
Be sure the procedure under evaluation is complete and
describes the test parameters as well as recommended tech-
niques for controlling variability. Include known best practices
and draw extensively on the experience of test users.
The method used in this procedure allows for up to ten test
conditions. Solicit participants from among the community of
facilities with the proper test equipment, competent operators
and familiarity with the test. In order to obtain representative
precision estimates, do not select only from a small group of
users who are considered exceptionally qualified. Be sure to
specify any special calibration procedures or material prepara-
tion requirements.
The analysis method used in this procedure allows up to five
repeated measurements per sample. The test samples should
be carefully prepared in order to be as consistent and homo-
geneous as possible. Try to limit the lots of raw materials and
processing facilities used. Randomize the samples prior to
dividing into test groups. Prepare more than the material
required to ensure adequate amount is available for the study
in case of lost or damaged specimens, errors, test set-up, etc.
Carefully package and label the samples. Assign serial num-
bers, if possible. Identify the version of the test procedure and
specify care and handling procedures. Provide a data sheet,
and describe any documentation required. Require a test log,
and insist that all observations of any unusual events be
recorded.
5.2
Conducting the Evaluation
Ensure
the samples are
inspected on receipt. Send replacement units if damaged or
tests are performed improperly. Follow the documented test
procedure carefully to ensure no unusual variation is intro-
duced.
Inspect the data sheets when returned. Review the test logs
for unusual events. Review the measurements for level and
consistency. Question unusual data points. Incorrect readings
and typographical errors must be corrected prior to analysis.
5.3
Analyzing the Data
Analysis
may be performed on the
Measurement Precision data sheet or on other applicable
software. A Measurement Precision Calculator has been pre-
pared to perform the calculations using the equations shown
below (see 6.5).
This evaluation technique is called the Average and Range
Method and partitions the total measurement precision (S
R&r
)
into
two portions: the with-in test condition variation, called
repeatability (S
r
)
and between test condition variation, called
reproducibility (S
R
).
The method does this by calculating an
estimate of the standard deviation of the measurement
repeatability by using the range of the repeated measure-
ments with-in each test condition, and by calculating an esti-
mate of the standard deviation of the reproducibility by using
the range between different test condition averages.
For normally distributed parameters, these two standard
deviations are combined to estimate the total measurement
precision by taking the square root of the sum of the squares.
IPC-TM-650
Number
1.9
Subject
Measurement
Precision Estimation for Variables Data
Date
01/03
Revision
A
P
age2of10