IPC-TM-650 EN 2022 试验方法.pdf - 第470页
a. The transmission line under test varies along its length whereas the value of Z 0 obtained assumes a uniform trans- mission line. Therefore, the measured Z 0 only approxi- mates the characteristic impedance of an idea…

1
Scope
This
document describes time domain reflectom-
etry (TDR) methods for measuring and calculating the charac-
teristic impedance, Z
0
,
of a transmission line on a printed cir-
cuit board (PCB). In TDR, a signal, usually a step pulse, is
injected onto a transmission line and the Z
0
of
the transmis-
sion line is determined from the amplitude of the pulse
reflected at the TDR/transmission line interface. The incident
step and the time delayed reflected step are superimposed at
the point of measurement to produce a voltage versus time
waveform. This waveform is the TDR waveform and contains
information on the Z
0
of
the transmission line connected to the
TDR unit.
Note: The signals used in the TDR system are actually rect-
angular pulses but, because the duration of the TDR wave-
form is much less than pulse duration, the TDR pulse appears
to be a step.
1.1
Applicability
The
observed voltage or reflection coeffi-
cient change in the TDR waveform is related to the difference
between Z
0
of
the transmission line and the impedance of the
TDR. If the impedance of the TDR unit is known via proper
calibration, then the Z
0
of
the transmission line attached to the
TDR unit may be determined. Thus, the TDR method is use-
ful for measuring Z
0
and
changes in Z
0
of
a transmission line.
These impedance values thus determined can be used to
verify transmission line design (engineering development),
measure production repeatability, and qualify manufacturers
via transfer or artifact standards.
Engineering development requires detailed information on the
electrical performance of prototype units to assure the trans-
mission line design yields the expected performance charac-
teristics. Detailed laboratory analysis of the effect of variations
in design features expected in actual manufacture can be
done to assure the proposed design can be manufactured at
a useful quality level.
1.2
Measurement System Limitations
Measurements
of
Z
0
often
vary greatly, depending on equipment used and how
the tests were performed. Following a specified method helps
assure accurate and consistent results. Both single-ended
and differential line measurements have limitations in com-
mon, including the following:
a. The Z
0
measured
units are derived and not directly mea-
sured.
b. The value of characteristic impedance obtained from TDR
measurements is traceable to a national metrology insti-
tute, such as the National Institute of Standards and Tech-
nology (NIST), through coaxial air line standards. The char-
acteristic impedance of these transmission line standards
is calculated from their measured dimensional and material
parameters.
c. A variety of methods for TDR measurements each have
different accuracies and repeatabilities.
d. If the nominal impedance of the line(s) being measured is
significantly different from the nominal impedance of the
measurement system (typically 50 Ω), the accuracy and
repeatability of the measured numerical valued will be
degraded. The greater the difference between the nominal
impedance of the line being measured and 50 Ω, the less
reliable the numerical value of the measured impedance
will be.
e. Measurement variation (repeatability, reproducibility) may
only be a small component of the total uncertainty in the
value of the characteristic impedance. For example, if the
uncertainty in the characteristic impedance of the reference
air line is ± 0.5 Ω (for a 95 % confidence interval), then the
uncertainty in the measured characteristic impedance of
the test line can be no better than ± 0.5 Ω even if measure-
ment variation is much less.
f. The particular TDR methods described herein are not
suited for measuring the characteristic impedance as a
function of position along the transmission line (impedance
profiling) because signal reflections within the transmission
line under test and between the TDR unit and transmission
line under test may adversely affect measurement results.
g. The requirements for the length of the transmission line
under test given in Section 3 of this test method as well the
IPC-2141 must be met.
Further measurement considerations and notes are provided
in Section 6.
1.3
Sample Limitations
The
type of test sample used may
also impact Z
0
values
(see IPC-2141). The sample-based limi-
tations include:
2215
Sanders Road
Northbrook, IL 60062-6135
IPC-TM-650
TEST
METHODS MANUAL
Number
2.5.5.7
Subject
Characteristic
Impedance of Lines on Printed
Boards by TDR
Date
03/04
Revision
A
Originating Task Group
TDR Test Method Task Group (D-24a)
Material
in this Test Methods Manual was voluntarily established by Technical Committees of IPC. This material is advisory only
and its use or adaptation is entirely voluntary. IPC disclaims all liability of any kind as to the use, application, or adaptation of this
material. Users are also wholly responsible for protecting themselves against all claims or liabilities for patent infringement.
Equipment referenced is for the convenience of the user and does not imply endorsement by IPC.
P
age1of23
ASSOCIA
TION CONNECTING
ELECTRONICS INDUSTRIES
®
电子技术应用 www.ChinaAET.com

a.
The transmission line under test varies along its length
whereas the value of Z
0
obtained
assumes a uniform trans-
mission line. Therefore, the measured Z
0
only
approxi-
mates the characteristic impedance of an ideal line that is
representative of the line under test.
b. Lines on a printed circuit board may deviate significantly
from design. For example, microstrip lines longer than
15 cm [5.91 in] on boards with plated-through holes often
have variations in line width; this variation is due to plating
and/or etching variations.
c. If the transmission line is too short, the accuracy of the cal-
culated impedance value may be degraded (see 4.1.2). If
the transmission line is too long, skin effect and dielectric
loss may cause a bias in the impedance measurement.
d. Depending on where the measurements are made, the
value of Z
0
obtained
may be affected by dielectric and
conductor loss and other effects. The farther away from
the interface between the probe and the transmission line
under test, the worse these effects will be.
e. Duration of the measurement window (waveform epoch)
may need to be adjusted for sample length and location of
midpoint vias along the transmission line.
2
Reference/Applicable Documents
IPC-2141
Controlled
Impedance Circuit Boards and High
Speed Logic Design
IPC-TM-650
IPC
Test Methods Manual
1.9 Measurement Precision Estimation for Variables Data
3
Test Specimens
The
test specimen can take one of sev-
eral forms, depending on the application, but contains at least
one transmission (or interconnect) test structure. As
examples, four types are mentioned in 3.1.1 through 3.1.4.
The transmission lines to be measured may be of either strip-
line or microstrip construction and configured as either single-
ended or differential. See IPC-2141 for a recommended test
coupon design.
3.1
Test Specimen Examples
3.1.1 Example 1
Representative
samples of the actual
PCB being manufactured are selected. In some cases, this
sample set may contain all of the boards. Agreed upon func-
tional or nonfunctional transmission lines within the sample are
used for the measurement. Criteria for selection of such lines
includes:
a. Inclusion of the PCB’s critical features.
b. Accessibility of terminations for the line.
c. Absence of branching.
d. Absence of impedance changes within the transmission
line under test.
e. Representation of controlled Z
0
signal
layers in a multi-layer
board.
3.1.2
Example 2
Representative
samples should be as in
3.1.1, except that the test lines are nonfunctional lines
designed into the board for easy termination for TDR mea-
surements. Such test lines should be planned to include criti-
cal features typical of functional lines and should lie in con-
trolled Z
0
signal
layers.
3.1.3
Example 3
Representative
samples should be as in
3.1.1, except test coupons are cut from the master board at
the time the individual PCBs are separated. Such test cou-
pons will have one or more sample transmission lines with
termination suited for testing. Such test lines should include
critical features typical of functional lines and will be fabricated
in the same configuration and structure as the master board
on the same controlled Z
0
layers.
3.1.4
Example 4
A
sample of the substrate laminate to be
characterized before use in manufacturing PCBs is fabricated
with test transmission lines. The fabrication may involve lami-
nating several board layers together in the same manner
anticipated for PCB manufacture.
3.2
Identification of Test Specimen
For
specimens of
types called out in 3.1.1, 3.1.2, or 3.1.3, a board serial num-
ber, part number, and date code should be adequate. Speci-
mens from 3.1.4 should include whatever lot or panel identifi-
cation is available for the substrate laminate being evaluated.
3.3
Conditioning
If
conditioning is required, test speci-
mens shall be stored before testing at 23 °C (+1/-5) °C
[73.4 °F (+ 1.8/-0 °F)] and 50 % RH±5%RHfornoless than
16 hours. If a different conditioning procedure is used, it must
be specified by the user.
4
Equipment and Instrumentation
The
TDR measure-
ment system contains a step generator, a high-speed sam-
pling oscilloscope, and all the necessary accessories for con-
necting the TDR unit to the device under test. IPC-2141
provides a short discussion of the TDR system architecture,
system considerations, and the TDR measurement process.
IPC-TM-650
Number
2.5.5.7
Subject
Characteristic
Impedance of Lines on Printed Boards by TDR
Date
03/04
Revision
A
P
age2of23
电子技术应用 www.ChinaAET.com
1.1
Measurement System Requirements
4.1.1 Measurement Accuracy
The
measurement accu-
racy of the TDR should be sufficient to provide the required
accuracy in the value of characteristic impedance. The
required measurement accuracy of the TDR unit will depend
on the TDR measurement method. In general, the measure-
ment accuracy of the TDR unit should be better than 1% of
amplitude (either voltage or reflection coefficient). Noise in the
measured values will affect the uncertainty in the calculated Z
0
values.
The value of Z
0
may
be affected by the length of the
transmission line under test and the section of the transmis-
sion line from which Z
0
is
calculated (see 3.1.1.d).
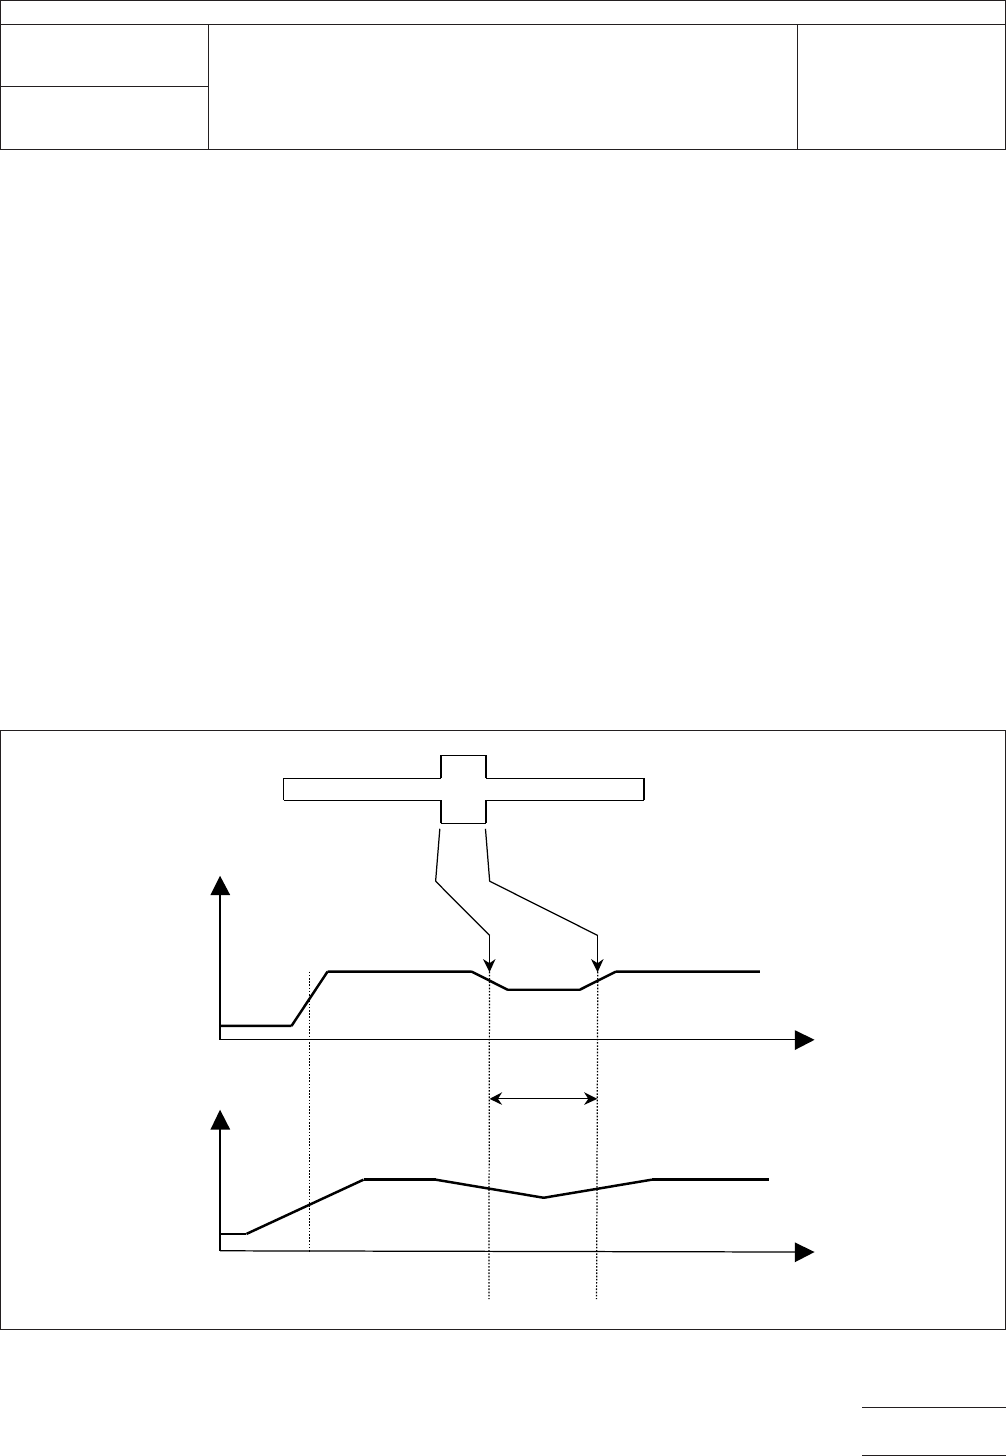
4.1.2
Temporal/Spatial Resolution
The
resolution limit of
a given TDR unit is defined as that particular time or distance
wherein two discontinuities or changes on the transmission
line being measured, that would normally be individually dis-
cernable, begin to merge together because of limited TDR
system bandwidth. The resolution limit is specified in either
time or distance, and is always related to the one-way propa-
gation time between the two discontinuities, T
P
(see
Figure
4-1), and not the round trip propagation time.
Per this definition, the resolution limit is:
a. half the system risetime, t
sys
, where t
sys
is the 10 % to
90 % risetime or 90 % to 10 % falltime (depending on
whether the TDR response is calibrated with a short or
open circuit), or
b. 0.5 t
sys
x v
p
, where v
p
is
the signal propagation velocity in
the transmission line being measured.
These definitions are complementary.
For a given length of transmission line to be measured, the
resolution should not exceed one fourth (0.25) of the available
length, L
TL
of
the transmission line. Table 4-I provides
examples of required resolution for typical surface microstrips
in air, and on FR4 circuit board (v
p
≈ 2x10
8
m/s),
for a given
TDR system risetime.
IPC-2257a-4-1
Figure
4-1 Resolution and Electrical Length of Transmission Line
t
V
adequate resolution
t
V
inadequate resolution
2 T
p
transmission line
IPC-TM-650
Number
2.5.5.7
Subject
Characteristic
Impedance of Lines on Printed Boards by TDR
Date
03/04
Revision
A
P
age3of23
电子技术应用 www.ChinaAET.com