IPC-TM-650 EN 2022 试验方法.pdf - 第321页
5.3.3 Examine all specimens after the test to look for signs of excessive loads, distortions, tears, and other defects. If any defects or sample irregularities are found, discard the sample and the data, rerun another sp…
5.1.2
Specimens
shall be cut to the specified size using
appropriate procedures and equipment to minimize thermal
shock and mechanical stress. Method A specimens shall have
their edges smooth and burr-free by means of sanding or
equivalent (to allow the specimen to rest flat on the mounting
stage). Method B specimens shall be rectangular, with their
long edges parallel (to ensure good mounting in the film fix-
ture). Method B specimens shall have smooth edges without
nicks or tears.
5.1.3 Specimens
shall be preconditioned by baking for one
hour ± 15 minutes at 105°C, then cooled to room temperature
in a dessicator.
5.2
Measurement
5.2.1 Apparatus Set-up
5.2.1.1 Install the Required DMA Clamp
Method A
Install
and calibrate the DMA with a bending
geometry fixture/clamp.
Method
B
Install
and calibrate the DMA with a thin film
fixture/clamp.
5.2.1.2
Start the Experiment
Method A
Measure
the length, width, and thickness of the
specimen to within at least +0.01 mm or preferably +0.005
mm. Clamp the specimen in the DMA fixture. Set the sample
strain amplitude to operate within the linear viscoelastic range
of the material. Strains <1% are recommended and are typi-
cally 0.1%. Program the sample temperature range. Enclose
the specimen and fixture in the environmental chamber (fur-
nace).
Method
B
Measure
the length, width, and thickness of the
specimen to within at least +0.01 mm or preferably +0.005
mm. Sample lengths of 10 mm to 20 mm are typical. Mount
the specimen in the clamps of the film fixture according to the
manufacturer’s instructions. Apply tension force between 10 g
and 50 g. A typical base force would be 20 g (see 6.5 for an
explanation of the load criteria). Enclose the specimen and
probe in the environmental chamber.
5.2.1.3
Provide
an inert gas purge (helium or nitrogen) to the
environmental chamber. Temperature calibration of the DMA
must be performed under the same gas conditions.
5.2.2
Running the DMA Temperature Scan
5.2.2.1 Initial Temperature (T
initial
)
a.
For specimens with T
g
below
or near room temperature,
start the scan at least 20°C below the anticipated transi-
tion. This may require a DMA with subambitent cooling
control of the environmental chamber.
b. For specimens with T
g
greater
than room temperature,
start the scan at 30°C.
5.2.2.2
Sample Heating and Deformation Rate
The
specimen
shall be run at 2°C/min and an oscillation frequency
of 1 Hz.
5.2.2.3
Temperature Excursion
Heat
the specimen to at
least 20°C greater than the T
g
.
This test is general in nature
and data may be taken above T
g
if
required. There is no
required upper temperature.
5.3
Evaluation
5.3.1
The
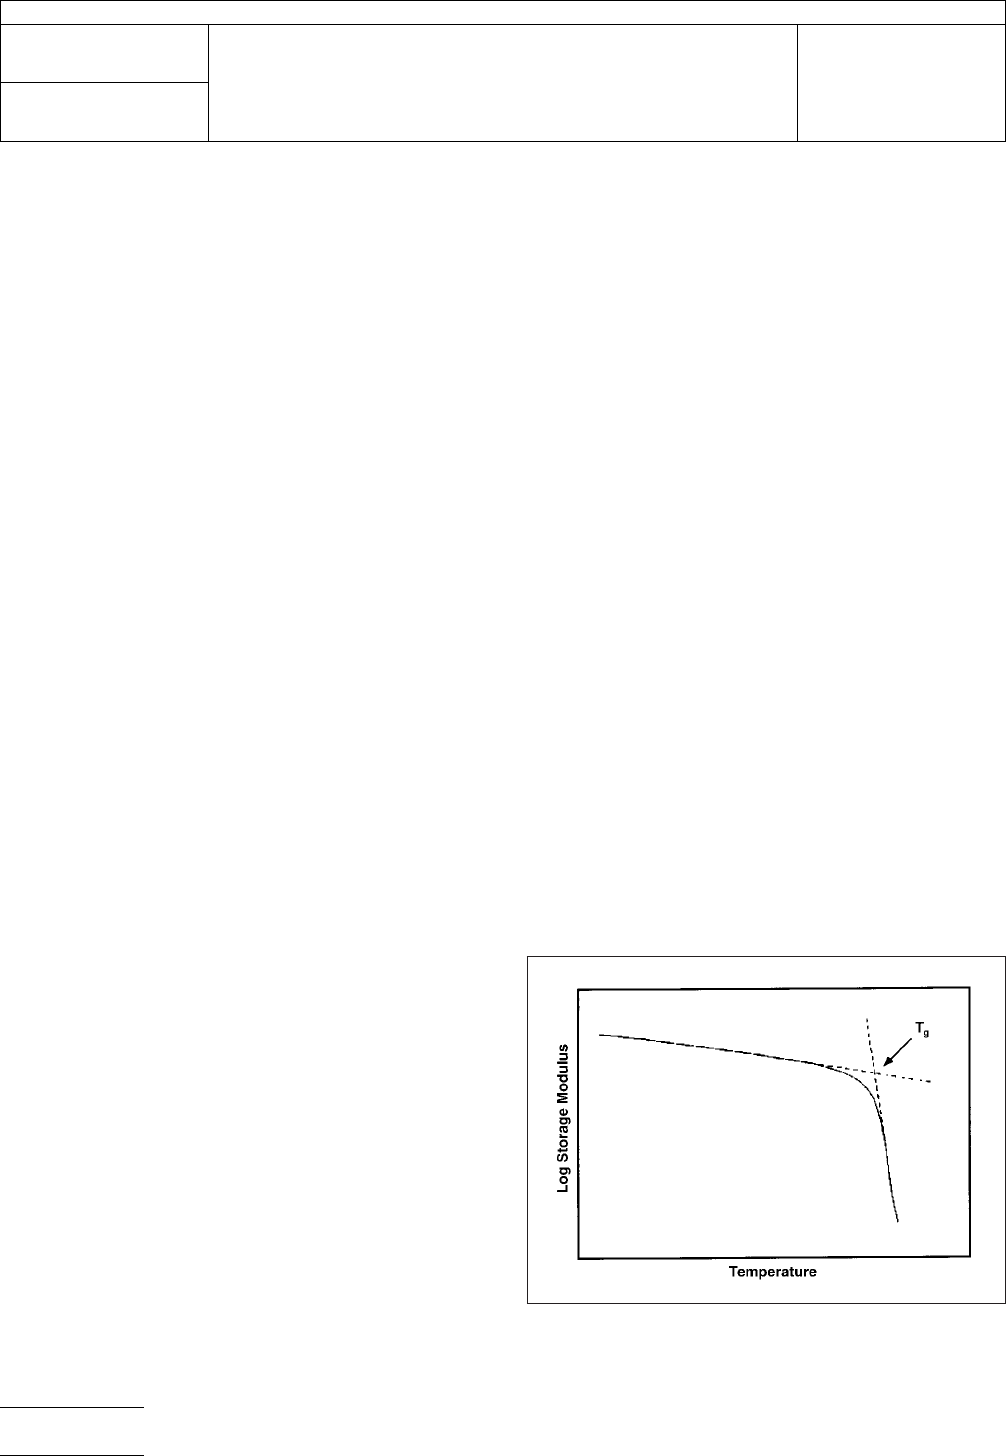
DMA storage modulus should resemble the plot
shown in Figure 1.
5.3.2
An
idealized DMA curve has a linear section below the
transition (glassy region below the temperature of T
g
)
and a
stepwise drop through the glass transition region. These linear
sections are used in calculating T
g
by
onset of the modulus
drop (see Figure 1).
IPC-24244-1
Figure
1 DMA Modulus Plot
IPC-TM-650
Number
2.4.24.4
Subject
Glass
Transition and Modulus of Materials Used in High Density
Interconnection (HDI) and Microvias - DMA Method
Date
11/98
Revision
P
age2of5
电子技术应用 www.ChinaAET.com
5.3.3
Examine
all specimens after the test to look for signs
of excessive loads, distortions, tears, and other defects. If any
defects or sample irregularities are found, discard the sample
and the data, rerun another specimen, or pick a different
method for determining T
g
and
storage modulus.
5.4
Calculations
5.4.1 Glass Transition Temperature (T
g
)
Construct
a
tangent line to the curve below the transition temperature in
the modulus curve. Construct a tangent to the storage modu-
lus curve at or near the inflection point approximately midway
through the step change in the transition. The temperature
where these tangents intersect is the reported T
g
for
the
material. For consistency it is recommended that the DMA
computer analysis software be used for this calculation. See
Figure 1 for an example of this tangent intersection method.
5.4.2
Storage Modulus (E’)
The
sample storage modulus
(E’) shall be calculated at room temperature (22°C) and
reported in units of Pa (N/m
2
).
For consistency it is recom-
mended that the DMA computer analysis software be used for
this geometry specific calculation.
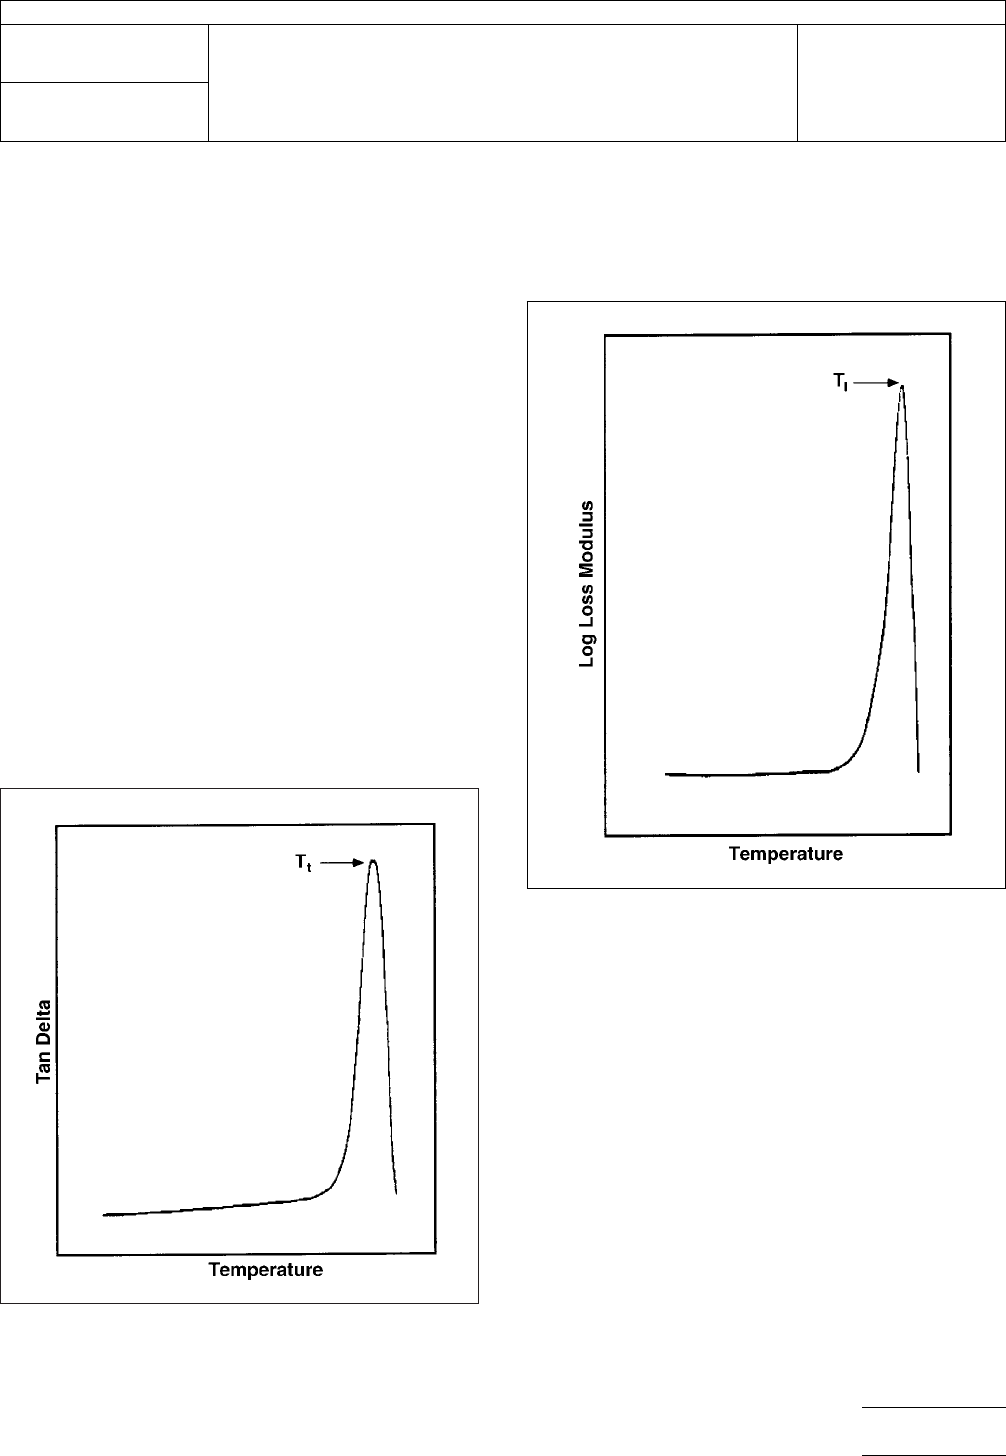
5.4.3
Alternative
thermal transitions may be reported as the
transition peak temperature in the sample loss modulus (T
I
)o
r
tan δ plots (T
t
)
(see Figure 2 and Figure 3).
5.5
Report
5.5.1
Report
the glass transition temperature 22°C (room
temperature) for each specimen, rounding to the nearest
whole number.
5.5.2
Report
the modulus in units of Pa (N/m
2
)
at 22°C.
5.5.3
For
anisotropic (reinforced) samples report the both
the x and y direction modulus.
5.6
Plot
5.6.1
Plot
the storage modulus vs. temperature (°C) for the
specimen. If using computer-based analysis, include the T
g
IPC-24244-2
Figure
2 DMA Tan Delta Plot
Note: T
t
is
the transition peak temperature.
IPC-24244-3
Figure
3 DMA Loss Modulus Plot
Note: T
I
is
the transition peak temperature.
IPC-TM-650
Number
2.4.24.4
Subject
Glass
Transition and Modulus of Materials Used in High Density
Interconnection (HDI) and Microvias - DMA Method
Date
11/98
Revision
P
age3of5
电子技术应用 www.ChinaAET.com
and
measurement start and end points and computer gener-
ated lines (see Figure 1).
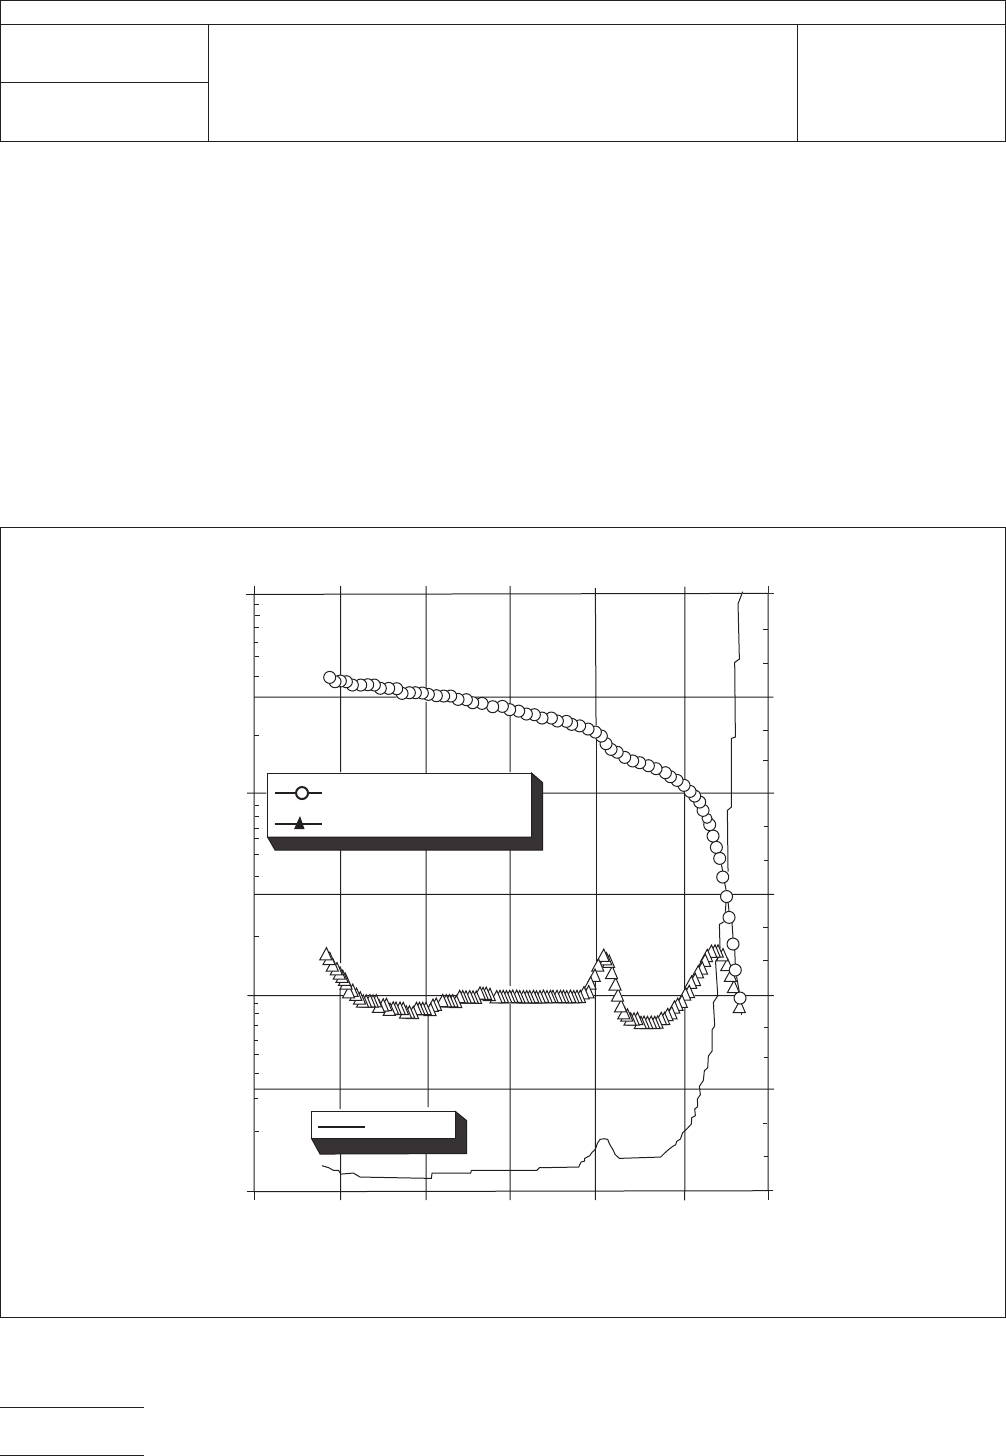
5.6.2
Optionally
plot the storage modulus, loss modulus,
and tan δ vs. temperature (°C) for the specimen (see Figure 4).
6 Notes
6.1
Calibration
of the DMA must be carried out according to
the manufacturer’s instructions for the relevant sample geom-
etry and thermocouple temperature.
6.2
There
are several methods for determining the T
g
of
organic
materials:
• Differential scanning calorimetry (DSC)
• TMA
• DMA
T
g
in
organic materials is a broad transition, which arises when
molecular mobility greatly increases in the specimen as a
result of heating. No one method is superior to another; they
each measure different physical changes that occur in a
specimen near and around T
g
.
IPC-24244-4
Figure
4 DMA Plot for Storage Modulus, Loss Modulus, and Tan Delta on One Plot
Stora
ge Modulus (MPa)
Loss Modulus (MPa)
T
an Delta
200
150100
500
-50
-100
10.0
100.0
1000.0
10000.0
0.90
0.75
0.60
0.45
0.30
0.15
0.0
T
emperature (
˚
C)
Stora
ge Modulus (MPa)
T
an Delta
IPC-TM-650
Number
2.4.24.4
Subject
Glass
Transition and Modulus of Materials Used in High Density
Interconnection (HDI) and Microvias - DMA Method
Date
11/98
Revision
P
age4of5
电子技术应用 www.ChinaAET.com