IPC-TM-650 EN 2022 试验方法.pdf - 第533页
These are the TDR waveforms used in the RIE loss calcula- tion. It is recommended to be positioned within 80% of the vertical screen scale in reference to the representative waveform. The signal on the screen must have a…
4.4.11 TDR ESD Protection TDR equipment shall pro-
vide ESD protection commensurate with the test environment.
It is recommended that samples be grounded to remove any
residual static to protect against static discharge with in the
test environments.
Static can be built up on samples prior to test and can dam-
age the sampling heads in the TDR/TDT equipment. There-
fore, it is recommended that ESD protection be used. Such
protection must be supplied internally to the TDR system.
Samples should be grounded to remove any residual static
and/or passed through some type of deionization device prior
to testing. This can be done by shorting each line to ground
with a simple connection between one end of the lines and
the instrument ground. Keeping the relative humidity in the
test area between 45% and 55% may minimize the buildup of
static. Operators are always required to have a grounding
strap around one wrist havinga1MΩ resistor in series with it.
Special waxing can be used on the lab floor to prevent body
charge build-up. Always use a grounded, conductive table
mat. Always wear a heel strap. Always ground the center con-
ductor of a test cable before making a connection to static-
sensitive equipment.
4.5 SPP Test Apparatus
4.5.1 Other SPP Equipment Requirements
An LCR
meter is required that can measure capacitance at 1 MHz.
4.5.2 SPP Software The following software is required for
implementation of the SPP technique:
a) Gamma-Z software for signal processing or equivalent
b) 2D field solver such as CZ2D, which can be downloaded
from: www.alphaworks.ibm.com/tech/gammazandcz2d,
or equivalent
4.6 FD Test Apparatus The measurement equipment
needed includes a VNA, cabling, a probing solution, and a
calibration structure and calibration coefficients that are
acquired from the probe or connector manufacturer. The
probing solution should match the test sample chosen from
the above described samples. High performance connectors
and cables are recommended in performing VNA measure-
ments. Optionally, a TDT system may be used in place of a
VNA to acquire frequency domain attenuation and loss data.
5 Procedures
5.1 EBW Measurements Procedure
5.1.1 Measurement Process
This procedure will measure
the maximum slope of the rise time of the combined measure-
ment system and DUT and determine a loss factor. Recom-
mended resolution is 4000 points with a horizontal scale of
200 ps/div.
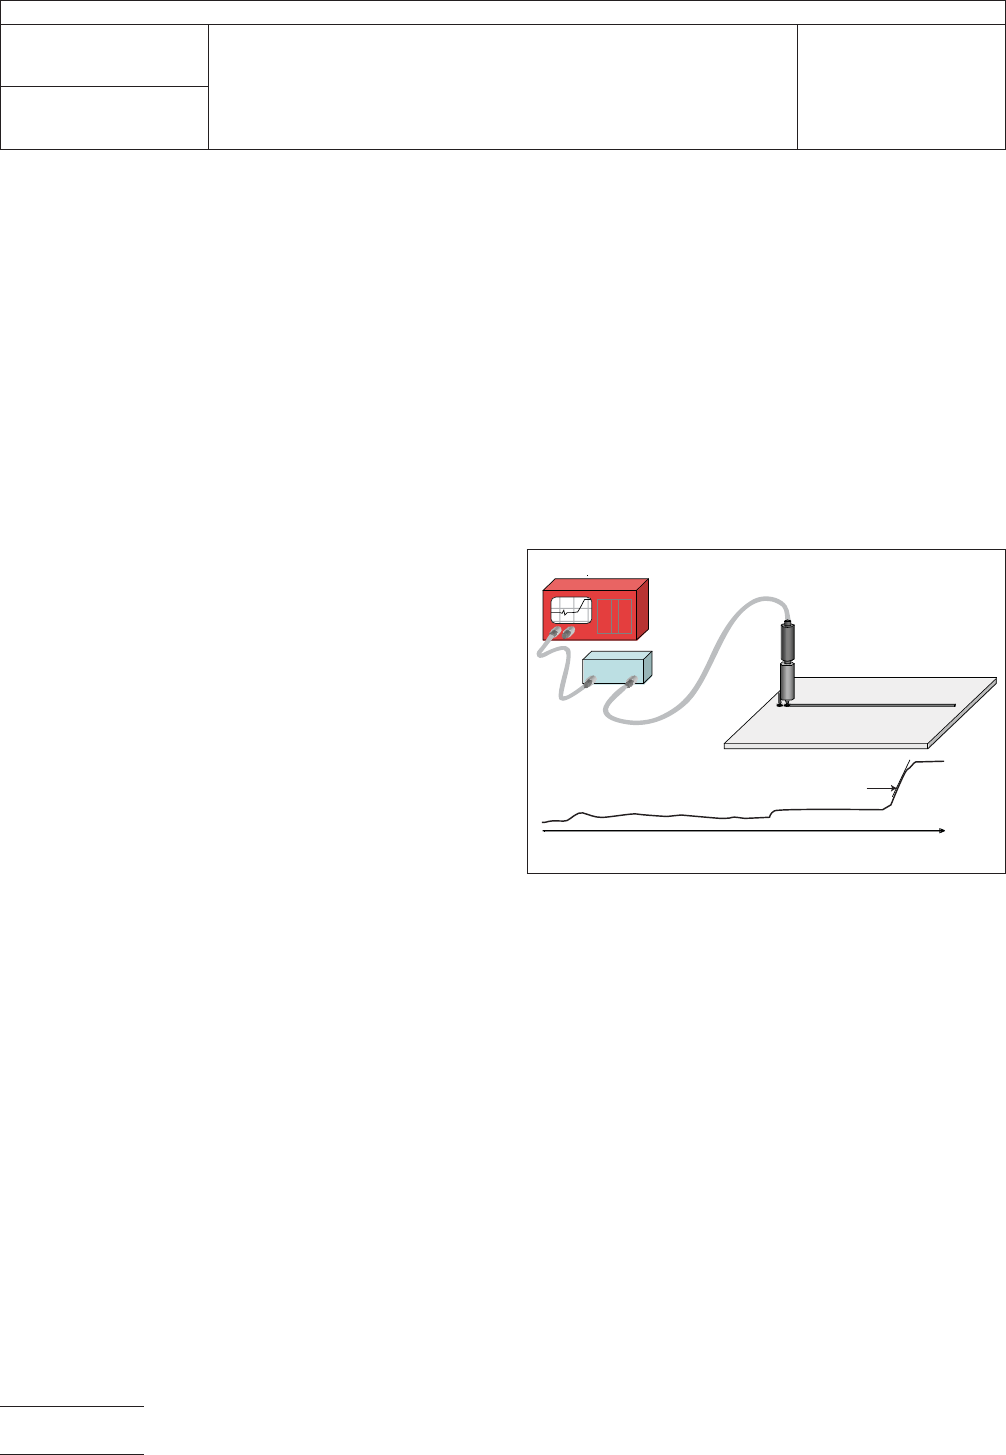
Step 1 – Probe the interconnect (see Figure 5-1) and measure
the maximum slope of the step response in Megavolts/second
(e.g., 430 Megavolts/second). The maximum slope may be
directly acquired from TDR equipment with that capability.
Step 2 – Report the Loss Factor at the test system bandwidth
(as measured within 4.4.5.1) (e.g., 430 Megavolts/second @
14.5 GHz).
5.2 RIE Measurement Procedures Figure 5-2 summa-
rizes the RIE measurement procedure.
The RIE method utilizes a comparison between a reference
loss (line) measurement and a test conductor (line) measure-
ment. The reference measurement may be a calibration stan-
dard or short length of conductor in the neighborhood and on
the same layer as the conductor to be measured.
5.2.1 TDR – Open or Unterminated Line Requirement
The RIE method requires a measurement of lines where one
end is a probe launch and the other end is left unterminated
or open. The probe injects a fast step at the launch point in
much the same manner specified in IPC-TM-650, Method
2.5.5.7. The injected step causes a wave to propagate down
the line; most of the wave is reflected by the open end of the
line and travels back to the source where it is measured as the
superposition of the incident wave and all the reflections.
IPC-25512-5-1
Figure 5-1 Measurement of Maximum Slope of Step Rise
Time at Open end of DUT
TDR Instrument
probe
SIU
Maximum
risetime
DUT
(interconnect)
Time
IPC-TM-650
Number
2.5.5.12
Subject
Test Methods to Determine the Amount of Signal Loss on
Printed Boards
Date
07/12
Revision
A
Page 12 of 24
These are the TDR waveforms used in the RIE loss calcula-
tion.
It is recommended to be positioned within 80% of the vertical
screen scale in reference to the representative waveform. The
signal on the screen must have a resolution of at least 5% of
the measured signal.
Figure 5-3 specifies two time regions. T0 and T1. The sum of
T0 and T1 represents the time range for the captured wave-
form. Figure 5-3 specifies the point between T0 and T1 which
corresponds to the point where the probe contacts the
printed board, or where the rising edge would be if the probe
were disconnected from the sample. The TDR specification
for T0 and T1 is found in Table 5-1.
Each TDR waveform is averaged on the TDR instrument at
least 16 times. The time base and offset remain the same for
all measurements.
5.2.2 Measurement and Processing Two TDR wave-
forms are captured. One corresponds to a reference and the
second corresponds to the test line.
The measured waveforms require post-processing. TDR
waveform is processed as follows:
a) Filtering
b) Cubic spline fit
c) Using derivative to find impulse response
d) Calculating RIE loss ratio
5.2.2.1 Recursive Digital Filtering of Spline Data The
two TDR waveforms are filtered using the method prescribed
in Equation 5-1.
Let S
j,0
= A
j
for k = 1 to N
?
S
j,k
=
S
2,k +
Σ
i=1
j
(
2
i-1
⋅ S
i,k
)
2
j
Assign B
j
= S
j,N
[5-1]
Where:
N is the number of filtering iterations
A
j
is the j
th
point of the on of the acquired TDR waveforms
Sj,k is the j
th
point of the k
th
filtered waveform
j is an index for the waveform points
Bj is the j
th
point of the filtered waveform
The number of filter iterations depends on the number of
samples in the acquired TDR waveform and specified in Table
5-2.
5.2.2.2 Resampling with a Cubic Spline Fit The next
step is to resample the filtered TDR data to 10,000 points (J).
This is accomplished with a cubic spline fit.
5.2.2.3 Impulse Response The impulse response of the
reference and test specimen, respectively I_R
j
and I_T
j
is cal-
culated by taking the derivative of the respective resample
step waveforms RB
j
and TB
j
. One method to perform this
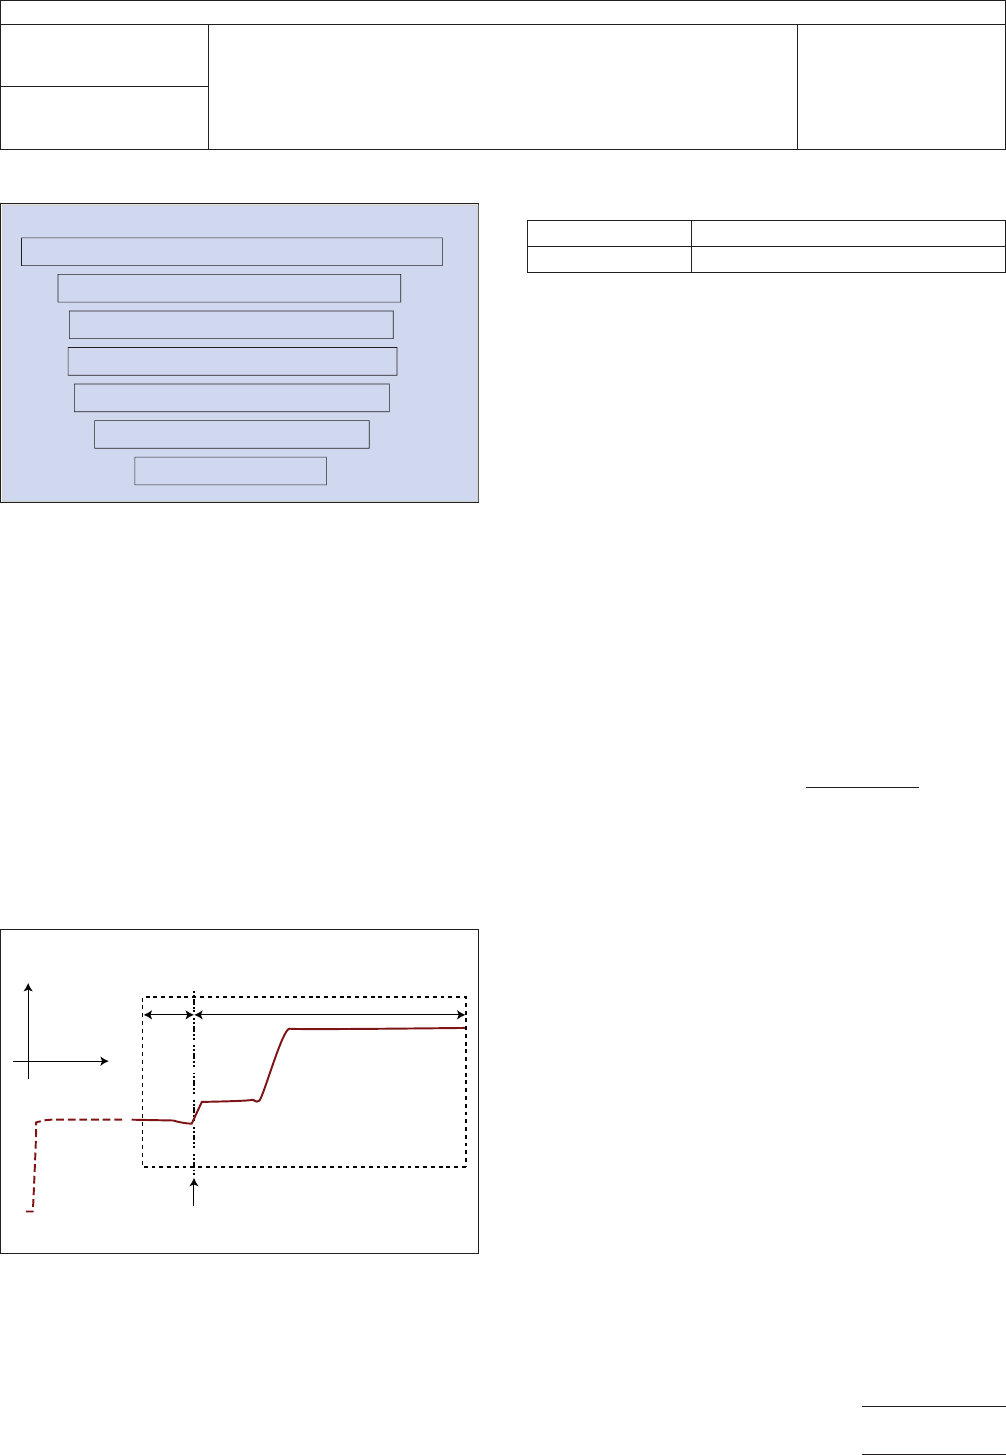
Figure 5-2 RIE Flowchart
RIE TDR PROCESS
Acquire TDR response for one reference and line under test
Averaging filter of re-sampled TDR waveforms
Cubic spline re-sampling of TDR waveforms
Perform Derivative of filtered TDR waveforms
Determine RIE loss from reference Sample
Determine RIE loss from test Sample
Determine RIE loss ratio
IPC-25512-5-3
Figure 5-3 Waveform Position on TDR Screen
Voltage
Time
Corresponds to probe launch
T0 T1
TDR Display Window for RIE
Table 5-1 RIE TDR Time Range Specifications
T0 50 ps (typical)
T1 At least twice the transit delay
IPC-TM-650
Number
2.5.5.12
Subject
Test Methods to Determine the Amount of Signal Loss on
Printed Boards
Date
07/12
Revision
A
Page 13 of 24
operation is specified in Equation 5-2.
I_R
j
=
RB
j
− RB
j−1
t
j
− t
j−1
I_T
j
=
TB
j
− TB
j−1
t
j
− t
j−1
[5-2]
5.2.2.4 RIE Results The reference structure, RIE
reference
,is
the square root of the square of the integral of the square of
the impulse response I_R, and can be calculated from J
samples as show in Equation 5-3. The test structure, RIE
test
,
is the square root of the square of the integral of the square
of the impulse response I_T, and is calculated from J samples
as show in Equations 5-3 and 5-4.
RIE
reference
=
√
Σ
j=1
J
I_R
j
2
(t
1
− t
0
)
[5-3]
RIE
test
=
√
Σ
j=1
J
I_T
j
2
(t
1
− t
0
)
[5-4]
The RIE loss in dB, RIE
loss_dB
, is calculated by dB ratio of the
RIE
test
to RIE
reference
as show in Equation 5-5.
RIE
loss_db
= 20 * log
(
RIE
test
RIE
reference
)
[5-5]
5.3 SPP Procedure Figure 5-4 summarizes the SPP mea-
surement extraction process.
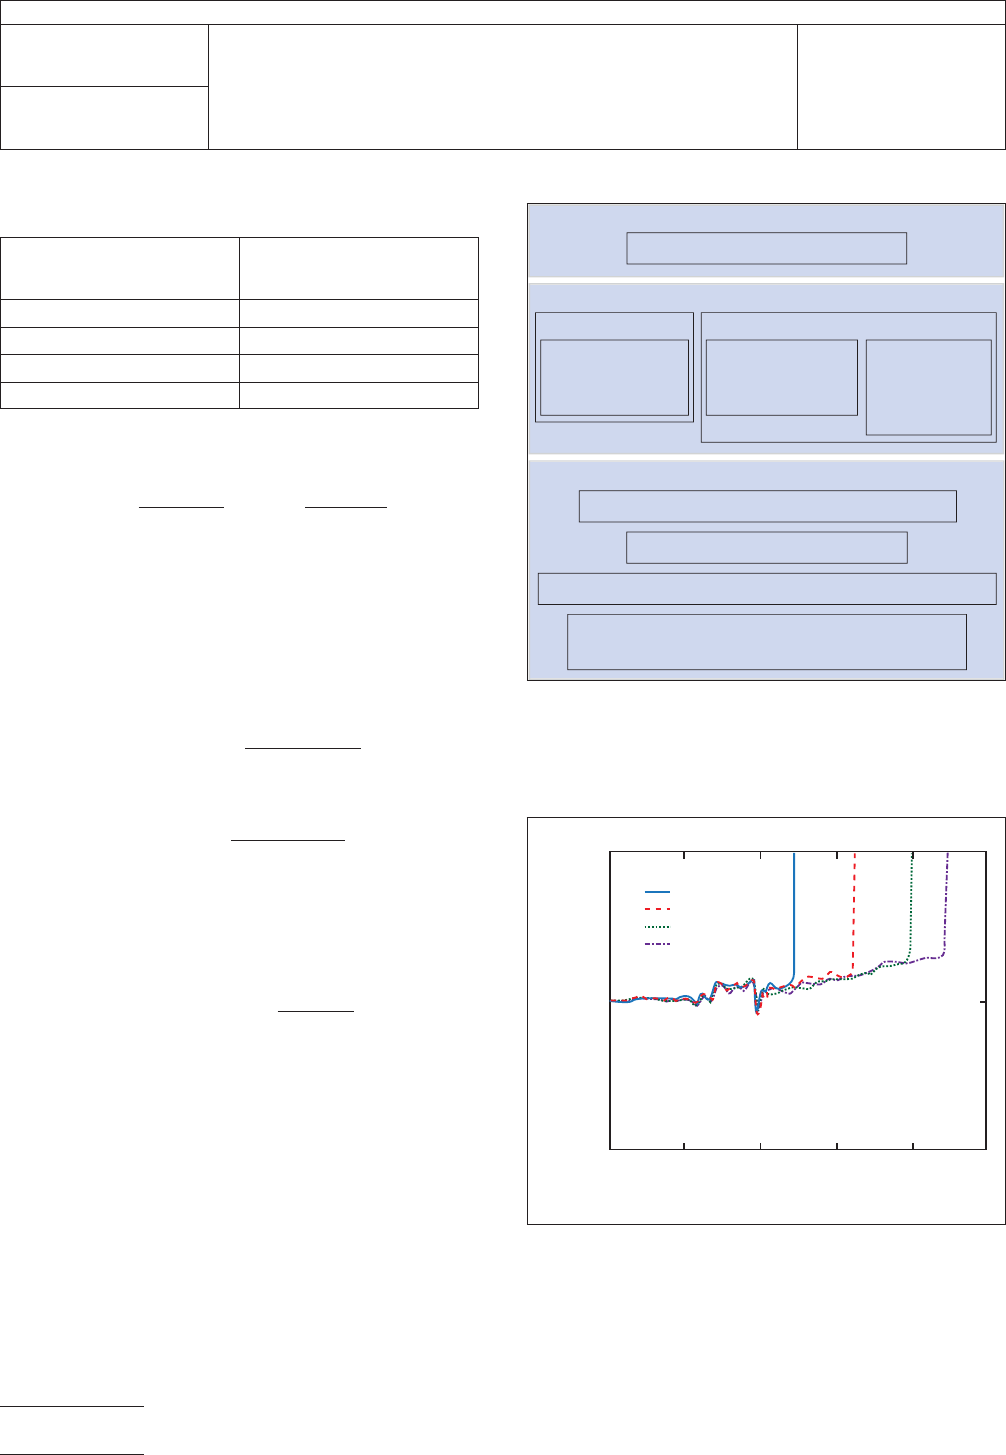
5.3.1 Selecting Optimum SPP Transmission Lines SPP
utilizes measurements on two lines of different lengths such as
2.0 cm and 8.0 cm. The pair shall be designed to be identi-
cal in every way except for length. The SPP is used to extract
parameters such as α(f) β(f), Γ(f) and Z
0
(f) by utilizing the dif-
ference between the two specimen line lengths. Effects due to
the connectors, cables, probes, and oscilloscope circuitry can
be minimized using this method. Screening the two lines
improves accuracy. Figure 5-5 illustrates lines of similar
design. Accuracy is improved when the slope and deviation
along the lengths of overlaid portions of the respective TDR
waveforms are coincident.
5.3.1.1 Additional SPP Step for Differential Lines There
are a few additional steps needed when analyzing differential
lines. The TDR screening still needs to be performed first. In
Table 5-2 Filter iterations, N, vs.
number of points, n, in TDR capture
Number of Points
in TDR capture (n)
Number of
Filtering Iterations
(N in Equation 5-1)
0>n≥750 1
750>n≥1500 2
1500 > n ≥3000 6
> n >3000 21
Figure 5-4 SPP Flowchart
TDR
Select best candidates for line pairs
Low Freq
TDT
disc
Determine
1MHzε
r
and Tan δ
(LCR meter)
Determine
Capacitance/unit
length (LCR meter)
Determine
Resistance/unit
length ρ and
(LCR meter)
Lines
Acquire Impulse response for 2 lines of 2 lengths
Window and filter Impulse response
FFT to get Propagation Constant Γ (Attenuation and Phase)
Use itrative matching of Γ, Att, and low freq
parameters to determine tline modeling parameters
IPC-25512-5-5
Figure 5-5 Example of Similar TDR Responses for
Different Lengths of Lines
0.3
0.2
0.25
1.5 2.5
Time (nsec)
Voltage (V)
3.52
1=2 cm
1=5 cm
1=8 cm
1=9.8 cm
34
IPC-TM-650
Number
2.5.5.12
Subject
Test Methods to Determine the Amount of Signal Loss on
Printed Boards
Date
07/12
Revision
A
Page 14 of 24