IPC-TM-650 EN 2022 试验方法.pdf - 第36页
Measurement Precision Study - Data Sheet Condition A Reading Sample A verage 123456789 1 0 1 2 3 4 5 Average X A = Range R A = Condition B Reading Sample A verage 123456789 1 0 1 2 3 4 5 Average X B = Range R B = Measure…

6.3
Methods for Analyzing Repeatability and Reproduc-
ibility
There
are several methods for calculating the mea-
surement precision from the data obtained during the mea-
surement precision study. Two of the most commonly applied
techniques are applied to measurements that result in vari-
ables data, and are called the Average and Range, and
ANOVA methods.
a. Average and Range Method – This method is covered in
this test method and provides an estimate of the standard
deviation of the repeatability and reproducibility using the
ranges between the highest and lowest measurements in a
subgroup. This method allows measurement variability to
be decomposed into two components, repeatability and
reproducibility. It does not estimate the interaction effects.
b. The ANOVA (Analysis of Variance) – This method uses a
components of variance technique to decompose the
measurement variability into various categories, such as,
parts, operators, test equipment, etc. It can calculate the
interaction between any of these components. It is more
flexible, but is more challenging to calculate. This method
generally requires a computer and a certain degree of
expertise to interpret. The analysis method is described in
the references, see 6.4.
Measurements which result in binary data, such as go and
no-go, or pass and fail tests, can be analyzed for consistency
and correctness of disposition, see IPC Test Method IPC-TM
1.8.
In some cases, the measurement cannot be repeated more
than once on the same sample. This is common where the
sample is consumed during the test, such as chemical analy-
sis, or changed during testing, such as solderability evalua-
tions. In these cases, the analysis using a modified average
and range method is possible. This method is currently under
development.
6.4
References
a.
ISO 5725-1 Accuracy (trueness and precision) of measure-
ment methods and results (parts 1 to 6), 1998(E), Interna-
tional Organization for Standardization, Geneva, Switzer-
land (www.iso.org).
b. Measurement Systems Analysis, 2nd edition, June 1998,
Automotive Industry Action Group (AIAG), 26200 Lahser
Road, Southfield, MI 48034 (www.aiag.org).
c. Standard Practice for Conducting an Interlaboratory Study
to Determine the Precision of a Test Method, E691-99,
ASTM, Philadelphia, PA (www.astm.org).
d. Concepts for R&R Studies, Larry B. Barrentine, (ISBN
0-87389-108-2), ASQC Press, Milwaukee, WI (www.quali-
typress.asq.org).
e. Statistical Process Control Guidelines, Texas Instruments,
Dallas, TX
f. Introduction to Statistical Process Control, 3rd edition,
Douglas C. Montgomery, 1997, John Wiley and sons,
ISBN 0-471-30353-4, pages 455-467
g. Basic Statistics, 4th Edition, Mark J Kiemele, Stephen R.
Schmidt, Ronald Berdine, Air Academy Press, 1997, ISBN
1-880156-06-7, pages 9-71 to 9-77.
h. ‘‘Is 100% Test 100% Effective,’’ W. Russell, 1998 IPC
EXPO, San Jose, CA (gives methods for calculating the
likely outcomes on product test for differing levels of mea-
surement precision.)
6.5
Software
Measurement
precision studies are greatly
facilitated by use of software to perform the calculations.
Below are just a few of the many software packages that can
be used for this purpose. Reference (a) is an Excel spread-
sheet written to perform the calculations in this procedure.
a. Measurement Precision Calculator, Excel spreadsheet,
available at http://www.ipc.org/html/testmethods.htm for
free download.
b. Statgraphics Plus, Manugistics Corp, 2115 East Jefferson
Street, Rockville, MD, 20852-4999 (www.statgraphic-
s.com).
c. SPC XL, Air Academy Press, 1155 Kelly Johnson Blvd,
Colorado Springs, CO 80920 (www.airacad.com).
d. Minitab, Minitab. Inc., 3081 Enterprise Dr, State College,
PA 16801 (www.minitab.com).
e. Interlaboratory Data Analysis Software for E691, ASTM,
100 Barr Harbor Dr, West Conshohocken, PA 19428
(www.astm.org).
IPC-TM-650
Number
1.9
Subject
Measurement
Precision Estimation for Variables Data
Date
01/03
Revision
A
P
age5of10
电子技术应用 www.ChinaAET.com
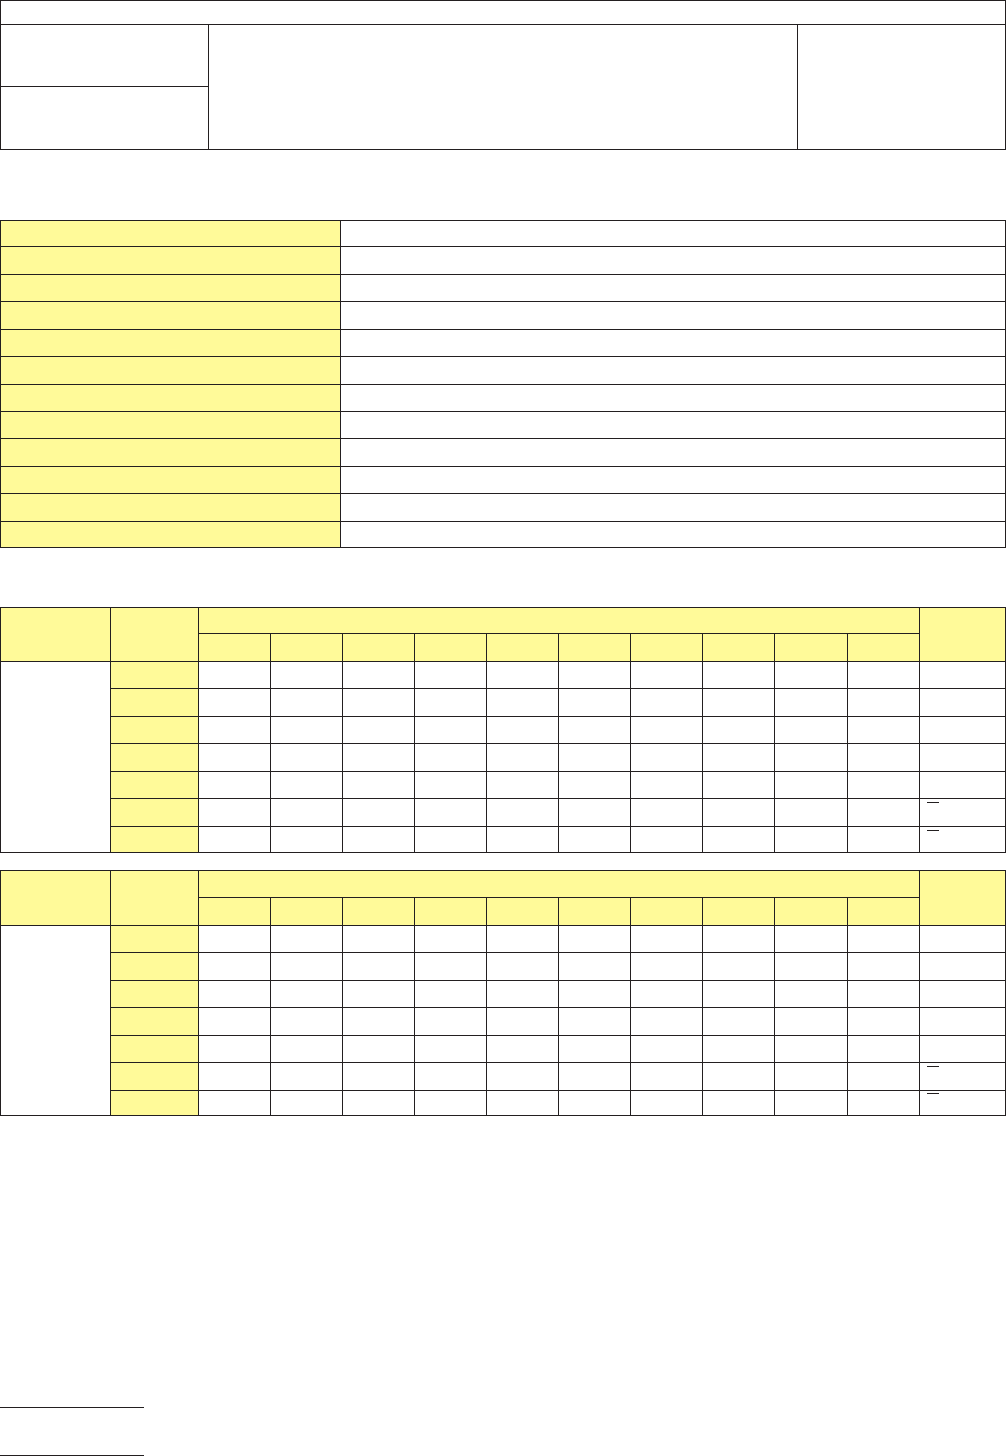
Measurement
Precision Study - Data Sheet
Condition
A Reading
Sample
Average12345678910
1
2
3
4
5
Average
X
A
=
Range
R
A
=
Condition
B Reading
Sample
Average12345678910
1
2
3
4
5
Average
X
B
=
Range
R
B
=
Measurement
Precision Study - Information Sheet
Test
Method
Parameter Measured
Company
Name of Study Organizer
Study Completion Date
Instrument
Measurement Units
Lower Specification Limit, LSL
Upper Specification Limit, USL
Number of Conditions, m
Number of Samples, n
Number of Repeat Readings, k
IPC-TM-650
Number
1.9
Subject
Measurement
Precision Estimation for Variables Data
Date
01/03
Revision
A
P
age6of10
电子技术应用 www.ChinaAET.com
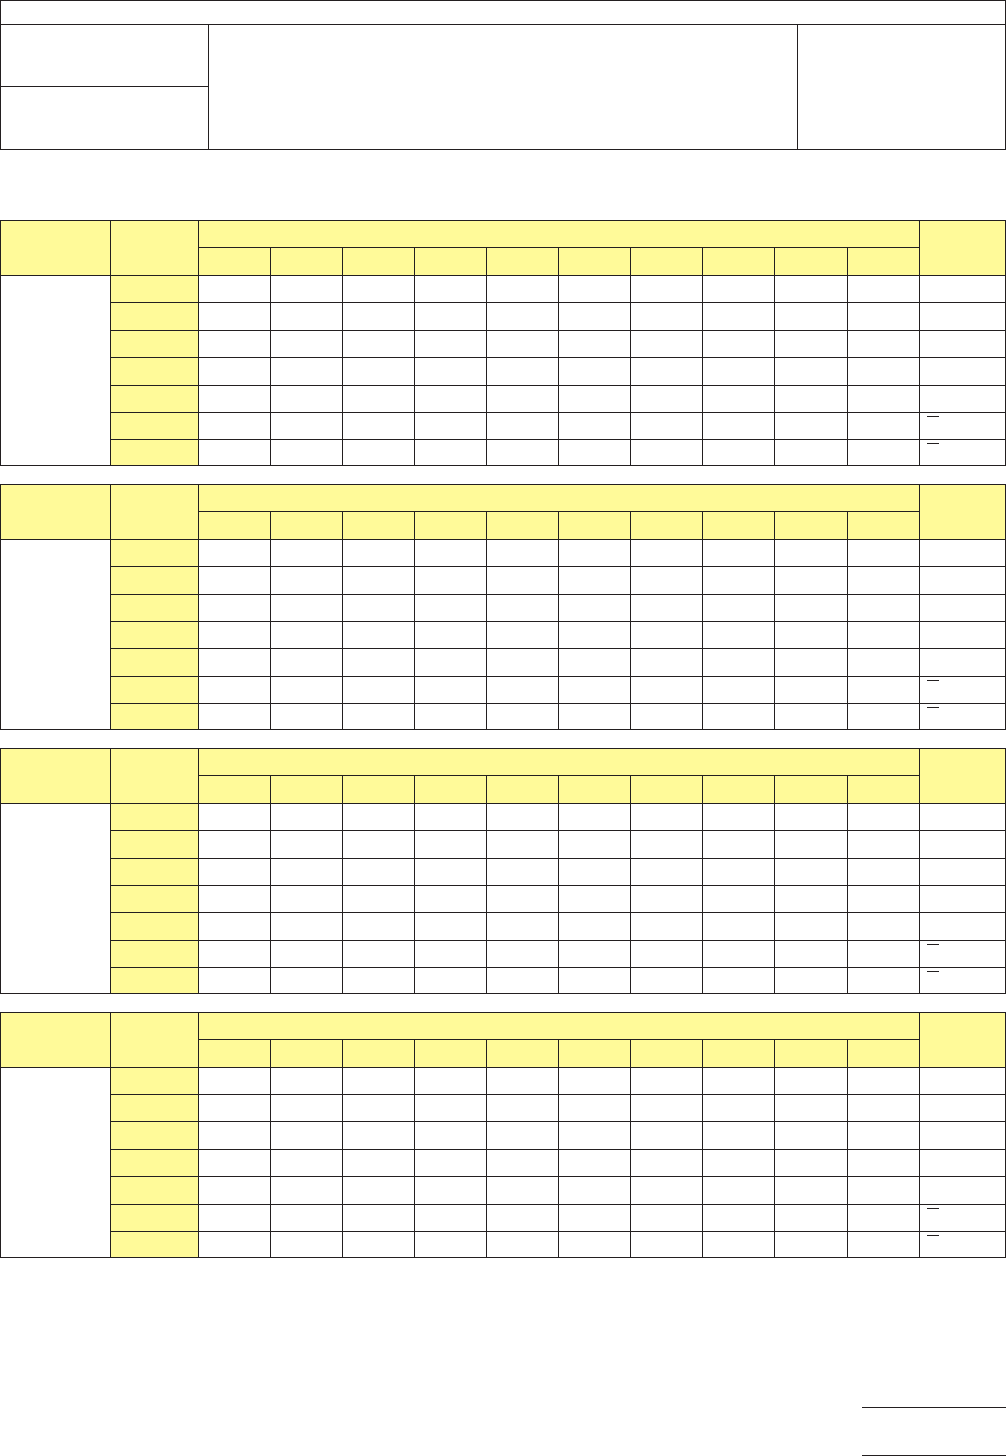
Measurement
Precision Study - Data Sheet (continued)
Condition
C Reading
Sample
Average12345678910
1
2
3
4
5
Average
X
C
=
Range
R
C
=
Condition
D Reading
Sample
Average12345678910
1
2
3
4
5
Average
X
D
=
Range
R
D
=
Condition
E Reading
Sample
Average12345678910
1
2
3
4
5
Average
X
E
=
Range
R
E
=
Condition
F Reading
Sample
Average12345678910
1
2
3
4
5
Average
X
F
=
Range
R
F
=
IPC-TM-650
Number
1.9
Subject
Measurement
Precision Estimation for Variables Data
Date
01/03
Revision
A
P
age7of10
电子技术应用 www.ChinaAET.com