IPC-TM-650 EN 2022 试验方法.pdf - 第397页
This fixture is designed to minimize frictional effects by allow- ing the support rollers to rotate and move apart slightly as the specimen is loaded, thus permitting rolling contact. Thus, the support rollers are allowe…
6.3.3 The load corresponding to a 2.5 % apparent incre-
ment of crack extension is established by a specified deviation
from the linear portion of the record. The K
1c
value is calcu-
lated from this load by equations that have been established
on the basis of elastic stress analysis on other specimens suf-
ficiently large to show linear elastic behavior.
6.3.4 After breaking, the interface should appear smooth
and glossy. A layered or hazy surface indicates deformation
as a failure mechanism rather than cracking, and invalidates
the test results. After testing, measure the depth of the crack
from the notch depth at three locations along the width of the
sample. Also measure the depth of the crack from the top of
the sample (at the same three locations).
6.3.5 Determining the load displacement area or G
1c
requires an accurate integration of the load versus loading
point displacement curve, including an accurate displacement
determination using the displacement transducer.
7 Analysis Fracture toughness testing is recommended to
be performed at least twice per year.
7.1 Calculation and Interpretation of Results (reference
ASTM D5045, Section 9).
7.1.1
In order to establish that a valid K
1C
has been deter-
mined, it is first necessary to calculate a conditional result, K
Q
,
which involves a construction on the test record, and to then
determine whether this result is consistent with the size of the
specimen in accordance with 7.1.6. The procedure is given in
7.1.2 through 7.1.8.
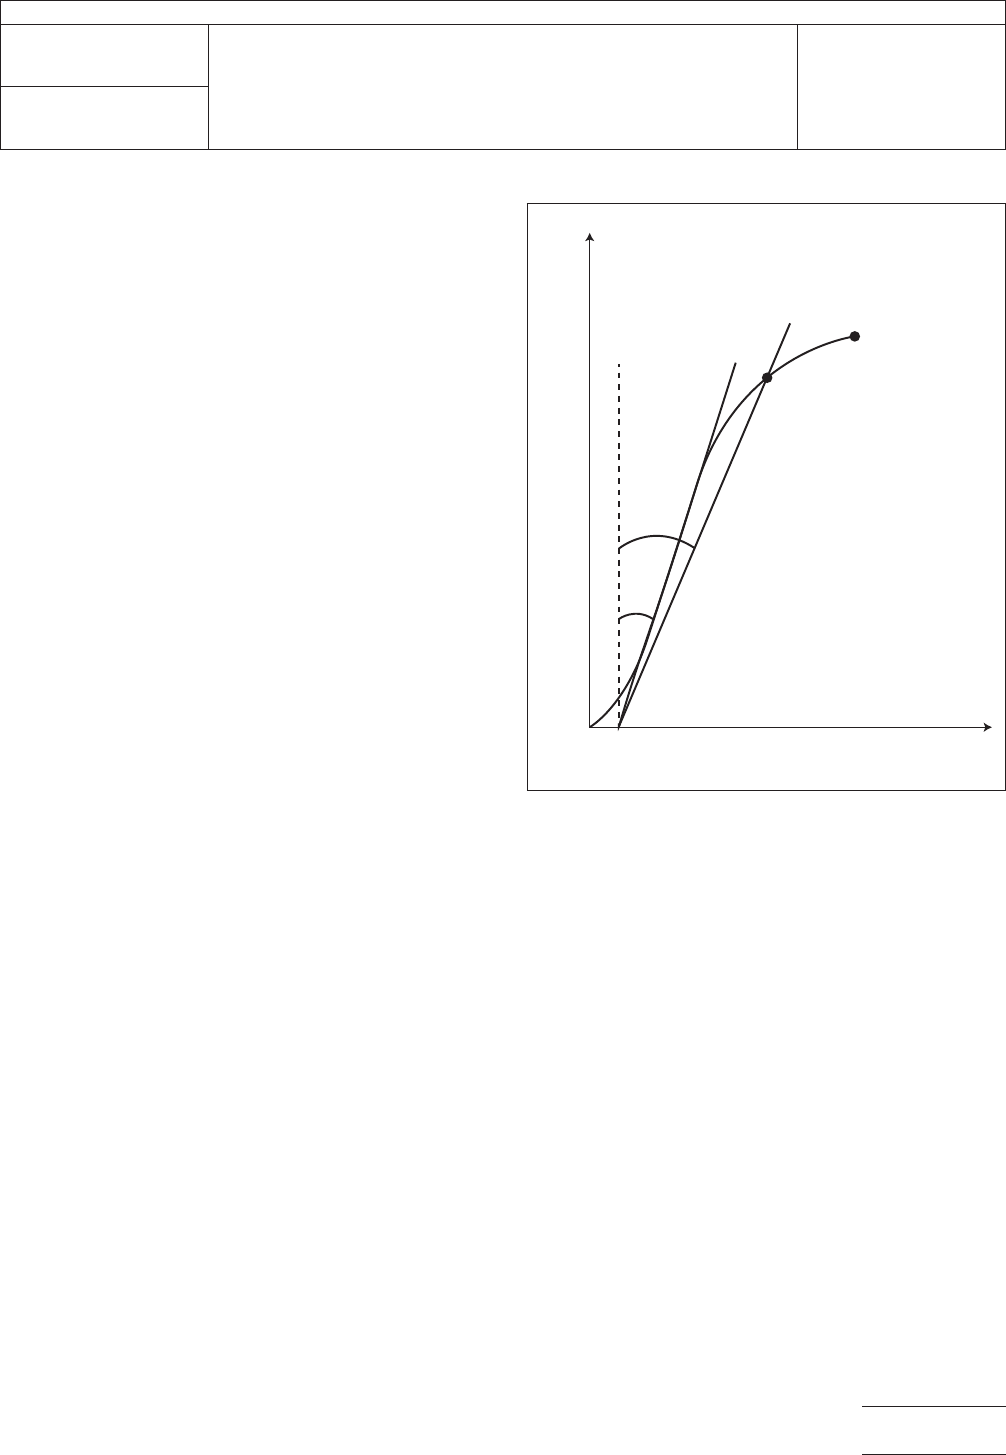
7.1.2 Load the specimen and obtain a P (load) versus u
(displacement) plot (see Figure 7-1).
Draw a best straight line (AB) to determine the initial compli-
ance, C. C is given by the reciprocal of the slope of line (AB).
Draw a second line (AB’) with a compliance 5 % greater than
that of line (AB). If the maximum load that the specimen was
able to sustain, Pmax, falls within lines (AB) and (AB’), use
Pmax to calculate K
Q
. If Pmax falls outside line (AB) and line
(AB’), then use the intersection of line (AB’) and the load curve
as P
Q
. Furthermore, if Pmax/P
Q
<1.1, use P
Q
in the calcula-
tion of K
Q
. However, if Pmax/P
Q
>1.1, the test is invalid.
7.1.3 Calculate K
Q
in accordance with the procedure for
single edge notch bending in 7.1.4. For this calculation, a
value of a, which is the total crack length after both notching
and pre-cracking, but before fracture, is best determined from
the fracture surface after testing. An average value is used,
but the difference between the shortest and longest length
should not exceed 10 %. Take care that it is the original crack
which is being observed, since slow growth can occur prior to
catastrophic fast fracture.
7.1.4 (Reference ASTM D5045, Section A1.4). The general
formula for K
Q
calculation of bend specimens is given in [Ref.
3]. The general principles of the bend-test fixture are illustrated
in Figure 7.2.
2-4-52-7-1.eps
Figure 7-1 Determination of C and P
Q
P
A
u
Notes:
• Compliance (C) = tan
θ =
inverse slope of line AB
• 1.05 C = tan θ
'
θ
'
θ
B
B
'
P
Q
P
max
IPC-TM-650
Number
2.4.52
Subject
Fracture Toughness of Resin Systems for Base Materials
Date
07/13
Revision
Page3of8
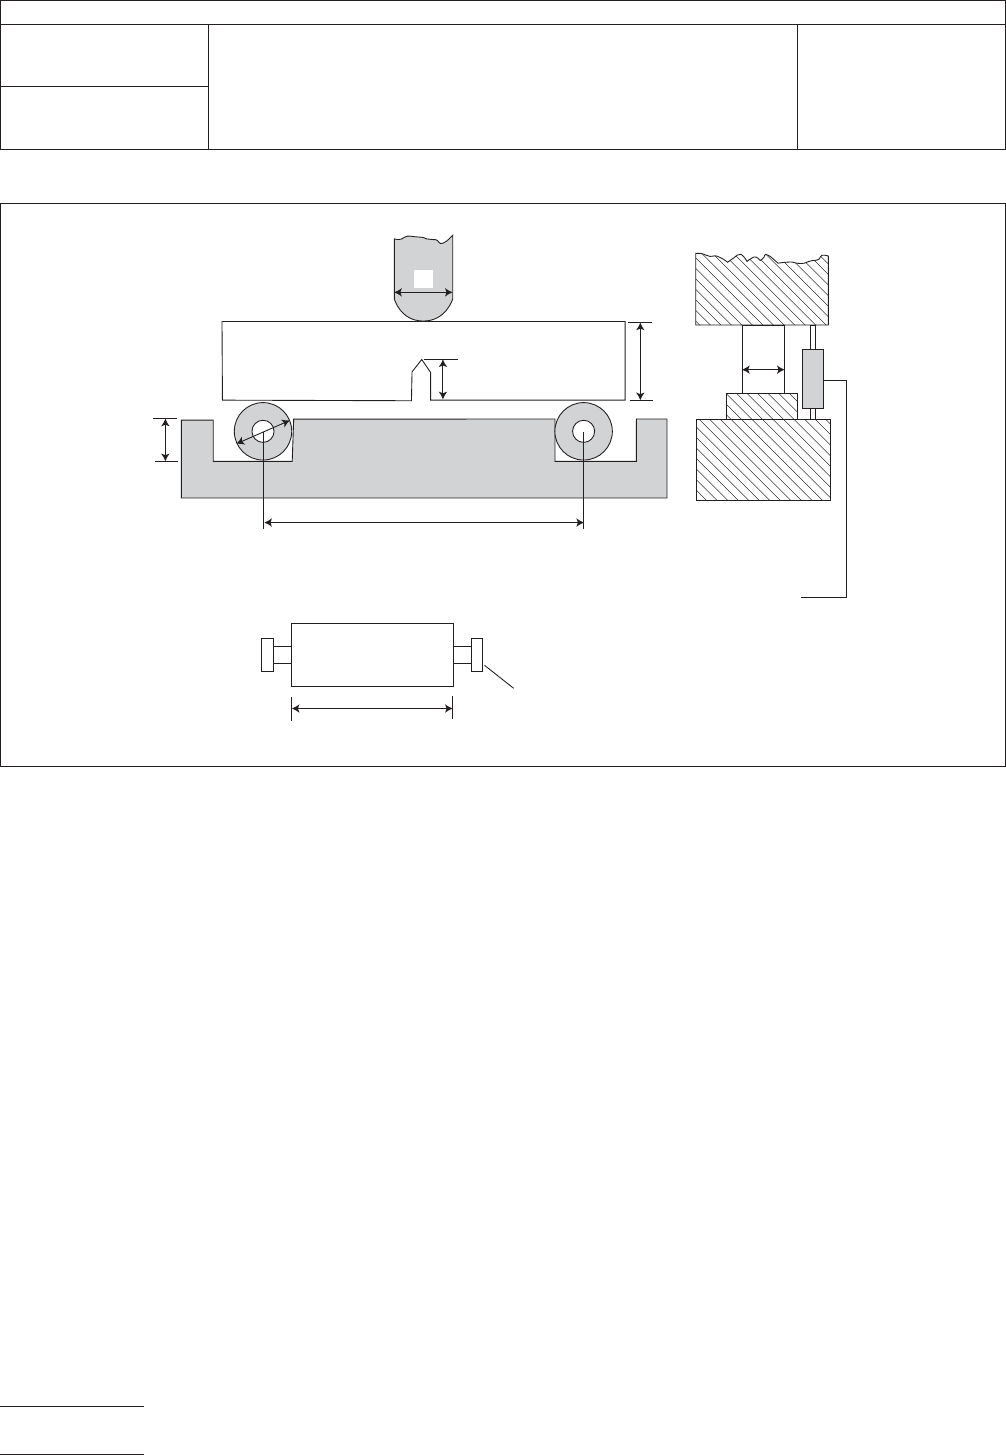
This fixture is designed to minimize frictional effects by allow-
ing the support rollers to rotate and move apart slightly as the
specimen is loaded, thus permitting rolling contact. Thus, the
support rollers are allowed limited motion along the plane sur-
faces parallel to the notched side of the specimen, but are ini-
tially positively positioned against stops that set the span
length at 50 mm, and are held in place by low-tension springs
(such as rubber bands). For the bend specimen, the displace-
ments will be essentially independent of the gauge length up
to a gauge length of W/2. For bend specimens with S/W = 4,
K
Q
in units of MPa Ë m
1/2
is as follows:
K
Q
=(P
Q
/BW
1/2
) ƒ(x)
where (0<x<1):
ƒ(x) = 6x
1/2
(1.99 - x(1-x)(2.15 - 3.93x + 2.7x
2
))/(1+2x)
(1-x)
3/2
and:
P
Q
= load as determined in 7.1.2, kN,
B = specimen thickness, cm,
W = specimen depth (width), cm,
a = crack length, cm
and
x = a/W.
2-4-52-7-2.eps
Figure 7-2 Bending Rig with Transducer for Single-Edge-Notch Bending (SENB)
Busses For Rubber Bands (see ASTM E399)
W/2 < D < W
Displacement Transducer
Support Rollers
a
B
W
0.6D
D
B
S = 4W
D
IPC-TM-650
Number
2.4.52
Subject
Fracture Toughness of Resin Systems for Base Materials
Date
07/13
Revision
Page4of8
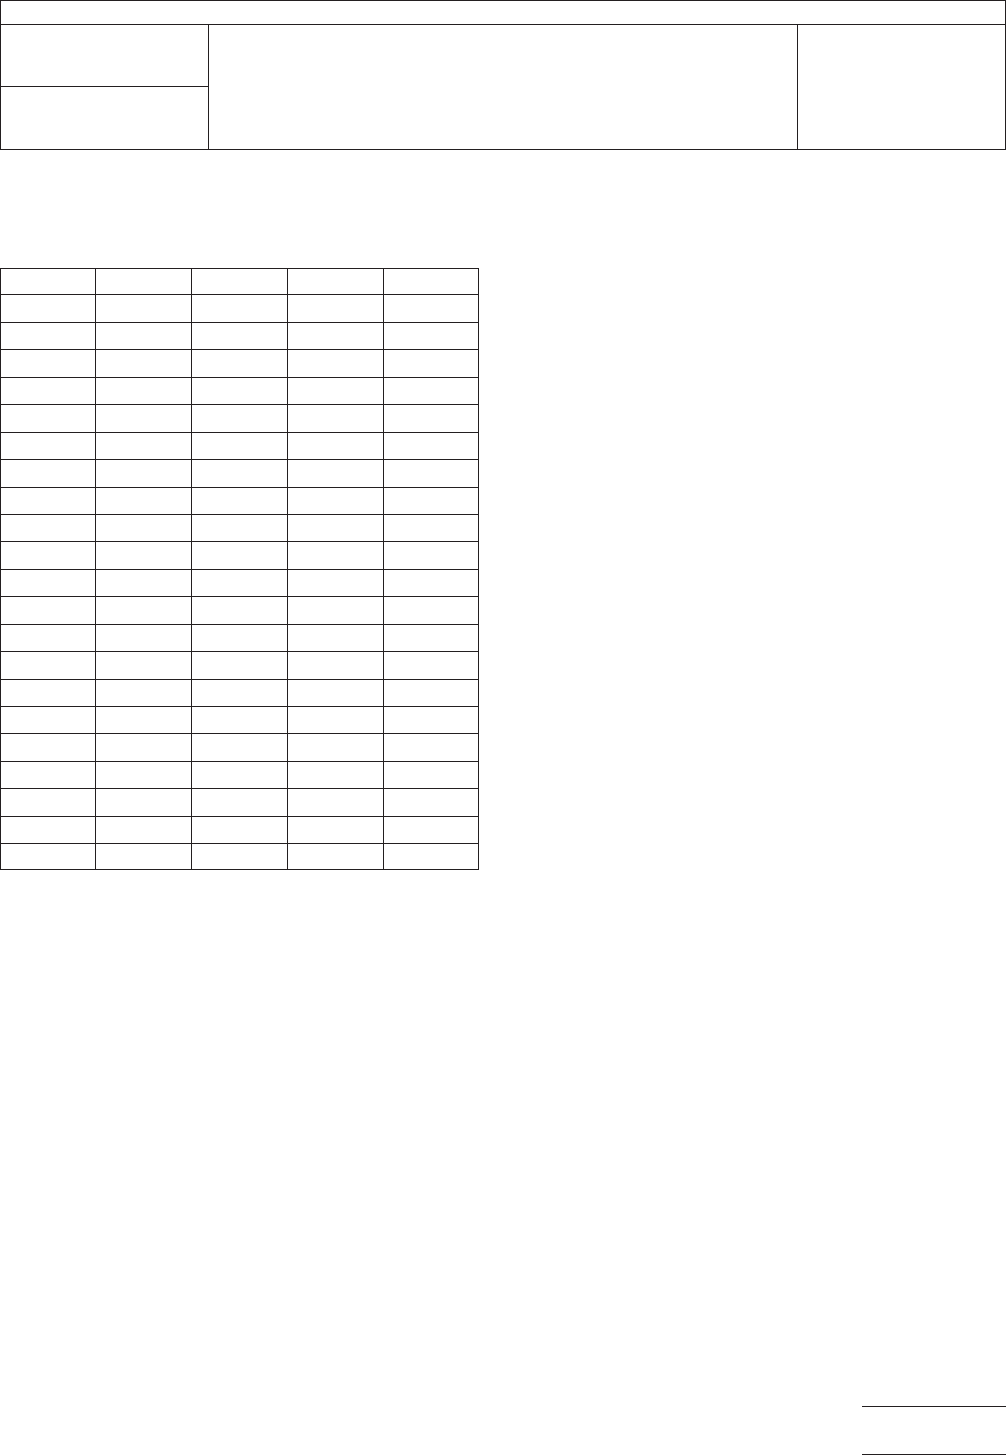
Tabulated values of ƒ(x) are given in Table 7-1.
7.1.5 For the bend specimens calculate G
Q
[=] kJ/m2 from
the corrected energy, U, as follows:
G
Q
= U/(BWΦ )orG
Q
= η
e
U/(B(W - a))
Values of η
e
are given in Table 7-1. The energy calibration
factor, Φ, is defined as:
Φ = C/(dC/d(A/W))
and shall be computed from the following:
Φ = (A + 18.64)/(dA/dx)
where:
A = [16x
2
/(1-x)
2
][8.9 - 33.717x + 79.616x
2
- 112.952x
3
+
84.815x
4
- 25.672x
5
],
and:
dA/dx = [16x
2
/(1-x)
2
][-33.717 + 159.232x - 338.856x
2
+
339.26x
3
- 128.36x
4
]
+ 16[8.9 - 33.717x + 79.616x
2
-112.952x
3
+ 84.815x
4
-
25.672x
5
]{[2x(1 - x) + 2x
2
]/(1 - x)
3
}
Values of Φ are given in Table 7-1.
7.1.6 (Reference ASTM D5045, Section 9.1.3) Check the
validity of K
Q
via the size criteria. Calculate 2.5 (K
Q
/σ
y
)
2
where
σ
y
is the yield stress. If this quantity is less than the specimen
thickness, B, the crack length, a, and the ligament (W - a),
then K
Q
is equal to K
1c
. Otherwise the test is not a valid K
1c
test.
NOTE: Use of a specimen with too small a thickness, B, will
result in K
Q
being higher than the true K
1c
value while a small
(W - a) will result in a K
Q
value that is lower than the true K
1c
value. The net effect may be close to the correct K
1c
but
unfortunately in an unpredictable way, since the dependence
on B cannot be quantified.
7.1.7 For the recommended specimen dimensions of W =
2B and a/W = 0.5, all the relationships of 7.1.6 are satisfied
simultaneously. In fact, the criterion covers two limitations in
that B must be sufficient to ensure plane strain, but (W - a) has
to be sufficient to avoid excessive plasticity in the ligament. If
(W - a) is too small the test will often violate the linearity crite-
ria. If the linearity criterion is violated, a possible option is to
increase W for the same a/W and S/W ratios. Values of W/B
of up to 4 are permitted.
7.1.8 If the test result fails to meet the requirements in either
7.1.2 or 7.1.6, or both, it will be necessary to use a larger
specimen to determine K
Q
. The dimensions of the larger
specimen can be estimated on the basis of K
Q
, but generally
must be increased to 1.5 times those of the specimen that
failed to produce a valid K
1c
value.
7.2 Displacement Correction for Calculation of G
Q
(Ref-
erence ASTM D5045, Section 9.2)
Make a displacement correction for system compliance,
loading-pin penetration, and specimen compression, then cal-
culate G
1C
from the energy derived from integration of the
load versus load-point displacement curve.
7.2.1 The procedure for obtaining the corrected displace-
ment, u
c
(P), at load P from the measured displacement, u
Q
(P), is as follows: Use an un-cracked displacement correction
specimen prepared from the same material as that being
tested. Using the same testing parameters as the actual test,
load the specimen to a point at or above the fracture loads
observed during actual testing. From the load-displacement
Table 7-1 Calibration Factors SENB
A
S/W =4
a/W ƒ (x) Φψη
e
0.450 9.14 0.274 45.8 2.00
0.455 9.27 0.272 46.7 2.00
0.460 9.41 0.269 47.6 2.01
0.465 9.55 0.266 48.5 2.01
0.470 9.70 0.263 49.5 2.02
0.475 9.85 0.260 50.4 2.02
0.480 10.00 0.257 51.4 2.03
0.485 10.16 0.254 52.5 2.03
0.490 10.32 0.252 53.5 2.03
0.495 10.48 0.249 54.7 2.03
0.500 10.65 0.246 55.8 2.03
0.505 10.82 0.243 57.0 2.03
0.510 10.99 0.241 58.2 2.04
0.515 11.17 0.238 59.4 2.04
0.520 11.36 0.236 60.7 2.04
0.525 11.54 0.233 62.1 2.04
0.530 11.74 0.230 63.5 2.04
0.535 11.94 0.228 64.9 2.04
0.540 12.14 0.225 66.4 2.04
0.545 12.35 0.223 67.9 2.04
0.550 12.56 0.220 69.5 2.05
A
Values calculated using A. Bakker, Compatibility Compliance and Stress
Intensity Expressions for the Standard Three-Point Bend Specimens. Paper
submitted for publication in International Journal of Fatigue and Fracture of
Engineering Materials and Structures (March 1989).
IPC-TM-650
Number
2.4.52
Subject
Fracture Toughness of Resin Systems for Base Materials
Date
07/13
Revision
Page5of8