IPC-TM-650 EN 2022 试验方法.pdf - 第680页
1 Scope This test method is used to quantify the deleteri- ous effects of fabrication, process or handling residues on Surface Insulation Resistance (SIR) in the presence of mois- ture. The electrodes are long parallel t…
geometric
mean of the sample set and can be calculated from
the following:
IR
avg
= 10
[
1
N
Σ
1
N
log
10
(IR)
i
]
Where:
N
= Number of Test Points (12 nominal for each set of three
patterns).
IR
i
=
individual insulation resistance measurements (see 6.6
for an example).
No individual insulation resistance value may be more than a
factor of 10 below the specified minimum value.
Where an assignable cause of low insulation resistance, which
is properly attributable to the laminate itself, or to the process
used to produce the PCB, can be found, then such a value
can be excluded from calculating the average value, provided
that at least 10 (of the original 12) test points are included in
the average.
Such assignable causes include the following:
• Contamination on the insulating surface of the board, such
as lint, solder splines or water droplets from the chamber.
• Incompletely etched patterns that decrease the insulating
space between the conductors by more than the amount
allowed in the appropriate design requirements drawing.
• Scratched, cracked, or obviously damaged insulation
between conductors.
5.7
Visual Analysis
Discoloration
of the patterns (green,
blue-green, blue, or blue-black coloration of the conductors)
shall be considered a failure.
6
Notes
6.1
If
condensation occurs on the test specimens in the
environmental chamber while the samples are under voltage,
dendritic growth will occur. This can be caused by a lack of
sufficient control of the humidification of the oven. Water spot-
ting may also be observed in some ovens where the airflow in
the chamber is from back to front. In this case, water conden-
sation on the cooler oven window can be blown around the
oven as micro-droplets which deposit on test specimens and
cause dendritic growth if the spots bridge the distance
between two electrified conductors. Both of these conditions
must be eliminated for proper testing.
6.2 Tight
control of the test humidity is critical for this test
method. A difference of 5% relative humidity can result in a
0.5 - 1.0 decade difference in the measured resistance. . The
uniformity of the environment is also important. A fully loaded
chamber, where airflow is severely impeded, may have a
30-40% RH range within the chamber workspace.
6.3
The
polarity of the applied voltage is not important as
long as the application is consistent (e.g., Pads 1, 3, 5 are
positive and 2, 4 are at ground potential, vs. Pads 2 and 4
positive, and Pads 1, 3, 5 at ground potential).
6.4
The
0.318 mm [0.0125 in] lines/space pattern can also
be found on the obsolete IPC-B-25 standard test board. This
board was re-designed for improved SIR measurement accu-
racy (better routing of traces) and carries the designation IPC-
B-25A. Pattern D of the B-25A board is preferred over the B/E
pattern of the IPC-B-25.
6.5
IR
ave
is
also referred to as the geometric mean of the
data set. Most spreadsheet packages contain functions for
calculating the geometric mean of a data set. If you are com-
puting the geometric mean of a large dataset, the spread-
sheet may come back with an error because the number is so
large. In such cases, use the antilog of the LogOhm average
to arrive at the geometric mean. See the following example.
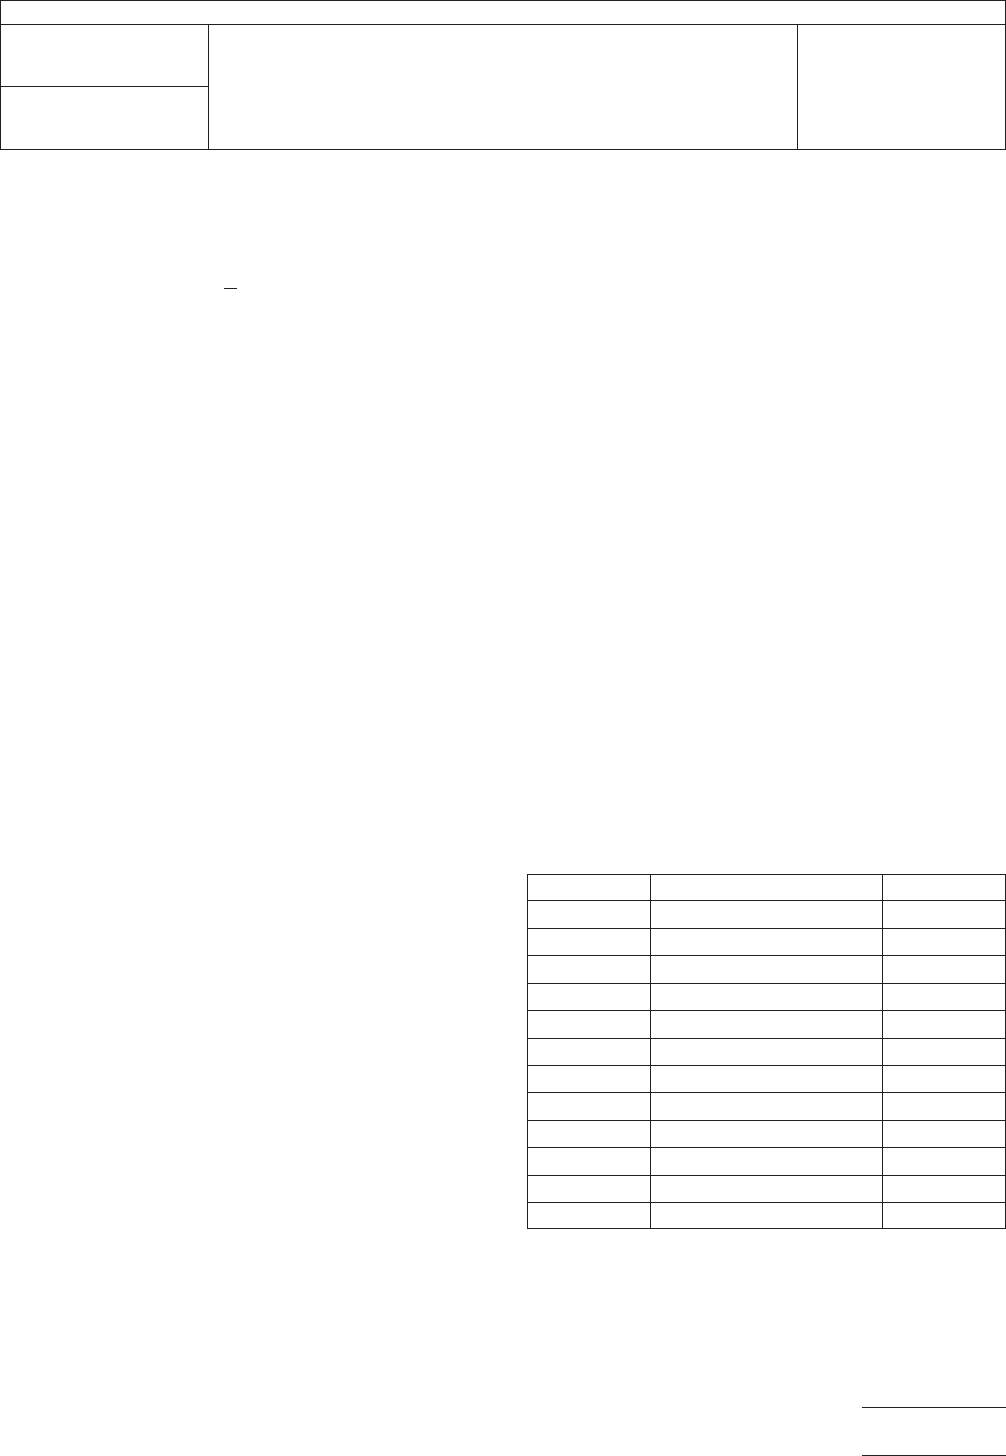
6.6
Example of Numerical Calculations
Three
5-point test patterns (4 measurements each)
LogOhms = base-10 logarithm of measured resistance
Average of LogOhms = 11.84
Antilog of LogOhm Average = 6.94E+11 ohms =
Geometric Mean = IR
ave
No.
Resistance (Ohms) LogOhms
1
3.98E+11 11.60
2 1.58E+11 11.20
3 6.31E+11 11.80
4 7.94E+11 11.90
5 1.00E+12 12.00
6 1.00E+12 12.00
7 3.98E+11 11.60
8 1.58E+12 12.20
9 1.26E+12 12.10
10 1.26E+12 12.10
11 1.00E+12 12.00
12 3.98E+11 11.60
IPC-TM-650
Number
2.6.3.6
Subject
Surface
Insulation Resistance - Fluxes - Telecommunications
Date
01/04
Revision
P
age3of3
电子技术应用 www.ChinaAET.com
1 Scope This test method is used to quantify the deleteri-
ous effects of fabrication, process or handling residues on
Surface Insulation Resistance (SIR) in the presence of mois-
ture. The electrodes are long parallel traces (printed inter-
digitated comb patterns) on a standardized printed board or
assembly. Samples shall be conditioned and measurements
taken at a high humidity. Electrodes are electrically biased
during conditioning to facilitate electrochemical reactions.
Specifically, this method is designed to:
• Simultaneously assess
a) leakage current caused by ionized water films and
b) electrochemical degradation of test vehicle, (corrosion,
dendritic growth).
• Provide metric(s) that can appropriately be used for binary
classification (e.g., go/no go, pass/fail).
• Compare, rank or characterize materials and processes.
2 Applicable Documents
2.1 IPC
IPC-A-24-G-KIT
1
Surface Insulation Resistance - Gerber Kit
J-STD-004 Requirements for Soldering Fluxes
IPC-A-600 Acceptability of Printed Boards
IPC-9201 Surface Insulation Resistance Handbook
2.2 American Society for Testing and Materials (ASTM)
ASTM D 257
Standard Test Methods for DC Resistance or
Conductance of Insulating Materials
2.3 American National Standards Institute (ANSI)/NCSL
International
ANSI/NCSL Z540-1
Calibration Laboratories and Measuring
and Test Equipment - General Requirements
ANSI/NCSL Z540-2 American National Standard for
Expressing Uncertainty - U.S. Guide to the Expression of
Uncertainty in Measurement
2.4 International Electrotechnical Commission
IEC-61189-5
Test methods for electrical materials, intercon-
nection structures and assemblies - Test methods for printed
board assemblies
3 Test Samples The type and number of test samples
(coupons) as well as method of preparation and test require-
ments should be described in the governing specification
(e.g., J-STD-004) or procurement documentation.
If this test method is being used as a stand-alone document,
decisions should be made regarding what samples might be
the most appropriate for test. This SIR method should not be
considered standard unless standard test vehicles are used.
Vehicles prepared for flux qualification shall be handled in a
way that minimizes the possibility of ionic contamination. Use
of ion-free gloves and wrap/bags is required. If testing a pro-
cess, standard shipping and handling procedures shall be
used.
For further information about sampling and sampling sizes see
7.1 and 7.1.2.
The IPC-A-24-G-KIT artwork package provides the necessary
Gerber files for the fabrication of the standard IPC-B-24 test
board used with this test method.
3.1 Test Controls Two cleaned bare IPC-B-24 test boards
(bare copper on FR-4) shall be used as chamber controls.
3.1.1 Visually inspect the boards for any obvious defects, as
described in IPC-A-600. If there is any doubt about the over-
all quality of any test sample, the board should be discarded.
3.1.2 Clean each control board by using deionized or dis-
tilled water and scrubbing with a soft bristle brush for a mini-
mum of 30 seconds. Spray rinse thoroughly with deionized or
distilled water. Rinse cleaned area thoroughly with virgin
2-propanol.
An alternative cleaning method is to place the test board in an
ionic contamination tester containing 75% 2-propanol, 25%
deionized water and process the solution until all ionics have
been removed.
1. www.ipc.org/onlinestore
3000 Lakeside Drive, Suite 309S
Bannockburn, IL 60015-1249
IPC-TM-650
TEST METHODS MANUAL
Number
2.6.3.7
Subject
Surface Insulation Resistance
Date
03/07
Revision
Originating Task Group
SIR Task Group (5-32b)
Material in this Test Methods Manual was voluntarily established by Technical Committees of IPC. This material is advisory only
and its use or adaptation is entirely voluntary. IPC disclaims all liability of any kind as to the use, application, or adaptation of this
material. Users are also wholly responsible for protecting themselves against all claims or liabilities for patent infringement.
Equipment referenced is for the convenience of the user and does not imply endorsement by IPC.
Page1of4
ASSOCIATION CONNECTING
ELECTRONICS INDUSTRIES
®

During the remainder of the preparation, handle boards by the
edges only and use noncontaminating gloves.
3.1.3 Dry the cleaned boards for two hours at 50 °C.
3.1.4 If boards are to be stored before treatment, place the
boards in Kapak™ bags or other contamination-free contain-
ers (do not heat seal) in a desiccator. (Kapak™ bags are avail-
able from Fischer, VWR and other distributors.)
3.1.5 When measured as described in Sections 4 and 5, if
the control board readings are less than 1000 MΩ at any point
after the initial 24 hours of SIR exposure, a new set of test
coupons shall be obtained and the entire test repeated.
3.2 Blank Process Controls If performing process valida-
tion testing, two samples from an unprocessed blank should
be run with the samples taken from the processed boards.
Values obtained from unprocessed board samples are useful
when failure is observed within the processed board sample.
Failure of the unprocessed samples may indicate a problem
with the incoming bare board rather than an assembly pro-
cess.
4 Equipment/Apparatus It is the responsibility of the user
of this method to verify equipment suitability. This method
intends for all tolerances to be interpreted as uncertainties
with a confidence interval of 95% as referenced in ANSI/NCSL
Z540-1 and ANSI/NCSL Z540-2. Quantitative, qualitative and
default information follow in the paragraphs below.
4.1 Electrometer Electrometer, High Resistance Meter,
Picoammeter or equivalent as described by ASTM D 257.
a) System must be capable of taking measurements and
controlling the switching automatically (unattended).
b) Minimum resistance measurement accuracy (not only
meter, but as implemented)
5% of full scale up to 10
10
Ω @5V
10% of full scale up to 10
11
Ω @5V
20% of full scale above 10
11
Ω @5V
c) Accuracy with respect to the ‘‘true’’ value requires assess-
ment of stability of the measurement system (after switch-
ing from bias voltage to the measurement voltage). There-
fore, if the system does not automatically assess stability
before logging, use an arbitrary time of one minute.
d) The system described in this section must be able to make
all measurements required within a 20 minute period and
meet the requirements of 5.3.
It is preferred that the resistance reading be stable before
acquiring the readings or data. If after one minute the signal
remains unstable, a measurement should still be recorded.
4.2 Switching System
a) Must have a channel-to-channel isolation resistance ten
times greater than the resistance of typical SIR require-
ments, or a default channel-to-channel isolation resistance
of 10
12
Ω.
b) <20-minute cycle while obtaining measurements as
described above.
c) Unique 10
6
Ω current limiting capability per channel.
4.3 Wire Attachments
a) Single solid copper wire with PTFE insulation.
b) Preferred solid wire solders (no flux), or nominally 1% by
weight rosin nonactivated. See wire attach section of this
document for more information.
c) Electrical (EMI) shielding to guard cabling from stray cur-
rents.
4.3.2 Alternative Wire attachments such as stranded wire,
non-PTFE insulation, edge connectors rather than hard wiring,
and guarding techniques may be used provided the system
accuracy is not compromised.
4.4 Controlled Temperature and Humidity Chamber
a) Produce 40±1°Cat90±3%R.H.
b) Continuous or semicontinuous recording of this environ-
ment.±2°Cand±3%R.H.
c) Samples should not significantly impede airflow.
d) Adequate mixing of water vapor and air is imperative to
ensure condensation does not occur anywhere in the
chamber except on/around cooling or dehumidification
coils. If any part of interior of the chamber is below the dew
point (possibly due to insulation or control issues), conden-
sation will occur. This is not necessarily a problem as long
as the samples are kept above the dew point and are
shielded from dripping or flying condensate.
4.5 Camera Camera capable of recording color image.
5 Test Procedure
5.1 Interconnect Samples
IPC-TM-650
Number
2.6.3.7
Subject
Surface Insulation Resistance
Date
03/07
Revision
Page2of4