IPC-TM-650 EN 2022 试验方法.pdf - 第45页
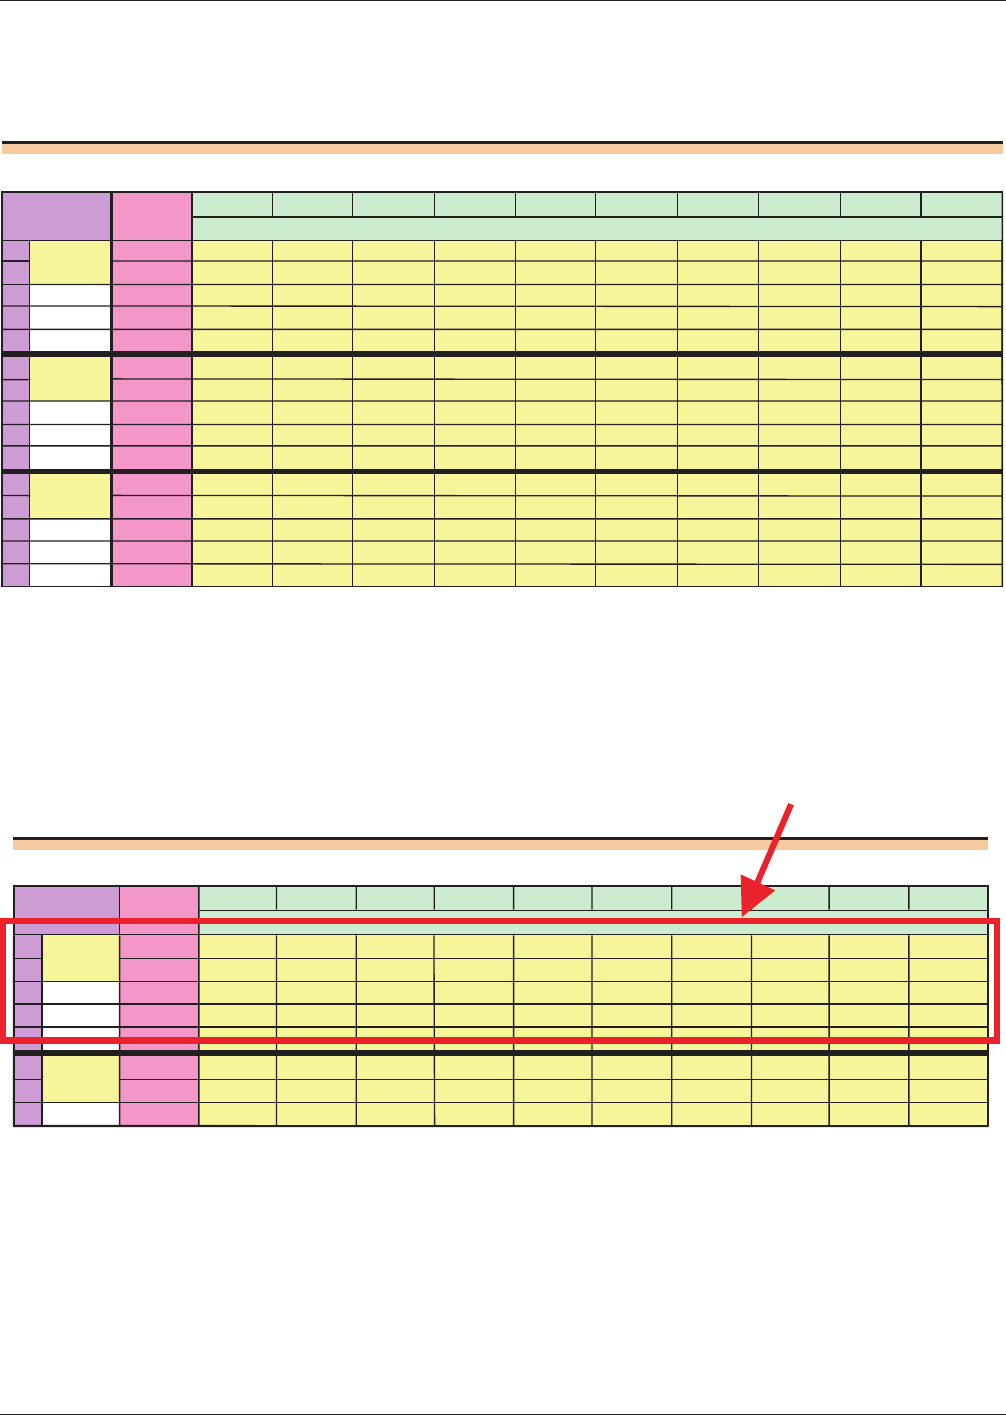
W ithin the section for a given test condition, the repeated readings for each part are entered in columns, as shown below . Therefore each row within the test condition area represents one complete set of readings for o…
Data
Entry Section
Below
is a view of the data entry panel from the spreadsheet. In this case there are three testers, making two readings on
each of the different parts.
This panel can be somewhat confusing at first, so a review of how the sections are organized will be helpful.
The data for each tester is entered in horizontal sections.
Measurement Precision Study: Data Entry Sheet
Sample
Sample Sample
Sample Sample Sample Sample Sample Sample Sample
1
2
3
45678910
1 1 0.62 0.99 0.82 0.85 0.59 1.02 0.97 0.85 1 0.61
2 0.66 1 0.81 0.89 0.48 1.03 0.97 0.82 1 0.7
3
4
5
2 1 0.53 1.05 0.8 0.83 0.39 1.04 0.97 0.73 0.98 0.54
2 0.53 0.93 0.77 0.76 0.4 1.08 0.91 0.7 0.95 0.6
3
4
5
3
1 0.51 1.05 0.8
0.79 0.45 1.01 0.96 0.8 1.04 0.84
2 0.55 1.02 0.77 0.81 0.49 1.05 0.96 0.81 1.05 0.81
3
4
5
Reading
Condition
Station 3
Station 1
Station 2
Measurement Precision Study: Data Entry Sheet
Sample
Sample Sample Sample Sample Sample Sample Sample Sample Sample
12345678910
1 1 0.62 0.99 0.82 0.85 0.59 1.02 0.97 0.85 1 0.61
2 0.66 1 0.81 0.89 0.48 1.03 0.97 0.82 1 0.7
3
4
5
2
1 0.53 1.05 0.8 0.83 0.39 1.04 0.97 0.73 0.98 0.54
2 0.53 0.93 0.77 0.76 0.4 1.08 0.91 0.7 0.95 0.6
3
Condition
Station 1
Station 2
Reading
Data for one
test condition
Users
Guide January 2003
4
电子技术应用 www.ChinaAET.com
W
ithin the section for a given test condition, the repeated readings for each part are entered in columns, as shown below.
Therefore each row within the test condition area represents one complete set of readings for one test round for that tester.
Measurement Precision Study: Data Entry Sheet
Sample
Sample
Sample
Sample
Sample
Sample
Sample
Sample
Sample
Sample
12
3
4
5
6
78
9
10
1 1 0.62 0.99 0.82 0.85
0.59 1.02 0.97 0.85 1
0.61
2 0.66 1 0.81 0.89
0.48 1.03 0.97 0.82
1 0.7
3
4
5
2
1 0.53 1.05 0.8 0.83 0.39 1.04 0.97 0.73
0.98 0.54
2 0.53 0.93 0.77 0.76 0.4 1.08 0.91 0.7
0.95
0.6
3
Condition
Station 1
Station 2
Reading
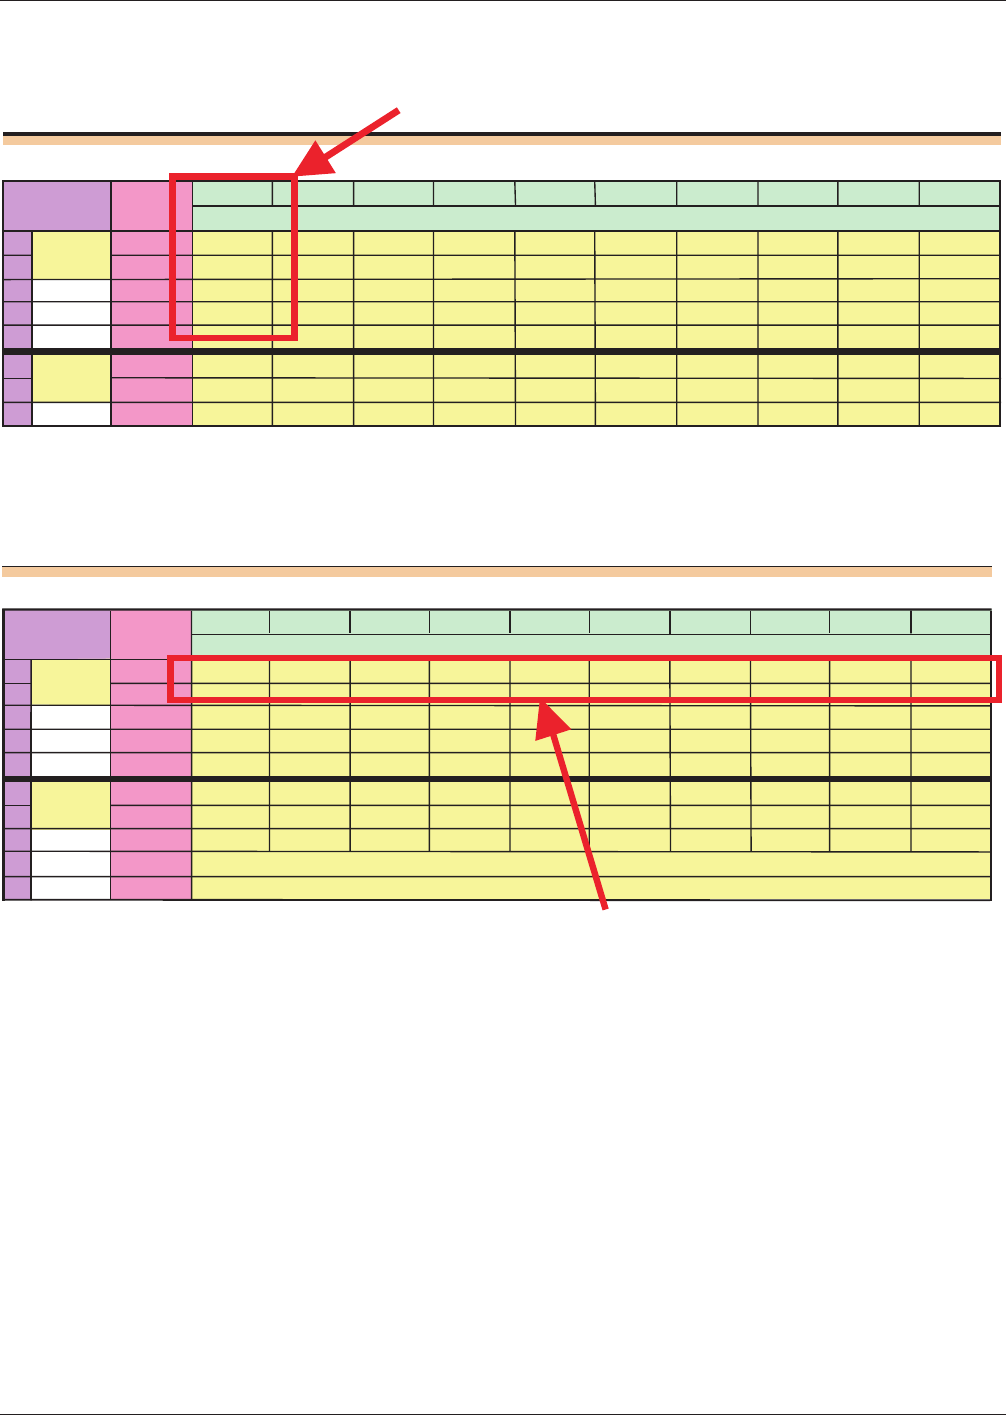
Data for on
test sample
Measurement Precision Study: Data Entry Sheet
Sample
Sample
Sample
Sample
Sample
Sample
Sample
Sample Sample Sample
1234
5
6
78
9
10
1 1 0.62 0.99 0.82 0.85 0.59 1.02 0.97 0.85 1 0.61
2 0.66 1 0.81
0.89
0.48
1.03
0.97 0.82 1
0.7
3
4
5
2 1 0.53 1.05 0.8 0.83
0.39
1.04 0.97 0.73 0.98 0.54
2
0.53 0.93 0.77 0.76 0.4
1.08
0.91 0.7 0.95 0.6
3
4
5
Condition
Station 1
Station 2
Reading
First round of measurements on
all samples for one test condition
January
2003 Users Guide
5
电子技术应用 www.ChinaAET.com
Intermediate
Calculations
Because
macros were avoided, the messy details of the calculations appear in the next section. If they make one nervous,
just hide them, and go directly to the Scorecard. One may, however, find these calculations helpful. Here is how this sec-
tion is organized:
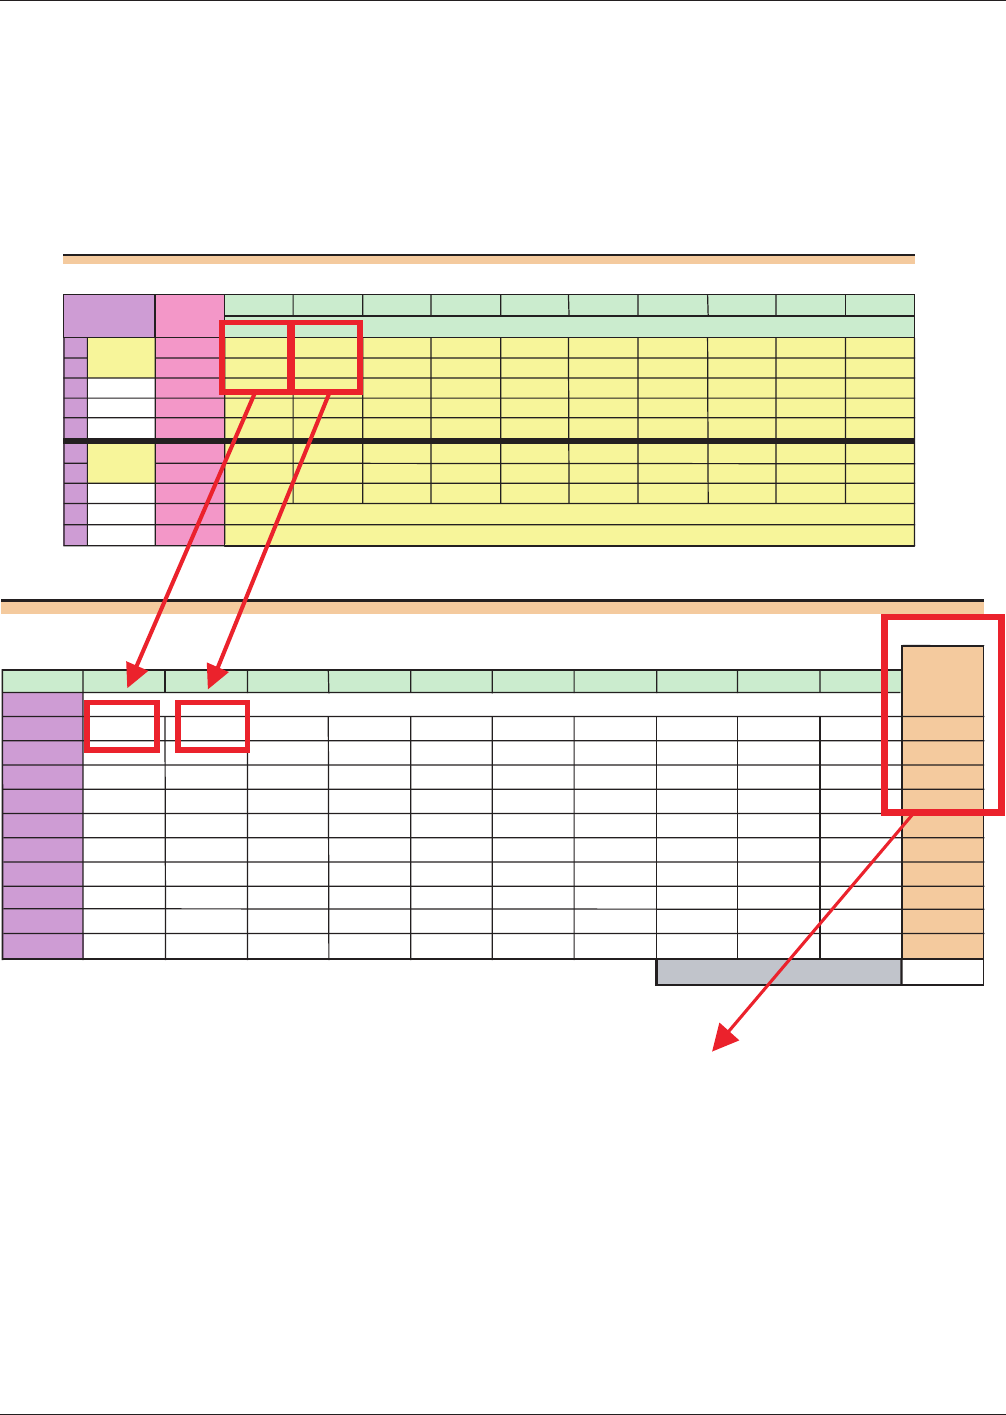
The first table in the calculations section shows the average reading for each part for each tester. Be sure and note the color-
coding scheme to keep track of the headings in the table. Headings pertaining to test conditions appear in purple. Headings
for samples appear in yellow.
Measurement Precision Study: Calculation Sheet
Ranges:
Average
Condition
Ranges
Sample
1 2 3 4 5 6 7 8 9 10
Condition
1 0.04 0.01 0.01 0.04 0.11 0.01 0 0.03 0
0.09 0.034
2 0 0.12 0.03 0.07 0.01 0.04 0.06
0.03 0.03 0.06 0.045
3 0.04 0.03 0.03 0.02 0.04 0.04 0
0.01 0.01 0.03 0.025
4 0
5 0
6 0
7 0
8 0
9 0
10 0
Average of the range averages
0.03467
Measurement Precision Study: Data Entry Sheet
Sample
Sample Sample Sample Sample Sample Sample Sample Sample Sample
12345678910
1 1 0.62 0.99 0.82 0.85 0.59 1.02 0.97 0.85 1 0.61
2 0.66 1 0.81 0.89 0.48 1.03 0.97 0.82 1 0.7
3
4
5
2 1 0.53 1.05 0.8 0.83 0.39 1.04 0.97 0.73 0.98 0.54
2 0.53 0.93 0.77 0.76 0.4 1.08 0.7 0.95 0.6
3
4
5
Condition
Station 1
Station 2
Reading
The right column in the table above shows the range for that test condition. The range is
the difference between the maximum and minimum measurement average.
Users
Guide January 2003
6
电子技术应用 www.ChinaAET.com