IPC-TM-650 EN 2022 试验方法.pdf - 第541页
The same technique can be used for extracting the resistive and dielectric losses in the presence of metal roughness and dielectric inhomogeneities and for differential wiring. 5.4 SET2DIL Procedure This specification ou…
The calculation is iterated until good agreement is obtained.
Agreement is assessed visually. Each time, the high-frequency
values of ε
r
and tanδ are modified. It is recommended to use
a 2D field solver that has a Debye model for the relation
between C and G as described in Equation 5-13 with a large
number of poles to cover a broad frequency range. 30 poles
are considered a good practice.
ε(ω) = ε
∞
+
Σ
i
ε
i
1 + jωτ
i
[5-13]
The solver should be able to smoothly interpolate between the
low frequency values and the high-frequency ones.
The broadband Z
0
(f) is also obtained based on R(f), L(f), C(f),
G(f) as shown in Equation 5-14.
Z
0
=
Γ(ω)
G(ω) + jωC(ω)
[5-14]
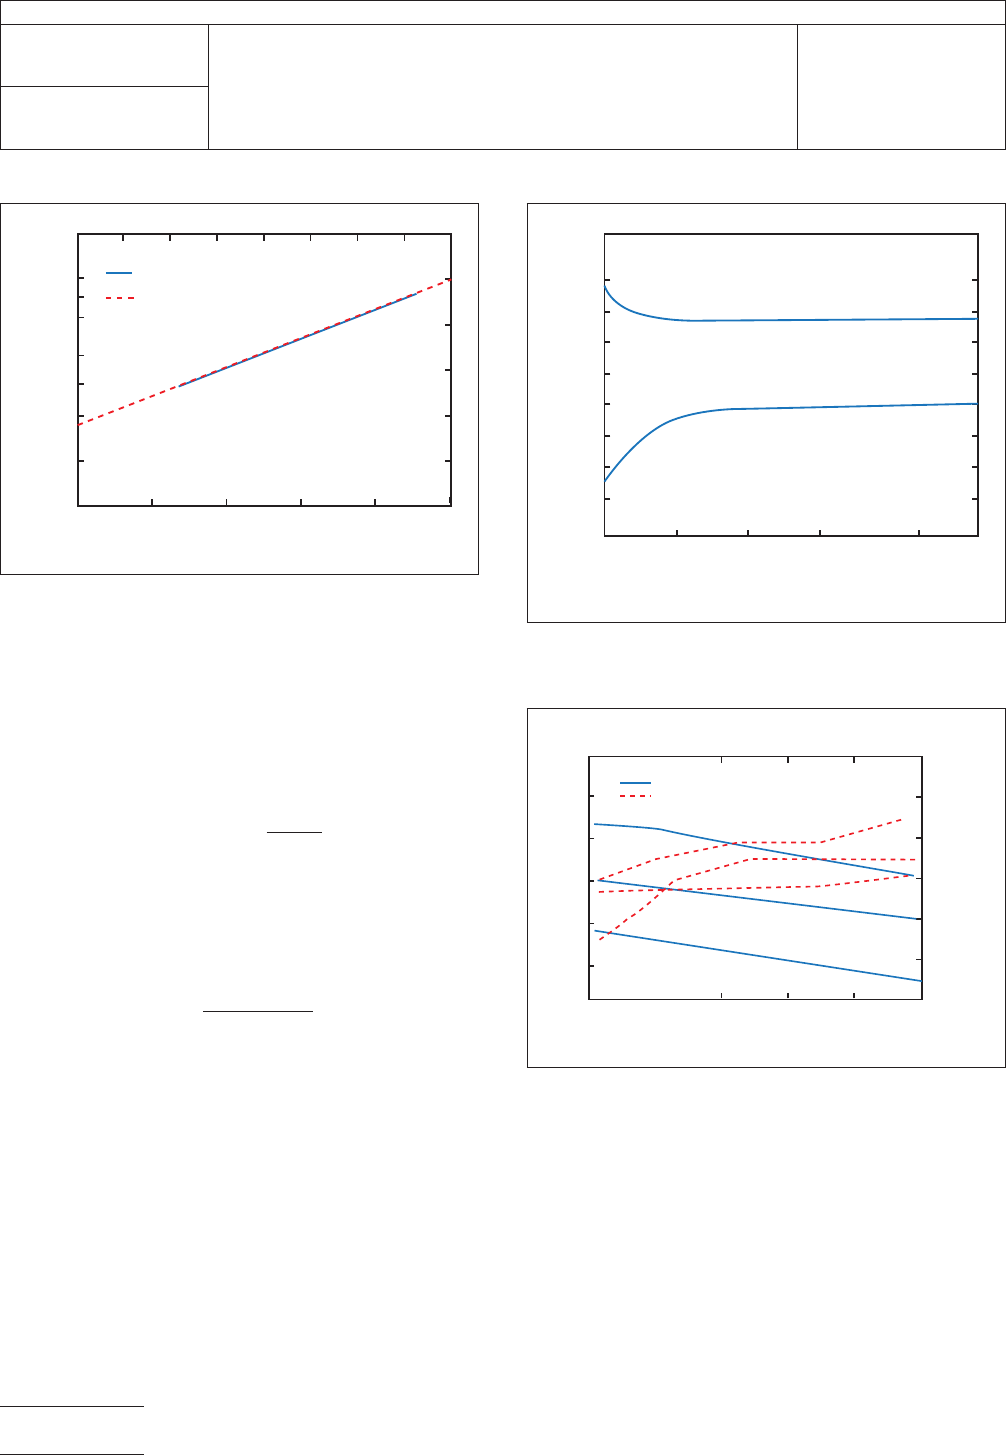
An example of such broadband impedance is shown in Figure
5-13.
5.3.6.3.2 Frequency Dependent Complex Permittivity
Extraction
The final R(f), L(f), C(f), and G(f) are used to
extract the complex permittivity using Equation 1-2 and 1-3.
Some examples of extracted permittivities are shown in Figure
5-14.
IPC-25512-5-12
Figure 5-12 Measured and Calculated Phase Constant
Phase Constant (1/cm)
0.05
0.5
1
2
20
10
5
50
125102050
Frequency (GHz)
Measured
Calculated
IPC-25512-5-13
Figure 5-13 Extracted Broadband Characteristic
Impedance
Impedance (Ω)
-80
-60
-40
-20
0
20
40
60
80
100
0.001 0.01 0.1 1 10 50
Frequency (GHz)
Real Zo
Imag Zo
IPC-25512-5-14
Figure 5-14 Extracted broadband Complex Permittivities
Dielectric Constant ε
Dielectic Loss tanδ
3.2
3.4
0.005
0
0.010
0.015
0.020
0.025
0.030
3.6
3.8
25
BT
BT
Nelco
Nelco
Nelco
NelcoSI
BT, Nelco 4000–13SI, 6 Layers, 3.75/3.55/3.7
10 20 50
Frequency (GHz)
tanδ
IPC-TM-650
Number
2.5.5.12
Subject
Test Methods to Determine the Amount of Signal Loss on
Printed Boards
Date
07/12
Revision
A
Page 20 of 24
The same technique can be used for extracting the resistive
and dielectric losses in the presence of metal roughness and
dielectric inhomogeneities and for differential wiring.
5.4 SET2DIL Procedure This specification outlines the
fundamental principles behind SET2DIL; the exact method will
be instrument-dependent. Vendors providing SET2DIL capa-
bility are responsible for ensuring correlation between stan-
dard SDD21 measurements (VNA) and their implementation of
SET2DIL.
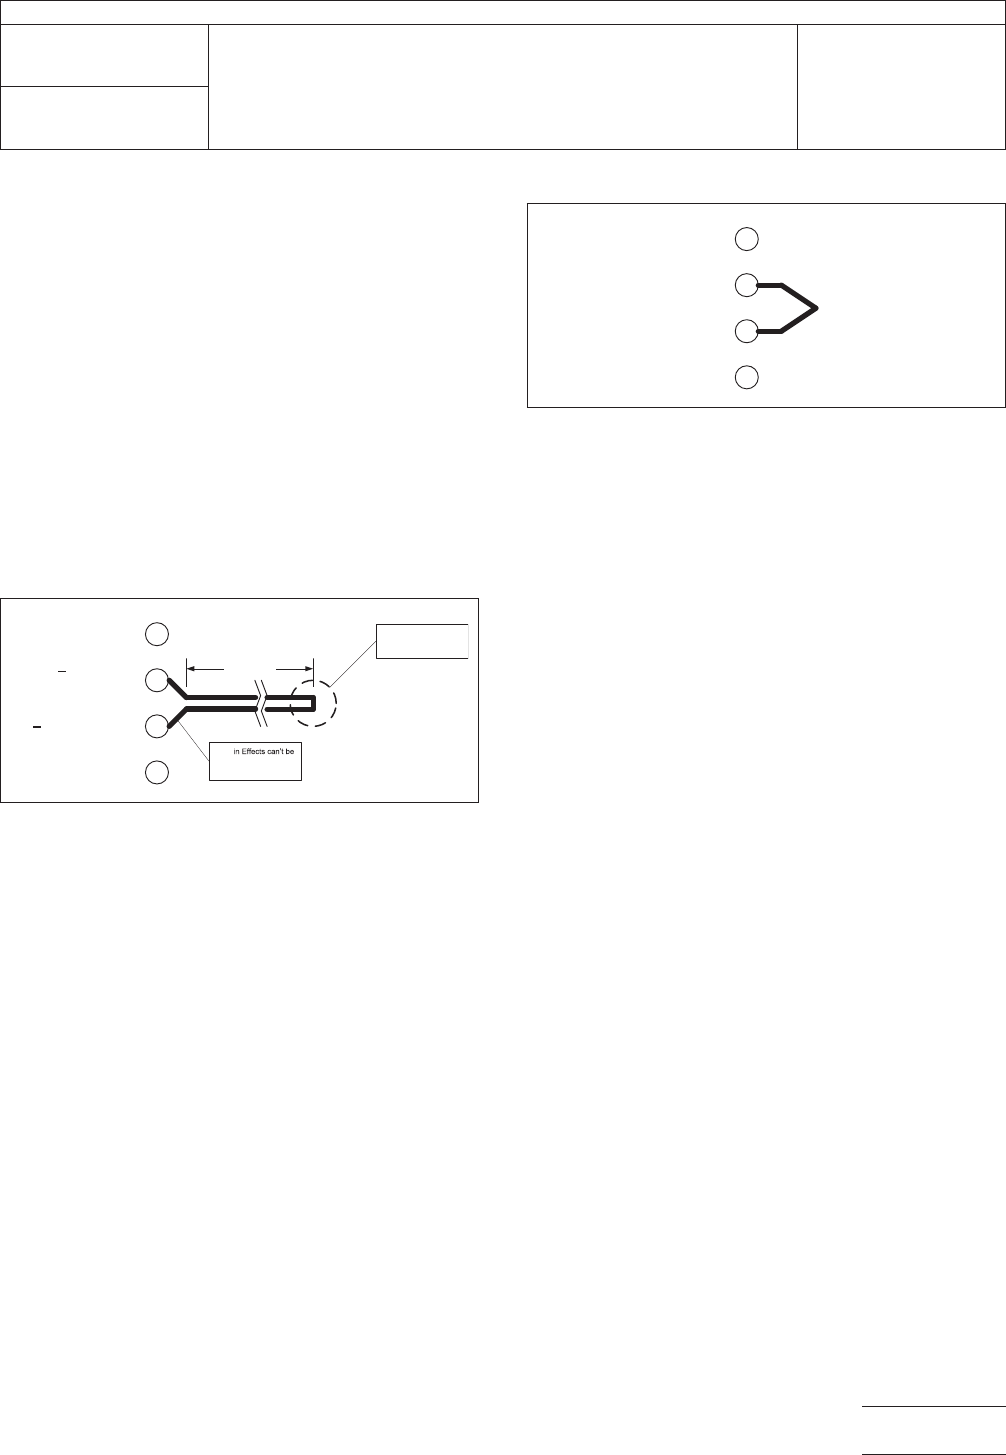
5.4.1 SET2DIL Structure The SET2DIL structure is a
101.6 mm [4.0 in] representative piece of the differential pair
(or single-ended signal) being characterized (see Figure 5-15).
It has an effective length of 203.2 mm [8.0 in]. A ‘‘thru’’ struc-
ture is used as a reference (see Figure 5-16).
5.4.2 SET2DIL Measurement A TDR pulse is injected into
‘‘q1’’ while the waveforms at q1 and q2 are monitored. The
q1 waveform will represent single-ended impedance with the
far end cross talk (FEXT) pulse superimposed on that. Like-
wise, the q2 waveform will represent the near end cross talk
(NEXT) pulse with the TDT pulse superimposed on that (see
Figure 5-17).
5.4.3 SET2DIL TDD21 Extraction The TDT pulse is
extracted from the q2 waveform, and the FEXT pulse is
extracted from the q1 waveform. FEXT is subtracted from TDT
to form TDD21. A detailed description of the waveform
manipulation is available as the 2010 DesignCon paper
‘‘SET2DIL: Method to Derive Differential Insertion Loss from
Single-Ended TDR/TDT Measurements.’’ Figure 5-18 shows
the extracted waveforms and the resultant TDD21.
5.4.4 SET2DIL SDD21 Calculation The FFT of the deriva-
tive of TDD21 is divided by the FFT of the derivative of the
‘‘thru’’ waveforms to calculate SDD21 of the SET2DIL struc-
ture. Figure 5-19 shows the time and frequency domain wave-
forms (SET2DIL frequency domain results compared to VNA
measurements on the right). SDD21 as a function of fre-
quency can then be compared to expected values to deter-
mine if the printed board construction is adequate to meet the
insertion loss requirements of the design.
IPC-25512-5-15
Figure 5-15 SET2DIL Test Structure
G
+
G
q1 excitation/
measurement
DUT/2 (4")
q2 measurement
DUT looped back
at end
Lead-
de-embedded;
must be minimized
IPC-25512-5-16
Figure 5-16 SET2DIL ‘‘thru’’ Structure
Ref Structure
(thru)
G
-
+
G
q1: excitation
q2: measurement
IPC-TM-650
Number
2.5.5.12
Subject
Test Methods to Determine the Amount of Signal Loss on
Printed Boards
Date
07/12
Revision
A
Page 21 of 24
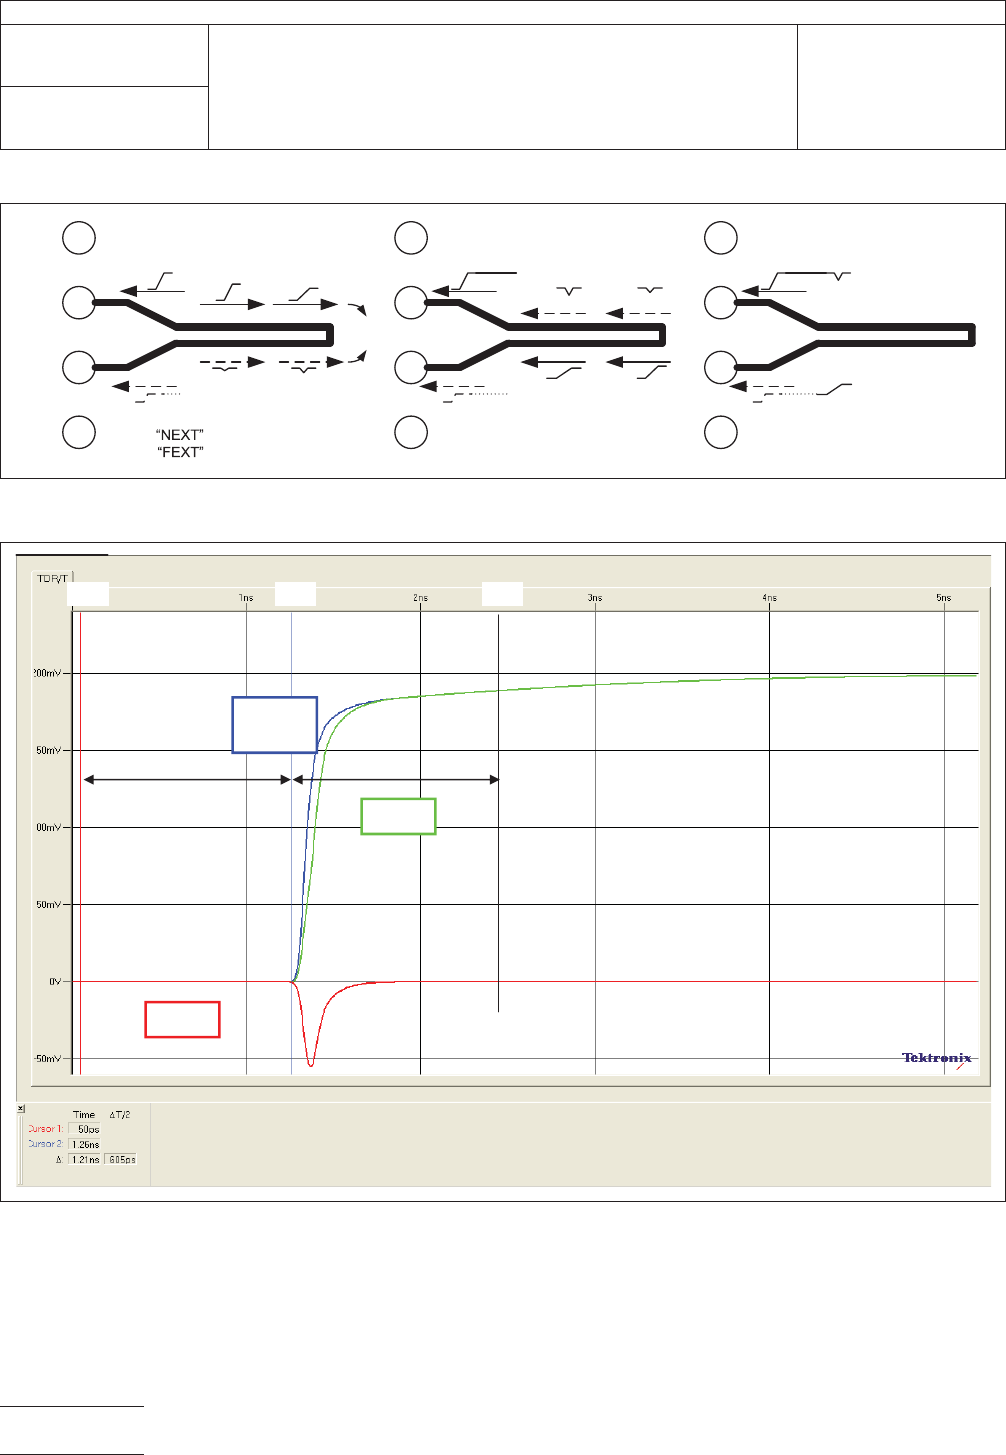
IPC-25512-5-17
Figure 5-17 SET2DIL Waveforms
G
+
G
q1
q2
G
+
G
G
+
G
TDR
TDT
NEXT
FEXT
TDT
FEXT
FEXT
FEXT
TDT
TDT
NEXT
TDR
NEXT + TDT
TDR + FEXT
Note:
= Near End Cross Talk
= Far End Cross Talk
Figure 5-18 SET2DIL TDT, FEXT, and TDD21 Waveforms
q1 final
q2 final
SET2DIL
TDD21
Td Td
t0 t1 t2
IPC-TM-650
Number
2.5.5.12
Subject
Test Methods to Determine the Amount of Signal Loss on
Printed Boards
Date
07/12
Revision
A
Page 22 of 24