IPC-TM-650 EN 2022 试验方法.pdf - 第372页
required. Decrease the temperature to –55 °C ± 2 °C [–67 °F ± 3 °F] or other temperature designated and allow to stabilize for 10 minutes or until no further changes are noted on the meter. Increase the temperatures to 2…
5.3.5
Place
the gage/terminal assemblies in their original
position over the reference lines, using only enough pressure
to allow the assemblies to be tacked down. Overlay the gage/
terminal area with thin pieces of PTFE tape, and anchor them
in position with pieces of Mylar tape across the ends.
5.3.6
Cut
the silicone gum pads to size slightly larger than
the gage/terminal areas, carefully centering them in position.
Larger pads may restrict proper spreading of the adhesive
and entrap residual solvents during the curing process.
5.3.7
Use
spring clamps or dead weights to apply pressure
(275 to 350 kN/m
2
[40
to 50 psi]) and place in the curing oven
which is to be at room temperature.
5.3.8
Raise
the temperature to 100 °C ± 3 °C [212 °F ±
6 °F] (use 79 °C [174 °F] if using M-Bond 600) at a rate of
3 °C to 11 °C/min [5 °F to 20 °F/min], and cure for 4 1/2 to 5
hours. Air bubble entrapped in the adhesive, uneven glue
lines, and high adhesive stresses often result from starting
with a hot oven.
5.3.9
Remove
the specimens after allowing the oven to cool
below 55 °C [131 °F], remove clamps and Mylar tape, and
clean the entire surface with isopropyl alcohol to remove
residual tape adhesive. Wipe dry with a gauze sponge.
5.3.10
Post
cure for 2 to 2 1/2 hours at 40 °C [104 °F]
(30 °C [86 °F] per M-Bond instructions) above the test upper
limit temperature. Care must be taken, if base materials hav-
ing low T
g
values
(FR-4) are to be tested.
5.3.11
Bond
the solder tabs 6.4 mm [0.25 in] from the strain
gages. The gage leads are to looped slightly prior to soldering
to prevent inducement of strain resistance changes. Solder
tabs may be attached in the same step as the strain gages.
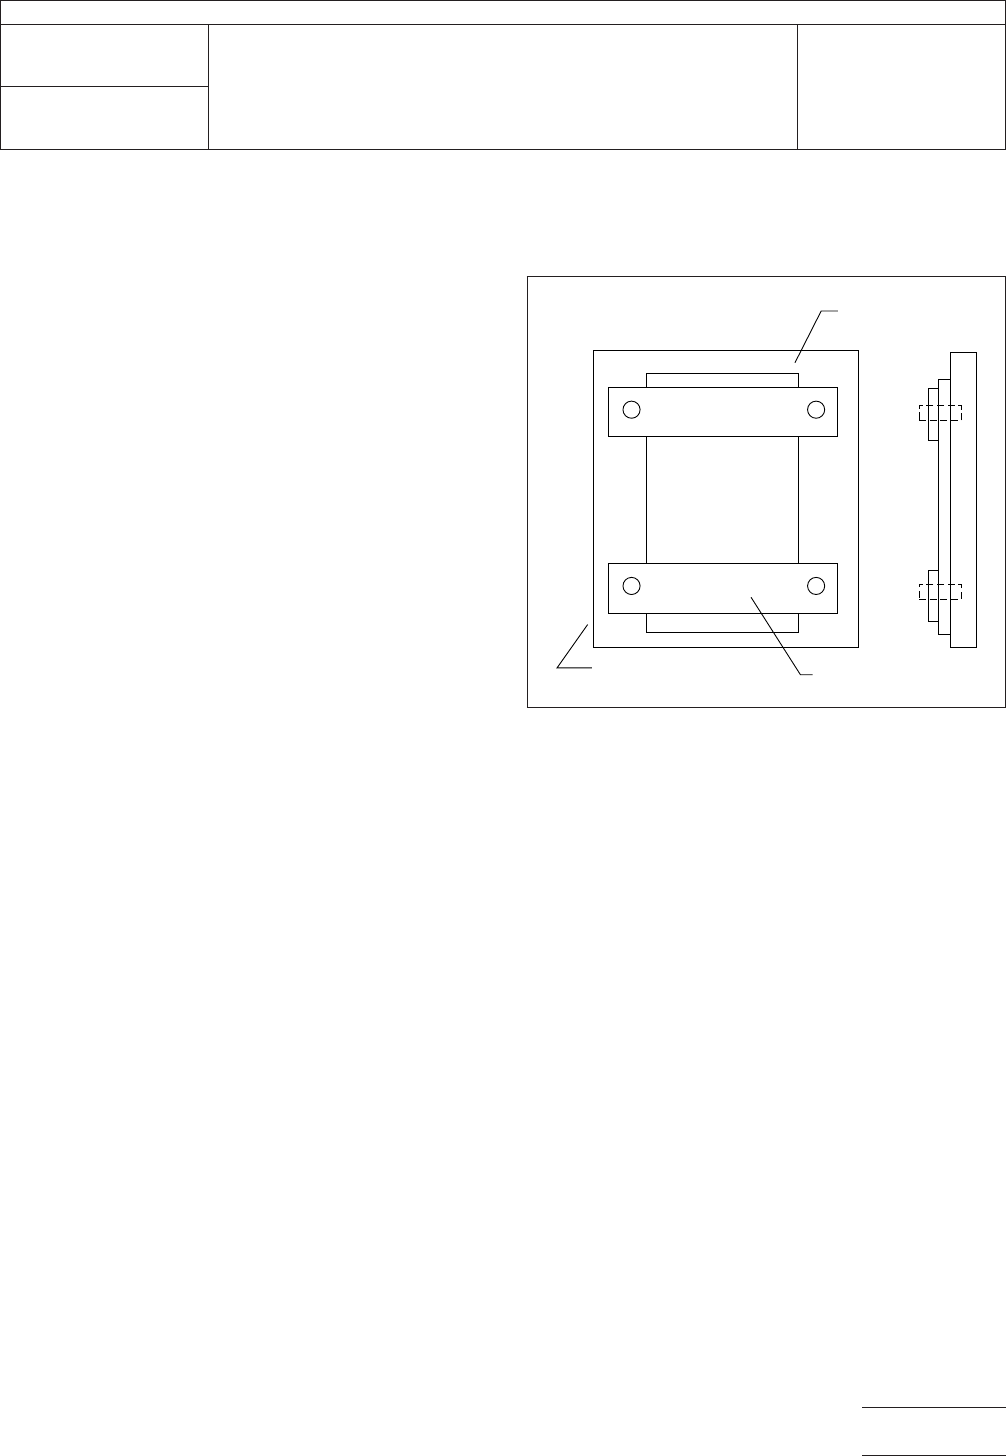
5.4
Specimen Fixture Preparation
(If
required, Figure 1)
5.4.1
The
PCB and titanium silicate standards, once
assembled with the strain gages, are fixtured to prevent bend-
ing or warping by the straps labeled PL in Figure 1 during the
temperature cycle test. The fixture used for the specimens will
not interfere with the thermal expansion of the specimens
being tested.
The fixture is constructed of 1.25 mm [0.050 in] thick Alloy 42
plated with 0.025 mm [0.001 in] of copper. This material was
chosen because of its thermal expansion properties that are
close to that of the test specimens. Plated Alloy 42 straps are
used to gently hold the specimen flat to the fixture. Other
materials that may closely match the CTE of the test speci-
men may be used.
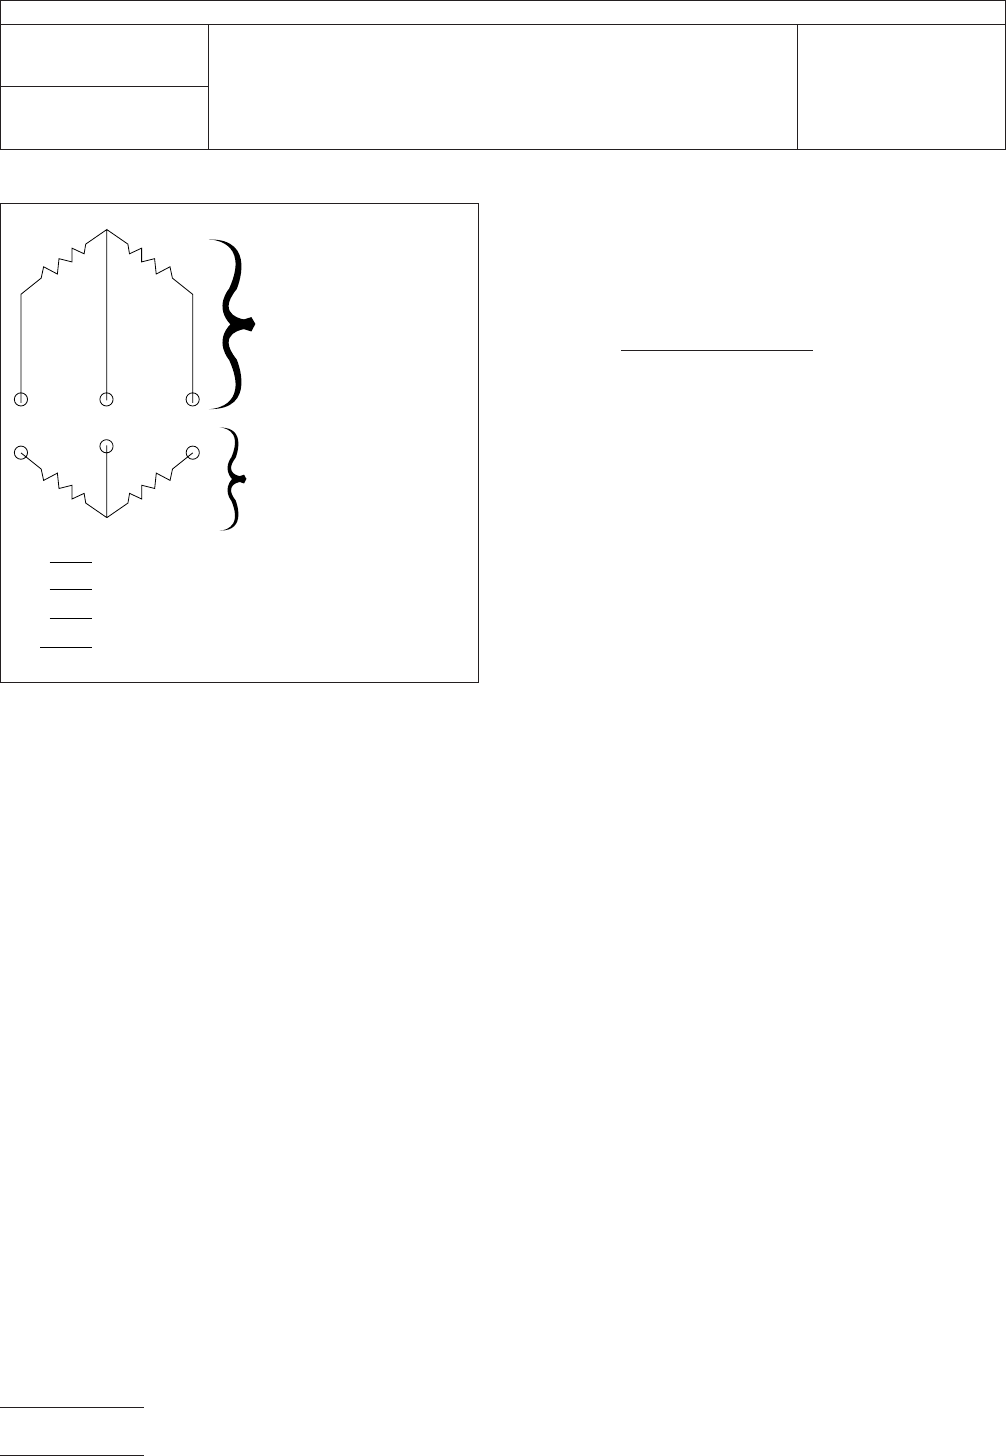
5.5
Test Configuration
Connect
two strain gages, one to
the test specimen and one to the to the titanium silicate stan-
dard, in adjacent arms forming a half bridge; the remaining
half of the Wheatstone bridge being completed with the
Wheatstone bridge instrument (see Figure 2). Repeat for the
remaining two strain gages, one on the test specimen and
one on the titanium silicate standard with a second Wheat-
stone bridge instrument in the circuit.
Attach (tape) thermocouple to the sample within a 6.0 mm
[0.25 in] of the measurement area.
5.6
Specimen Conditioning/Thermal Cycling
Clean
the
specimens by immersing in M-Line solvent with agitation for
15-20 seconds. Allow to dry for 1 to 1 1/2 hours at 40 °C ±
5 °C [105 °F ± 9 °F].
5.6.1
Place
the specimens and the reference standards in
the thermal cycling chamber (with programmable temperature
control) set at 20 °C [68 °F] and allow to stabilize for 30 to 40
minutes or as required to relieve strain gage attachment
stresses.
5.6.2 Increase
temperature at a rate of 2 °C/min [3 °F/min]
up to 130 °C [266 °F] or other test temperature designated,
allowing the specimens to stabilize for 10 minutes or longer, if
IPC-24412-1
Figure
1 Test Fixture Configuration
Sample
Strap 2PL
Base Plate
▼
▼
▼
IPC-TM-650
Number
2.4.41.2
Subject
Coefficient
of Thermal Expansion—Strain Gage Method
Date
05/04
Revision
A
P
age3of4
电子技术应用 www.ChinaAET.com
required.
Decrease the temperature to –55 °C ± 2 °C [–67 °F
± 3 °F] or other temperature designated and allow to stabilize
for 10 minutes or until no further changes are noted on the
meter. Increase the temperatures to 25 °C [77 °F] at the same
rate and allow the specimens to stabilize.
5.6.3
Throughout
the thermal cycle, the temperature and
change in resistance as noted on the meter(strain) should be
recorded at the desired time and temperature (two minute
intervals).
5.7
Calculation of CTE
Plot
the gage resistance versus
the temperature. Measure the slope of the line between the
temperatures of interest and record.
The equation for calculating the Coefficient of Thermal Expan-
sion, ∝, are:
∝ = ∆R/R(GF)∆T
Where ∝ = the coefficient of thermal expansion R = gage
resistance reading
∆R = the change in resistance reading
∆T = the change in temperature
GF = the Gage Factor of a particular gage and gage con-
figuration and is furnished by the strain gagemanufacturer.
The GF for the WK gage is near 2.1
Example:
Resistance reading at 20 °C [68 °F] = 352.39
Resistance reading at 170 °C [338 °F] = 353.40
GF as furnished by manufacturer = 2.11
∝ =
(353.40 – 352.39)
(353.40
X 2.11 X 150)
= 9.03 ppm/°C
Note:
The
graph plot of ∆R/∆T will allow selection of any tem-
perature point.
All strain and temperature data should be recorded on a disk.
Software packages are available that the raw data (resistance
changes and temperature) to strain and temperature. The
software compensates for gage factor with temperature,
apparent strain of the gage, and the bridge configuration in
reducing the data. The software also uses the data from the
titanium silicate standard to adjust the reduced data of the
test specimen.
6 Notes
6.1
Suggested Sources of Materials
6.1.1
Source
of Adhesive System
Micro-Measurements Division
Measurements Group Inc.
P. O. Box 27777
Raleigh, NC 27611
Phone: (919) 365-3800
6.1.2 Information Bulletin
Micro-Measurements Division
Measurement Group Inc.
P.O. Box 27777
Raleigh, NC 27611
Phone (919) 365-3800
Bulletin # B130-10
6.1.3
Titanium
Silicate Standard
Corning Glass works
Corning, NY 14831
Micro-Measurements Division
Measurement Group Inc.
P.O. Box 27777
Raleigh, NC 27611
Phone (919) 365-3800
IPC-24412-2
Figure
2 Wheatstone Bridge Instrumentation Hookup
R Gage on Unknown
R Gage on Standard
R Standard Resistors on Instrument
M Direct Reading Strain Meter
External or Measurement
Half Bridge
Internal or Instrument
Half Bridge
U
S
K
R
U
R
S
R
K
R
K
M
IPC-TM-650
Number
2.4.41.2
Subject
Coefficient
of Thermal Expansion—Strain Gage Method
Date
05/04
Revision
A
P
age4of4
电子技术应用 www.ChinaAET.com
1.0
Scope
This test method establishes a procedure for
determining the in-plane coefficient of linear thermal expan-
sion of organic films from 0-200°C using thermal mechanical
analysis (TMA).
2.0
Applicable Documents
ASTM D 618
Standard
Practice for Conditioning Plastics
and Electrical Insulating Materials for Testing
ASTM
D 3386
Standard
Test Method for Coefficient of Lin-
ear Thermal Expansion of Electrical Insulating Materials
3.0
Test Specimen
The
test specimen shall consist of a
strip 15-20 mm long and 2 mm wide with a minimum thick-
ness of 10 µm and maximum thickness of 200 µm.
4.0
Apparatus or Material
Perkin-Elmer
TMA-7 with a film
fixture in extension mode or equivalent equipment capable of
handling films less than 25 µm thick.
5.0
Procedure
5.1
The
test specimens should be conditioned at 23 ± 2°C
and 50 ± 5% relative humidity for not less than 24 hours prior
to testing. Refer to ASTM D 618.
5.2
Follow
the manufacturer’s recommendations for equip-
ment startup and calibration.
5.2
Mount
the test specimen in the film holder. The sample
length (between the grips) should be between 11-13 mm.
Refer to ASTM D 3386.
5.3
Set
the force at 30 mN.
5.4
Perform
a prescan by heating a rate of 20°C/min. Under
inert atmosphere from −10°C to either 10°C above the mate-
rial glass transition temperature, T
g
,
or 10°C below the mate-
rial decomposition limit, T
max
,
determined using nitrogen. T
g
may
be determined using IPC Test Methods 2.4.24.2,
2.4.24.3, or 2.4.25.
5.5
Hold
the temperature for 60 min.
5.6 Cool
at a rate of 5°C/min to −10°C.
5.7
Hold
the temperature for 10 min.
5.8
Reheat
the specimen at a rate of 5°C/min to a maximum
temperature of 25°C below the glass transition temperature of
the polymer or 10°C below the material decomposition limit,
T
max
,
determined under nitrogen. Ar least two temperature
scans of the test specimen should be conducted without dis-
turbing the specimen in the TMA to confirm repeatability of
observed test results.
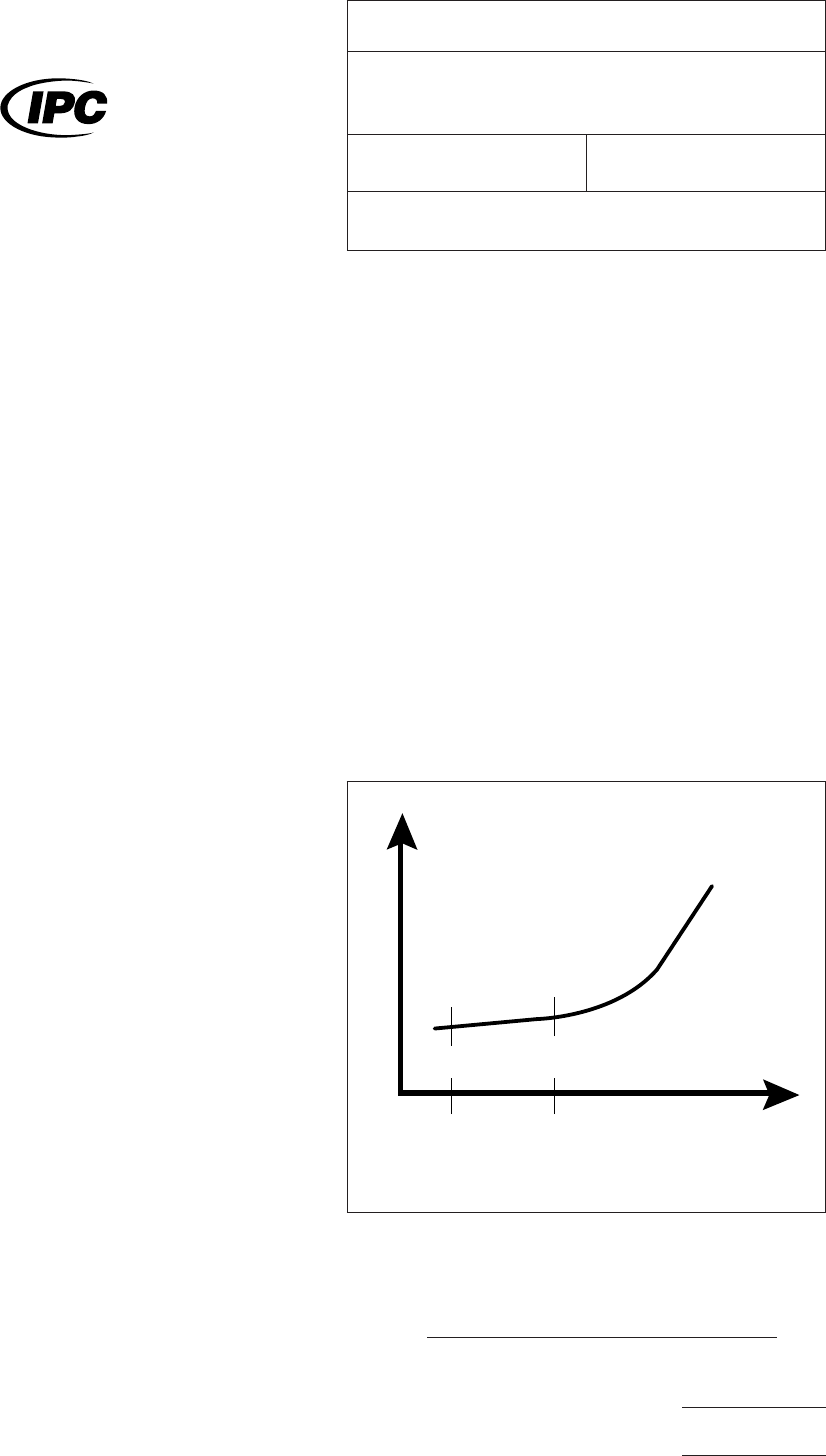
5.9
Calculate
the average coefficient of thermal expansion,
over the temperature intervals of interest as follows:
α =(∆L/∆T)/L
where L is the length of the test specimen between the grips,
∆L is the change in the length of the specimen (in the same
units) over the temperature interval ∆T, and ∆T is the tempera-
ture interval (normally 200°C) as illustrated in Figure 1. The
units are°C
-1
.
5.10 The
coefficient of linear thermal expansion from 0
200°C (below the glass transition) is
α=
(Length B − Length A)
(Length
A)(Temperature B − Temperature A)
2.4.41.2-01
Figure
1
T
emperature (°C)
A
0
B
200
Extension
The
Institute for Interconnecting and Packaging Electronic Circuits
2215 Sanders Road • Northbrook, IL 60062-6135
IPC-TM-650
TEST
METHODS MANUAL
Number
2.4.41.3
Subject
In-Plane
Coefficient of Thermal Expansion, Organic
Films
Date
7/95
Revision
Originating Task Group
Deposited Dielectric Task Group (C-13a)
Material
in this Test Methods Manual was voluntarily established by Technical Committees of the IPC. This material is advisory only
and its use or adaptation is entirely voluntary. IPC disclaims all liability of any kind as to the use, application, or adaptation of this
material. Users are also wholly responsible for protecting themselves against all claims or liabilities for patent infringement.
Equipment referenced is for the convenience of the user and does not imply endorsement by the IPC.
P
age1of2
电子技术应用 www.ChinaAET.com