IPC-TM-650 EN 2022 试验方法.pdf - 第396页
6.3.3 The load corresponding to a 2.5 % apparent incre- ment of crack extension is established by a specified deviation from the linear portion of the record. The K 1c value is calcu- lated from this load by equations th…

4.2 Sample Preparation The required square notch is cut
in the center of the sample width, within ± 0.25 mm, using a
diamond saw or similar stress-free method to form a smooth
bottom of the notch. The slot width should be 0.25 mm
[0.00984 in.].
The crack itself is initiated on each sample with a new 0.23
mm [0.009 in] thick ultra-sharp carbon steel razor blade
(example: http://www.mcmaster.com/#3962a4/=3qpeql). It
is recommended that the blade be refrigerated or cooled in
liquid nitrogen or in dry ice shortly before use. The razor blade
is then carefully tapped using a small weighted hammer with
sufficient force and control for the crack to initiate on the first
or second try. A new, cool or cold razor blade is recom-
mended for reducing the force needed for crack initiation. A
few specimens in every test lot should first be sacrificed for
operator practice at crack initiation, precisely determining the
hammer force needed for that sample lot to avoid only mak-
ing indentations. The depth of the natural crack generated by
tapping shall be a least twice the width of the machined
notch (3X the width of the notch is ideal).
The total depth of the notch plus the depth of the crack shall
be half the thickness of the sample, within ± 5 percent. There-
fore the depth of the square notch should be 45 percent of
the sample width minus 0.75 mm, ± 0.13 mm. The crack
shall be sufficiently sharp to ensure that a minimum value
of toughness is obtained during the subsequent 3-point
bending. The actual depths are measured after fracture within
0.5 % accuracy at three locations; at the center of the crack
front, and at the end of the crack front on each surface of the
specimen. The average of these three measurements, which
should be fairly uniform, shall be used in the calculations.
Cracks or breaks should be resin-resin, not between resin and
filler.
5 Equipment/Apparatus or Material
5.1 Test Machine
5.1.1
The testing machine used shall be a constant dis-
placement rate device; an electromechanical screw-driven
machine, or a closed loop feedback-controlled servo-
hydraulic load frame. The stationary and moving rollers used
for the 3-point loading (typically two under each end, and one
on top in the middle of the specimen block opposite the
crack) shall each be large enough to avoid excessive inden-
tation of the plastic, however the roller diameter should not
exceed the overall thickness of the specimen.
5.2 Displacement Measurement
5.2.1
The displacement measurement using an internal
displacement transducer having sufficient precision shall be
performed using the machines stroke or position transducer.
The fracture test displacement data shall be corrected for
system compliance, loading pin penetration and specimen
compression by performing a calibration of the testing sys-
tems as described in ASTM D-5045.
5.2.2 The displacement measurement using an external dis-
placement transducer having sufficient precision shall be
performed with the transducer located between the top and
bottom plates, and as close as possible to the load point on
the specimen to ensure displacement accuracy.
5.3 Yield Stress
5.3.1
The yield stress, σ
y
, is determined by the material’s
maximum load in an uniaxial tensile test. Using a constant
stroke rate uniaxial tensile test, the loading time to yield shall
be within ± 20 percent of the actual loading time observed in
the fracture test. A zero slope to the stress-strain curve is not
required. If a tensile test cannot be performed, then use 0.7
times the compressive yield stress as an approximation.
6 Procedure
6.1 Test Preparation
The specimens and all testing shall
be performed at 23 °C ± 3 °C. The actual temperature of the
specimen shall be recorded. The relative humidity should be
between 30 % and 60 % RH, and shall be recorded.
6.2 Displacement Correction Specimen shall be identi-
cal to the specimen prepared for fracture testing, except with-
out the notch or crack in the middle. This specimen shall be
used for single notch bend testing (reference ASTM D5045).
6.3 Testing
6.3.1
The notched specimen that has been pre-cracked is
subjected to loading at a loading rate of 5.0 mm per minute.
6.3.2 The test is performed and the load versus loading
point displacement curve is obtained. In the ideal case, there
is an abrupt drop of load to zero at the instant of crack growth
initiation. If this occurs, then determine the trial K
1c
or K
Q
from
the maximum load. Typically there will be a noticeable devia-
tion from linearity prior to fracture.
IPC-TM-650
Number
2.4.52
Subject
Fracture Toughness of Resin Systems for Base Materials
Date
07/13
Revision
Page2of8
6.3.3 The load corresponding to a 2.5 % apparent incre-
ment of crack extension is established by a specified deviation
from the linear portion of the record. The K
1c
value is calcu-
lated from this load by equations that have been established
on the basis of elastic stress analysis on other specimens suf-
ficiently large to show linear elastic behavior.
6.3.4 After breaking, the interface should appear smooth
and glossy. A layered or hazy surface indicates deformation
as a failure mechanism rather than cracking, and invalidates
the test results. After testing, measure the depth of the crack
from the notch depth at three locations along the width of the
sample. Also measure the depth of the crack from the top of
the sample (at the same three locations).
6.3.5 Determining the load displacement area or G
1c
requires an accurate integration of the load versus loading
point displacement curve, including an accurate displacement
determination using the displacement transducer.
7 Analysis Fracture toughness testing is recommended to
be performed at least twice per year.
7.1 Calculation and Interpretation of Results (reference
ASTM D5045, Section 9).
7.1.1
In order to establish that a valid K
1C
has been deter-
mined, it is first necessary to calculate a conditional result, K
Q
,
which involves a construction on the test record, and to then
determine whether this result is consistent with the size of the
specimen in accordance with 7.1.6. The procedure is given in
7.1.2 through 7.1.8.
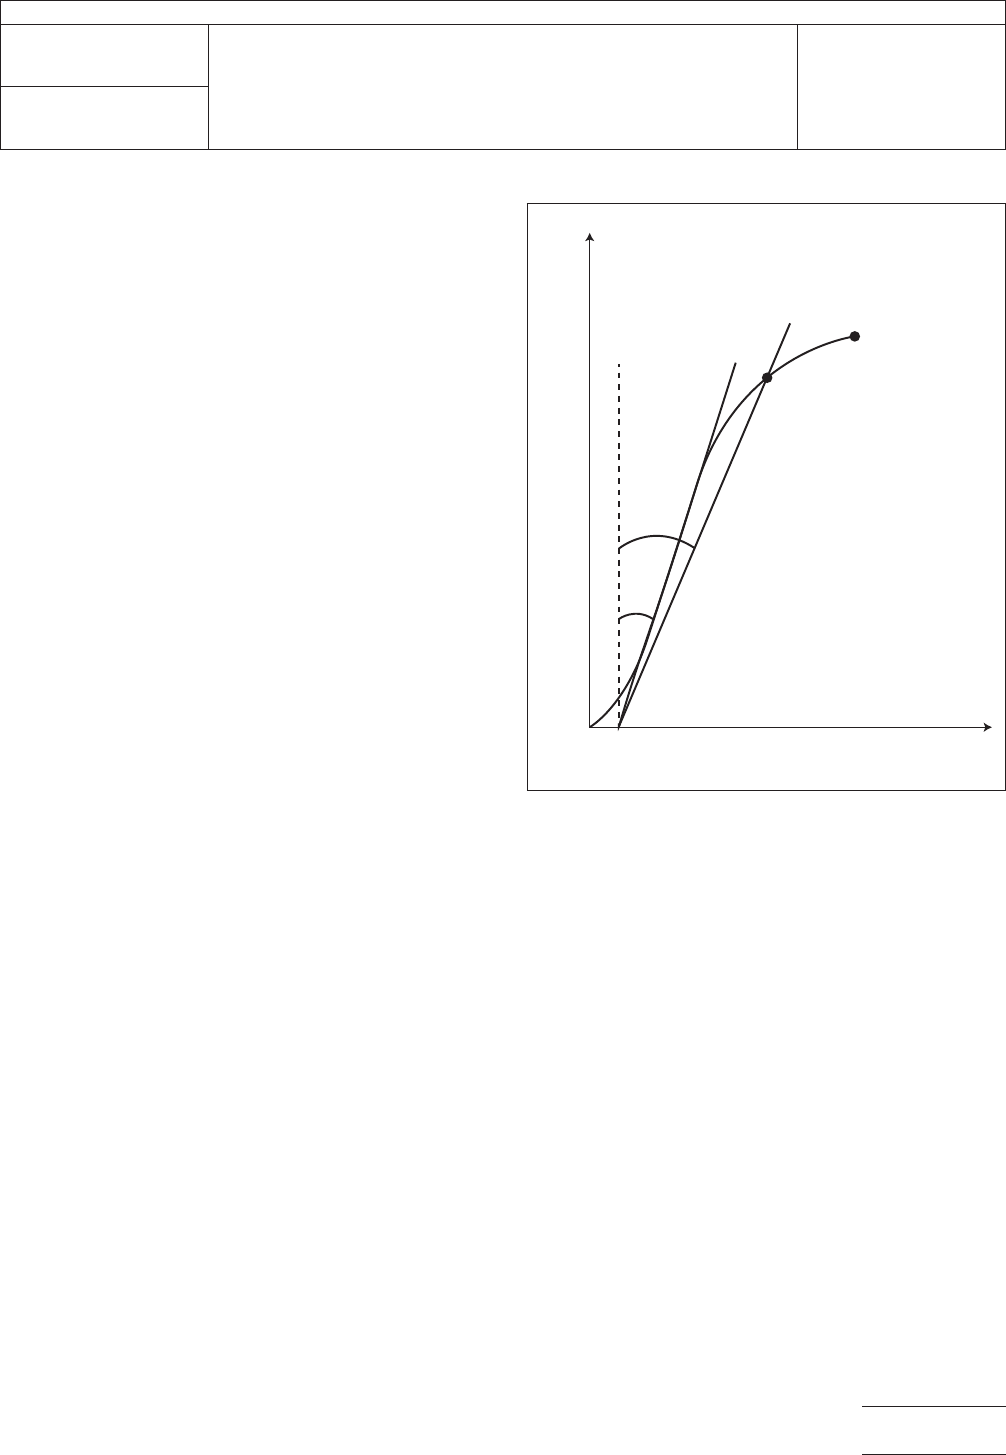
7.1.2 Load the specimen and obtain a P (load) versus u
(displacement) plot (see Figure 7-1).
Draw a best straight line (AB) to determine the initial compli-
ance, C. C is given by the reciprocal of the slope of line (AB).
Draw a second line (AB’) with a compliance 5 % greater than
that of line (AB). If the maximum load that the specimen was
able to sustain, Pmax, falls within lines (AB) and (AB’), use
Pmax to calculate K
Q
. If Pmax falls outside line (AB) and line
(AB’), then use the intersection of line (AB’) and the load curve
as P
Q
. Furthermore, if Pmax/P
Q
<1.1, use P
Q
in the calcula-
tion of K
Q
. However, if Pmax/P
Q
>1.1, the test is invalid.
7.1.3 Calculate K
Q
in accordance with the procedure for
single edge notch bending in 7.1.4. For this calculation, a
value of a, which is the total crack length after both notching
and pre-cracking, but before fracture, is best determined from
the fracture surface after testing. An average value is used,
but the difference between the shortest and longest length
should not exceed 10 %. Take care that it is the original crack
which is being observed, since slow growth can occur prior to
catastrophic fast fracture.
7.1.4 (Reference ASTM D5045, Section A1.4). The general
formula for K
Q
calculation of bend specimens is given in [Ref.
3]. The general principles of the bend-test fixture are illustrated
in Figure 7.2.
2-4-52-7-1.eps
Figure 7-1 Determination of C and P
Q
P
A
u
Notes:
• Compliance (C) = tan
θ =
inverse slope of line AB
• 1.05 C = tan θ
'
θ
'
θ
B
B
'
P
Q
P
max
IPC-TM-650
Number
2.4.52
Subject
Fracture Toughness of Resin Systems for Base Materials
Date
07/13
Revision
Page3of8
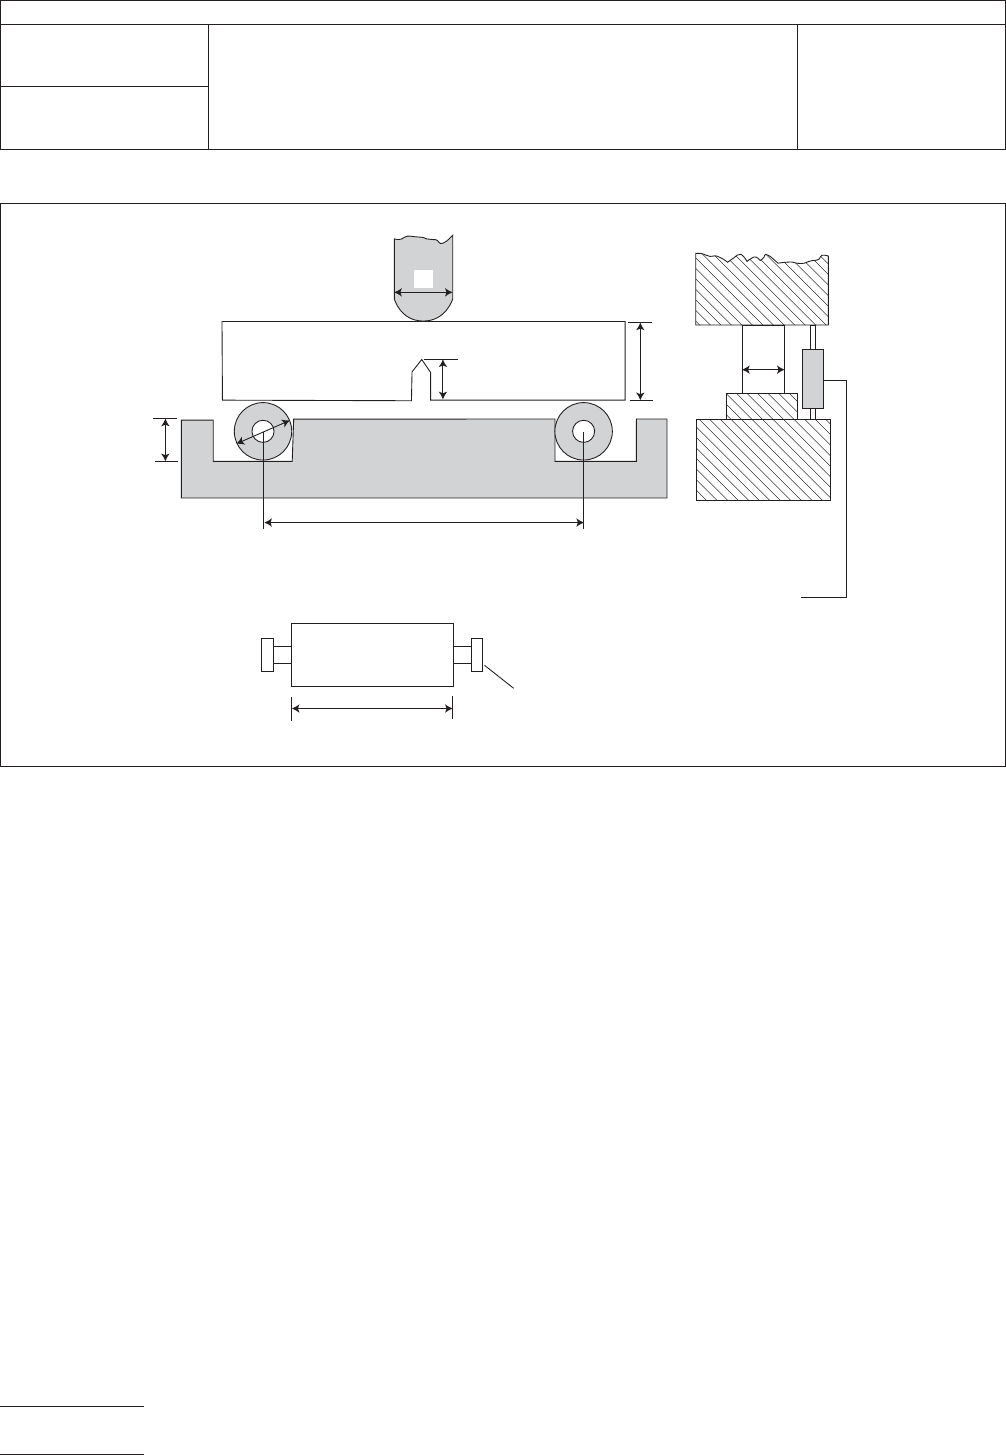
This fixture is designed to minimize frictional effects by allow-
ing the support rollers to rotate and move apart slightly as the
specimen is loaded, thus permitting rolling contact. Thus, the
support rollers are allowed limited motion along the plane sur-
faces parallel to the notched side of the specimen, but are ini-
tially positively positioned against stops that set the span
length at 50 mm, and are held in place by low-tension springs
(such as rubber bands). For the bend specimen, the displace-
ments will be essentially independent of the gauge length up
to a gauge length of W/2. For bend specimens with S/W = 4,
K
Q
in units of MPa Ë m
1/2
is as follows:
K
Q
=(P
Q
/BW
1/2
) ƒ(x)
where (0<x<1):
ƒ(x) = 6x
1/2
(1.99 - x(1-x)(2.15 - 3.93x + 2.7x
2
))/(1+2x)
(1-x)
3/2
and:
P
Q
= load as determined in 7.1.2, kN,
B = specimen thickness, cm,
W = specimen depth (width), cm,
a = crack length, cm
and
x = a/W.
2-4-52-7-2.eps
Figure 7-2 Bending Rig with Transducer for Single-Edge-Notch Bending (SENB)
Busses For Rubber Bands (see ASTM E399)
W/2 < D < W
Displacement Transducer
Support Rollers
a
B
W
0.6D
D
B
S = 4W
D
IPC-TM-650
Number
2.4.52
Subject
Fracture Toughness of Resin Systems for Base Materials
Date
07/13
Revision
Page4of8