IPC-TM-650 EN 2022 试验方法.pdf - 第322页
and measurement start and end points and computer gener- ated lines (see Figure 1). 5.6.2 Optionally plot the storage modulus, loss modulus, and tan δ vs. temperature (°C) for the specimen (see Figure 4). 6 Notes 6.1 Cal…
5.3.3
Examine
all specimens after the test to look for signs
of excessive loads, distortions, tears, and other defects. If any
defects or sample irregularities are found, discard the sample
and the data, rerun another specimen, or pick a different
method for determining T
g
and
storage modulus.
5.4
Calculations
5.4.1 Glass Transition Temperature (T
g
)
Construct
a
tangent line to the curve below the transition temperature in
the modulus curve. Construct a tangent to the storage modu-
lus curve at or near the inflection point approximately midway
through the step change in the transition. The temperature
where these tangents intersect is the reported T
g
for
the
material. For consistency it is recommended that the DMA
computer analysis software be used for this calculation. See
Figure 1 for an example of this tangent intersection method.
5.4.2
Storage Modulus (E’)
The
sample storage modulus
(E’) shall be calculated at room temperature (22°C) and
reported in units of Pa (N/m
2
).
For consistency it is recom-
mended that the DMA computer analysis software be used for
this geometry specific calculation.
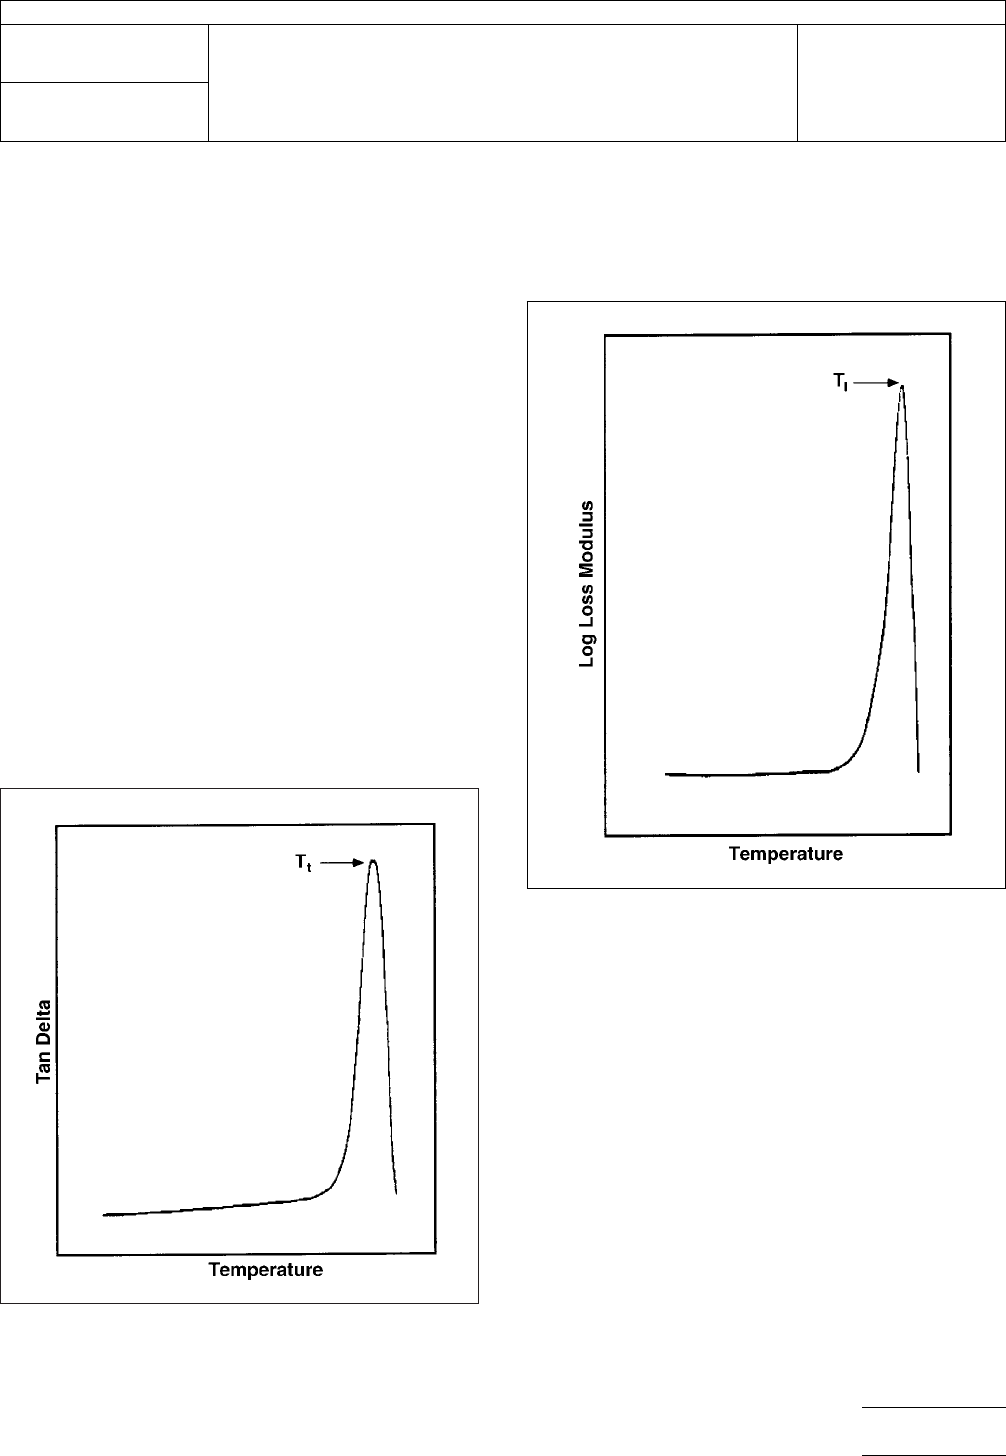
5.4.3
Alternative
thermal transitions may be reported as the
transition peak temperature in the sample loss modulus (T
I
)o
r
tan δ plots (T
t
)
(see Figure 2 and Figure 3).
5.5
Report
5.5.1
Report
the glass transition temperature 22°C (room
temperature) for each specimen, rounding to the nearest
whole number.
5.5.2
Report
the modulus in units of Pa (N/m
2
)
at 22°C.
5.5.3
For
anisotropic (reinforced) samples report the both
the x and y direction modulus.
5.6
Plot
5.6.1
Plot
the storage modulus vs. temperature (°C) for the
specimen. If using computer-based analysis, include the T
g
IPC-24244-2
Figure
2 DMA Tan Delta Plot
Note: T
t
is
the transition peak temperature.
IPC-24244-3
Figure
3 DMA Loss Modulus Plot
Note: T
I
is
the transition peak temperature.
IPC-TM-650
Number
2.4.24.4
Subject
Glass
Transition and Modulus of Materials Used in High Density
Interconnection (HDI) and Microvias - DMA Method
Date
11/98
Revision
P
age3of5
电子技术应用 www.ChinaAET.com
and
measurement start and end points and computer gener-
ated lines (see Figure 1).
5.6.2
Optionally
plot the storage modulus, loss modulus,
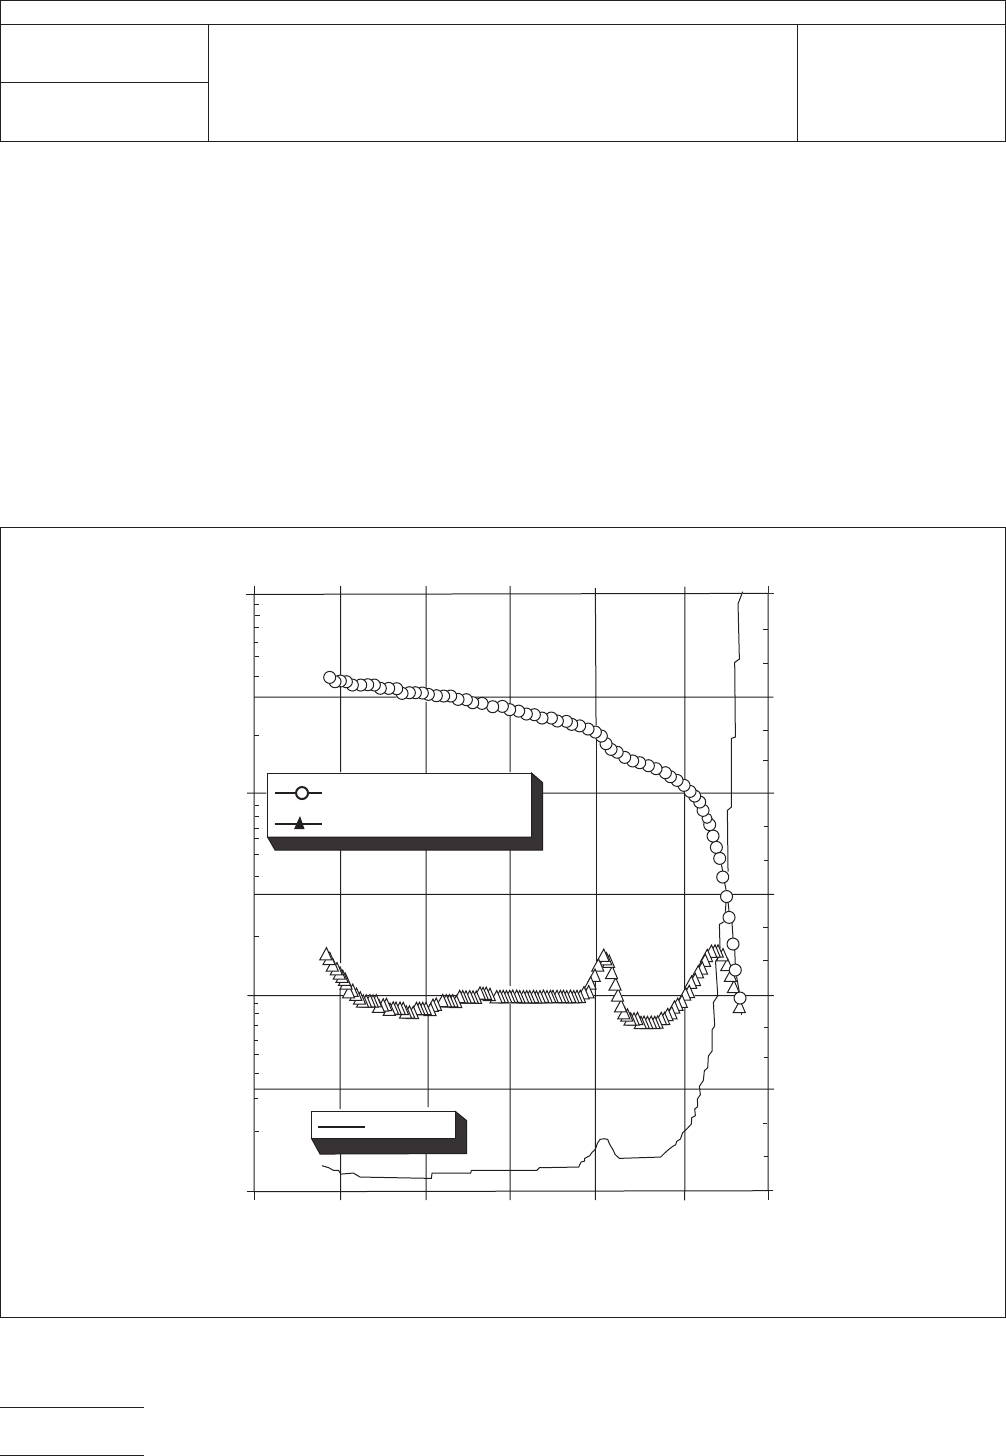
and tan δ vs. temperature (°C) for the specimen (see Figure 4).
6 Notes
6.1
Calibration
of the DMA must be carried out according to
the manufacturer’s instructions for the relevant sample geom-
etry and thermocouple temperature.
6.2
There
are several methods for determining the T
g
of
organic
materials:
• Differential scanning calorimetry (DSC)
• TMA
• DMA
T
g
in
organic materials is a broad transition, which arises when
molecular mobility greatly increases in the specimen as a
result of heating. No one method is superior to another; they
each measure different physical changes that occur in a
specimen near and around T
g
.
IPC-24244-4
Figure
4 DMA Plot for Storage Modulus, Loss Modulus, and Tan Delta on One Plot
Stora
ge Modulus (MPa)
Loss Modulus (MPa)
T
an Delta
200
150100
500
-50
-100
10.0
100.0
1000.0
10000.0
0.90
0.75
0.60
0.45
0.30
0.15
0.0
T
emperature (
˚
C)
Stora
ge Modulus (MPa)
T
an Delta
IPC-TM-650
Number
2.4.24.4
Subject
Glass
Transition and Modulus of Materials Used in High Density
Interconnection (HDI) and Microvias - DMA Method
Date
11/98
Revision
P
age4of5
电子技术应用 www.ChinaAET.com

DSC
measures the heat capacity of a specimen, TMA mea-
sures the expansion of a specimen, and DMA measures the
stiffness of the specimen. The T
g
determined
from TMA, DSC,
and DMA may vary significantly (up to 20°C) because they are
measuring different physical properties, which change differ-
ently as the specimen goes through T
g
.
As a result, the test
equipment used should be noted after the reported T
g
value
(i.e., 136°C; DSC, TMA, or DMA).
6.3
Most
thermal analysis equipment have the software
capability to determine sample T
g
and
modulus values; it is
recommended that this approach be used for consistency.
6.4
Load Selection Criteria
The
initial load should be 5 g
of tension (approximately 50 mN). The load (or force) may be
adjusted for differences in material types or specimen configu-
ration in order to assure the specimen is being held without
slack. Avoid an excessive load (or force), which may result in
elongation of the specimen due to the applied tension. Speci-
mens above T
g
may
become so soft as to be stretched.
Examine all specimens after the test to look for signs of exces-
sive loads, distortions, tears, and other defects.
6.5
Thermal Stresses and Other Anomalies
DMA
results
may be affected by any stresses that might have been frozen
into the sample during processing. Samples showing anoma-
lous behavior should be run a second time or preconditioned
to remove such stresses. Holding the sample temperature at
20°C above the glass transition and holding for five minutes,
followed by slow cooling, will normally remove the stresses in
the sample.
6.6
Understanding DMA
Refer
to ASTM D-4092 for a bet-
ter understanding of concepts and definitions of terms for
dynamic mechanical measurements.
6.7
Instrument Suppliers
DMA
instruments capable of
meeting the requirements of this test method are known to be
available from:
TA Instruments
Perkin Elmer Corp.
Seiko Instruments, Inc.
Rheometrics Scientific
Netzsch Instruments, Inc.
IPC-TM-650
Number
2.4.24.4
Subject
Glass
Transition and Modulus of Materials Used in High Density
Interconnection (HDI) and Microvias - DMA Method
Date
11/98
Revision
P
age5of5
电子技术应用 www.ChinaAET.com