IPC-TM-650 EN 2022 试验方法.pdf - 第769页
IPC-2627-5-1 Figure 5-1 260 °C Nominal Reflow Profile Chart (Default)* 260 °C Re flow Profile Spe cifications t1 t2 t3 A BC DE F G H I J KL M N T1 T2 30 60 90 120 150 180 210 240 270 300 0 60 120 180 240 300 360 420 480 54…
Table 5-1 260 °C Nominal Reflow Profile Specifications (Default)*
Value Time (Seconds) Temperature (°C) Description
t1 210 ± 15 – Target preheat time
t2 270 ± 10 – Target peak reflow time
t3 330 ± 15 – Target cool-down start time
t3 - t1 120 ± 30 – Target time above T1
T1 – 230 Maximum preheat temperature
T2 – 260 ± 5 Target reflow temperature
Point Time (Seconds) Temperature (°C) Description
A030
Upper specification limit values
B 100 230
C 195 230
D 255 265
E 285 265
F 345 230
G 550 30
H3030
Lower specification limit values
I 157 93
J 225 230
K 260 255
L 280 255
M 315 230
N 383 30
Segment Slope (°C / second) Description
A-B & I-J 2.0 Maximum preheat rate
H-I 0.5 Minimum preheat rate
F-G -1.0 Minimum cool-down rate
M-N -3.0 Maximum cool-down rate
IPC-TM-650
Number
2.6.27
Subject
Thermal Stress, Convection Reflow Assembly Simulation
Date
2/2020
Revision
B
Page3of10
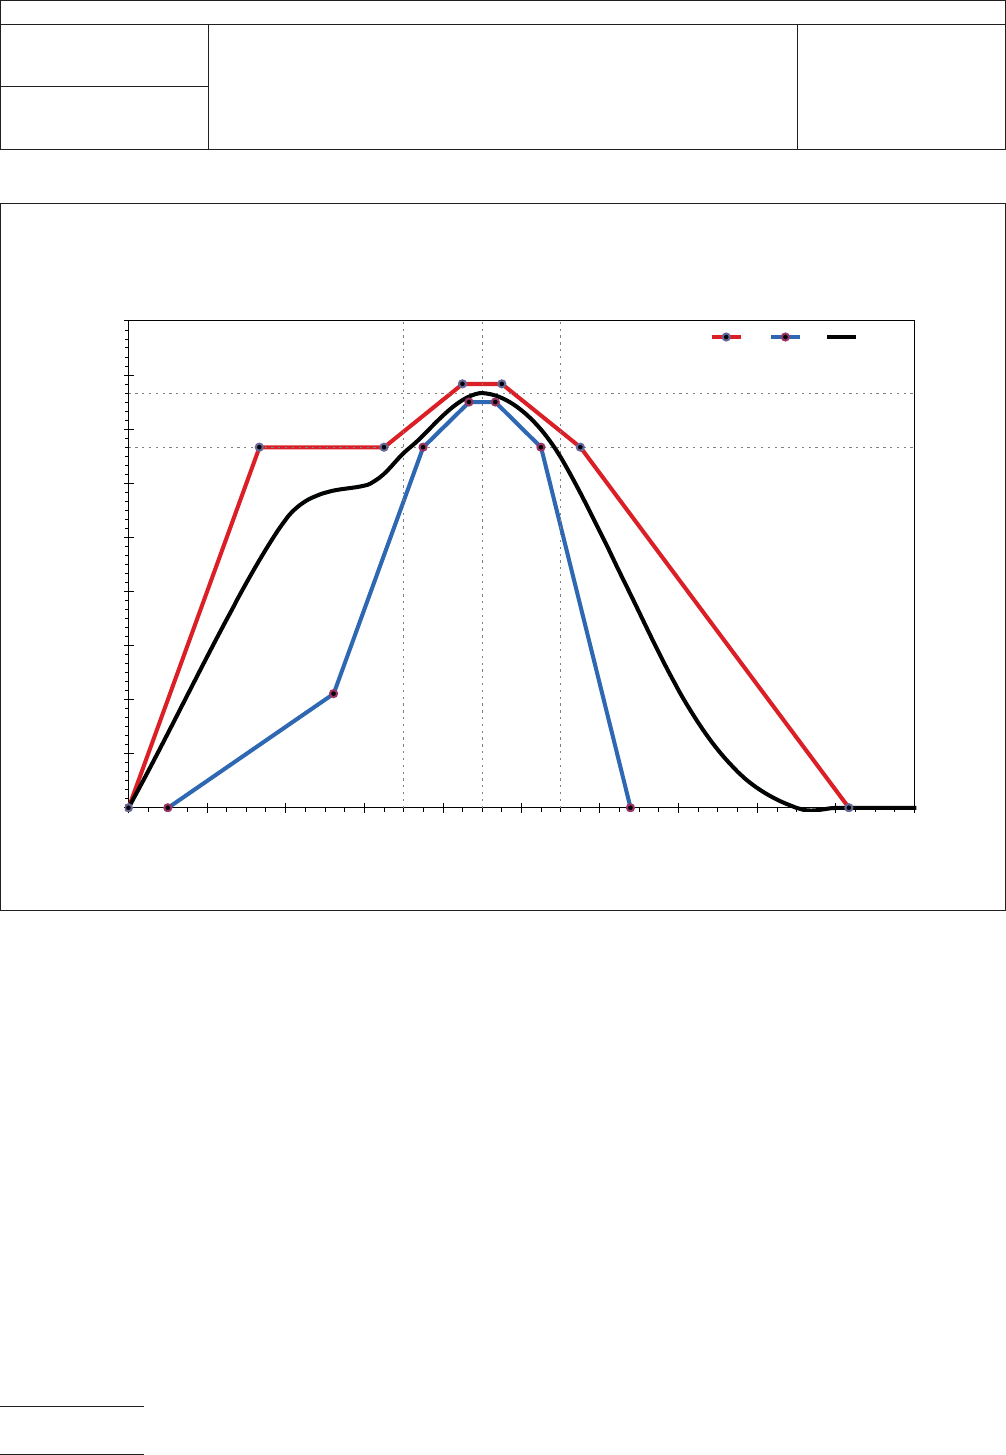
IPC-2627-5-1
Figure 5-1 260 °C Nominal Reflow Profile Chart (Default)*
260 °C Reflow Profile Specifications
t1 t2 t3
A
BC
DE
F
G
H
I
J
KL
M
N
T1
T2
30
60
90
120
150
180
210
240
270
300
0 60 120 180 240 300 360 420 480 540 600
Time (Seconds)
Temperature (°C)
USL LSL Example
IPC-TM-650
Number
2.6.27
Subject
Thermal Stress, Convection Reflow Assembly Simulation
Date
2/2020
Revision
B
Page4of10
Table 5-2 230 °C Nominal Reflow Profile Specifications (Low Temperature Profile)*
Value Time (Seconds) Temperature (°C) Description
t1 186 ± 15 – Target preheat time
t2 239 ± 10 – Target peak reflow time
t3 292 ± 15 – Target cool-down start time
t3 - t1 106 ± 30 – Target time above T1
T1 – 203 Maximum preheat temperature
T2 – 230 ± 5 Target reflow temperature
Point Time (Seconds) Temperature (°C) Description
A030
Upper specification limit values
B 88 203
C 172 203
D 226 235
E 252 235
F 305 203
G 487 30
H3030
Lower specification limit values
I 139 83
J 199 203
K 230 225
L 248 225
M 279 203
N 339 30
Segment Slope (°C / second) Description
A-B & I-J 2.0 Maximum preheat rate
H-I 0.5 Minimum preheat rate
F-G -1.0 Minimum cool-down rate
M-N -3.0 Maximum cool-down rate
IPC-TM-650
Number
2.6.27
Subject
Thermal Stress, Convection Reflow Assembly Simulation
Date
2/2020
Revision
B
Page5of10