IPC-TM-650 EN 2022 试验方法.pdf - 第22页
Measurement Precision Study – Binary Data Calculations T able 1: Data Entry Form Enter test results into the table below . T ester Samples 123456789 1 0 True Standard 1 2 3 4 5 6 7 8 9 10 T able 2: Samples Dispositioned …

c. Standard Practice for Conducting an Interlaboratory Study
to Determine the Precision of a Test Method, E691-99,
ASTM, Philadelphia, PA (www.astm.org).
d. Concepts for R&R Studies, Larry B. Barrentine, (ISBN
0-87389-108-2), ASQC Press, Milwaukee, WI ((www.quali-
typress.asq.org).
e. Basic Statistics, 4th Edition, Mark J. Kiemele, Stephen R.
Schmidt, Ronald Berdine, Air Academy Press, 1997, ISBN
1-880156-06-7, pages 9-71 to 9-77
f. ‘‘Is 100% Test 100% Effective,’’ W. Russell, 1998 IPC
EXPO, San Jose, CA (gives methods for calculating the
likely outcomes on product test for differing levels of mea-
surement precision.)
6.3
Software
Measurement precision studies are greatly
facilitated by use of software to perform the calculations.
Below are just a few of the many software packages which
can be used for this purpose. Reference (a) is an Excel
spreadsheet written to perform the calculations in this proce-
dure.
a. Measurement Precision Calculator For Binary Data, Excel
spreadsheet, available at http://www.ipc.org/html/
testmethods.htm, free of charge.
b. Statgraphics Plus, Manugistics Corp, 2115 East Jefferson
Street, Rockville, MD, 20852-4999 (www.statgraphic-
s.com).
c. SPC XL, Air Academy Press, 1155 Kelly Johnson Blvd,
Colorado Springs, CO 80920 (www.airacad.com).
d. Minitab, Minitab. Inc., 3081 Enterprise Dr, State College,
PA 16801 (www.minitab.com).
e. Interlaboratory Data Analysis Software for E691, ASTM,
100 Barr Harbor Dr, West Conshohocken, PA 19428
(www.astm.org).
IPC-TM-650
Number
1.8
Subject
Measurement
Precision Estimation for Binary Data
Date
01/03
Revision
A
P
age3of6
Measurement
Precision Study – Binary Data
Calculations
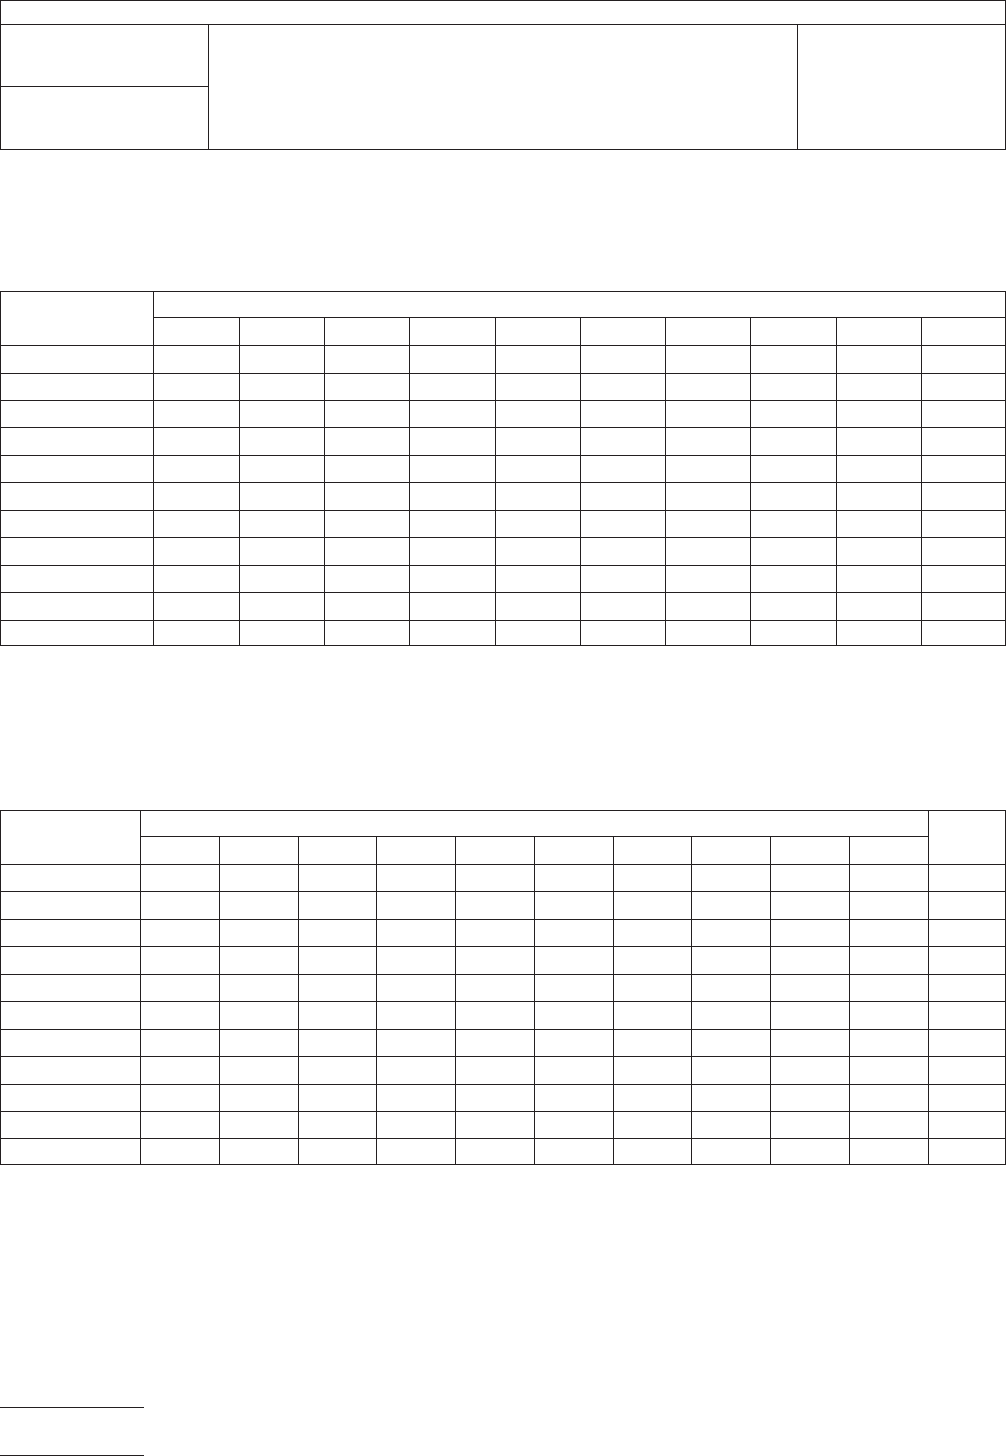
Table 1: Data Entry Form
Enter test results into the table below.
T
ester
Samples
12345678910
True
Standard
1
2
3
4
5
6
7
8
9
10
Table 2: Samples Dispositioned Correctly
Score a ‘‘1’’ where disposition in Table 1 above matched the true standard.
Score a ‘‘0’’ where disposition did not match the true standard.
Note these scores for each of the testers in the table below.
T
ester
Samples
12345678910Total
True
Standard
1
2
3
4
5
6
7
8
9
10
IPC-TM-650
Number
1.8
Subject
Measurement
Precision Estimation for Binary Data
Date
01/03
Revision
A
P
age4of6
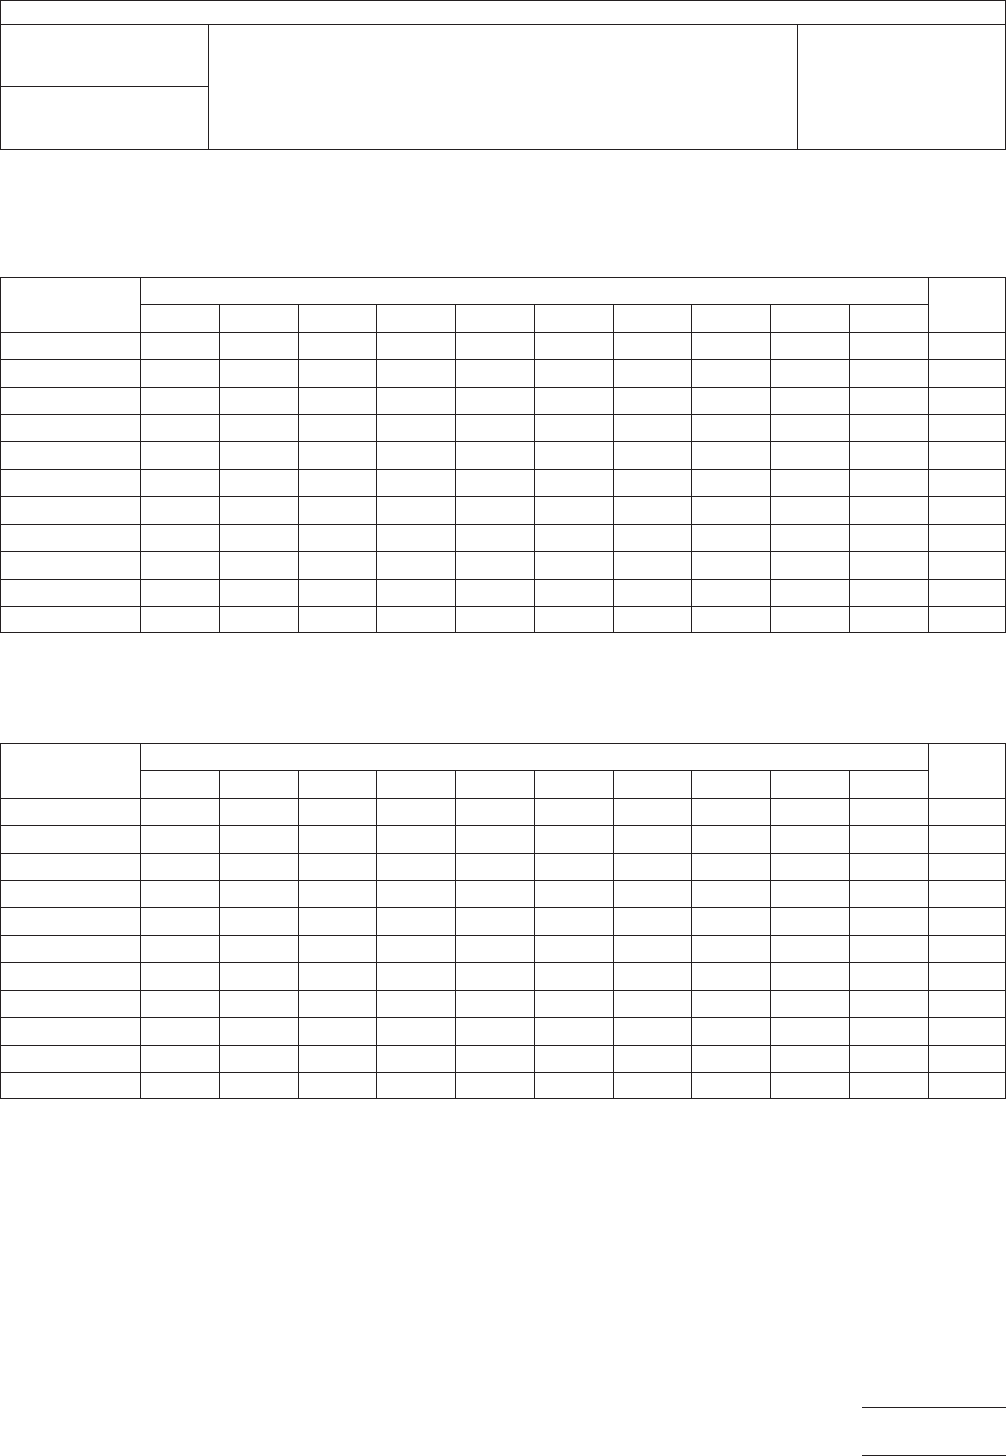
T
able 3: Good Parts That Were Rejected
Score a ‘‘1’’ where good parts were rejected in Table 1 above.
Score a ‘‘0’’ everywhere else.
Note the scores for each tester in the table below.
T
ester
Samples
12345678910Total
True
Standard
1
2
3
4
5
6
7
8
9
10
Table 4: Bad Parts That Were Accepted
Score a ‘‘1’’ where bad parts were accepted in Table 1 above.
Score a ‘‘0’’ everywhere else.
T
ester
Samples
12345678910Total
True
Standard
1
2
3
4
5
6
7
8
9
10
IPC-TM-650
Number
1.8
Subject
Measurement
Precision Estimation for Binary Data
Date
01/03
Revision
A
P
age5of6