IPC-TM-650 EN 2022 试验方法.pdf - 第401页
Users of this test method should apply the principles outlined in E-691 to generate the data specific to their laboratory and materials, or between specific laboratories. The principles would then be valid for such data.…
The factors f, Φ and ψ are given in Table 7-1 and Table 7-2
for each geometry. This value of E/(1 - v
2
) shall be compared
with that obtained from K
1c
2/G
1c
. The former value should
be the larger, but the difference should be <15 %. The cor-
rected compliance, C
c
, is obtained from the measured com-
pliance in the fracture test, C
Q
, and the compliance from the
indentation test, Ci, in accordance with the following:
C
c
=C
Q
-C
i
[Ref. 5, SENB]
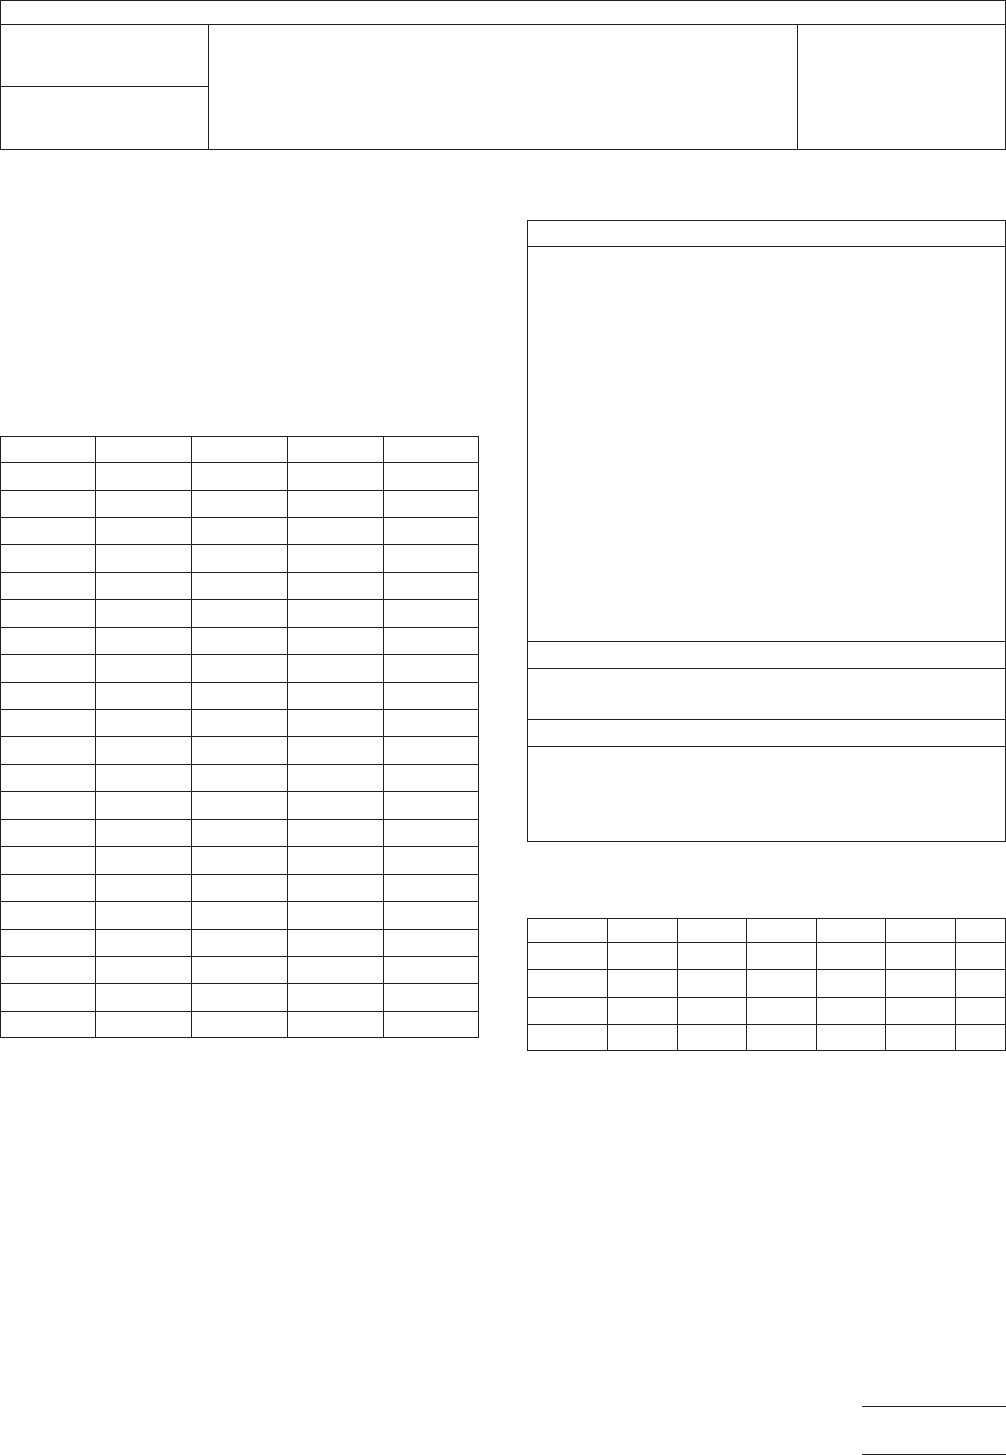
Table 7-2 Calibration Factors Compact Tension
A
a/W ƒ (x) Φψη
e
0.450 8.34 0.208 28.9 2.64
0.455 8.45 0.207 29.6 2.63
0.460 8.57 0.207 30.4 2.61
0.465 8.70 0.206 31.1 2.60
0.470 8.83 0.205 31.9 2.58
0.475 8.96 0.204 32.7 2.57
0.480 9.09 0.203 33.5 2.56
0.485 9.23 0.202 34.4 2.54
0.490 9.36 0.201 35.3 2.53
0.495 9.51 0.200 35.3 2.53
0.500 9.65 0.199 37.1 2.51
0.505 9.81 0.198 38.0 2.50
0.510 9.96 0.197 39.0 2.49
0.515 10.12 0.196 40.0 2.48
0.520 10.28 0.194 41.1 2.47
0.525 10.45 0.193 42.1 2.46
0.530 10.62 0.192 43.3 2.45
0.535 10.80 0.190 44.4 2.44
0.540 10.98 0.189 45.6 2.43
0.545 11.17 0.188 46.8 2.42
0.550 11.36 0.186 48.1 2.41
A
Values calculated using J. A. Knapp, G. S. Leger and B. Gross, Fracture
Mechanics Sixteenth Symposium, ASTM, STP 868, 19, pp. 27 - 44.
7.4 Report List the information required to perform the test
and the results obtained in the form of a table. The form to
use is provided in Table 7-3.
7.4.1 Table 7-4 is based on a round robin conducted in
1988 in accordance with E-691, involving four materials
tested by nine laboratories. For each material, all the samples
were prepared at one source, but the individual specimens
were prepared at the laboratories which tested them. Each
test result was the average of three individual determinations.
Each laboratory obtained one test result for each material. The
following explanations of r and R are only intended to present
a meaningful way of considering the approximate precision of
this test method. The data in Table 7-4 should not be rigor-
ously applied to acceptance or rejection of material, as those
data are specific to the round robin and may not be represen-
tative of other lots, conditions, materials, or laboratories.
Table 7-3 Testing Summary
Fracture Test Parameters
Testing Laboratory
Materials/orientation
Specimen geometry
Test temperature, °C
Loading rate, m/s
Notching method
Specimen number
Width (W), mm
Crack length from 7.2.2, mm
P
max
,N
P
max
loading rate, s
PQ loading time, s
Stable or unstable growth
K
Q
,MPa-m
1/2
Uncorrected energy, J
Corrected energy, J
G
Ic
, kJ/m
2
Tensile Test Parameters
σy, MPa
σy loading time, s
Validity Checks
Pmax/PQ
2.5 (KQ/sy)
2
E/(1 - ν
2
) via C, MPa
E/(1 - ν
2
) via K
Q
2
/G
c
, MPa
Table 7-4 Precision Statistics from Round-Robin
Study in Accordance with Practice ASTM E691
Material
A
Average S
x
S
r
S
R
rR
A 4.34 0.652 0.235 0.679 0.658 1.90
B 5.70 1.420 0.618 1.510 1.730 4.23
C 3.60 0.692 0.343 0.747 0.960 2.09
D 5.90 1.950 0.944 2.100 2.640 7.39
A
Material A is values of K
Ic
for nylon. Material B is values of G
Ic
for nylon.
Material C is values of K
Ic
for polycarbonate. Material D is values of G
Ic
for
polycarbonate. Units for all columns are as follows: K
Ic
[=] MP
a
Ë m
1/2
&G
Ic
[=] kJ/m
2
.
IPC-TM-650
Number
2.4.52
Subject
Fracture Toughness of Resin Systems for Base Materials
Date
07/13
Revision
Page7of8

Users of this test method should apply the principles outlined
in E-691 to generate the data specific to their laboratory and
materials, or between specific laboratories. The principles
would then be valid for such data.
7.4.2 Concept of r and R (Reference ASTM D5045, Section
11.2). If Sr and SR have been calculated from a large enough
body of data, and for test results that were averages from
testing three specimens, the following information applies.
7.4.2.1 Repeatability, r (comparing two test results for the
same material, obtained by the same operator using the same
equipment on the same day). The two test results should be
judged not equivalent if they differ by more than the r value for
that material.
7.4.2.2 Reproducibility, R (comparing two test results for the
same material, obtained by different operators using different
equipment on the same day). The two test results should be
judged not equivalent if they differ by more than the R value
for that material.
7.4.2.3 Any judgement in accordance with the above would
have an approximate 95 % (0.95) probability of being correct.
7.4.3 Bias There are no recognized standards by which to
estimate bias of these test methods.
7.4.4 Keywords (Reference ASTM D 5045, Section 12)
• Critical-strain energy release rate
• Energy-to-break
• Fracture toughness
• Plane-strain fracture toughness
References
(1) Brown, W. F., Jr., and Srawley, J. E., “Plane Strain Crack
Toughness Testing of High Strength Metallic Materials,” ASTM
STP 410, ASTM, 1966, p.1.
(2) “Fracture Toughness Testing and Its Applications,” ASTM
STP 381, ASTM, April 1965, p.30.
(3) Srawley, J. E., “Wide Range Stress Intensity Factor
Expressions for ASTM E399 Standard Fracture Toughness
Specimens,” International Journal of Fracture Mechanics, Vol.
12, June 1976, p.475.
(4) Newman, J. C., “Stress Analysis of Compact Specimens
Including the Effects of Pin Loading,” ASTM STP 560, ASTM,
1974, p.105.
(5) Williams, J. G., “Fracture Mechanics of Polymers,” Ellis
Horwood/Wiley, 1985.
(6) Towers, O. L., “Stress Intensity Factors, Compliances and
Elastic η
e
Factors for Six Test Geometries,” The Welding Insti-
tute, March 1981.
IPC-TM-650
Number
2.4.52
Subject
Fracture Toughness of Resin Systems for Base Materials
Date
07/13
Revision
Page8of8

1 Scope This test method details the dye and pull proce-
dure (formerly known as dye and pry) utilizing dye penetrant
analysis of surface-mount technology (SMT) components to
confirm assembly process parameters and solder joint quality/
integrity.
This Test Method is for observation only, to determine the
existence of dye indications.
2 Applicable Documents
IPC-7095
Design and Assembly Process Implementation for
Ball Grid Arrays (BGAs)
3 Test Specimens The specimen is a SMT part soldered
to a board. Typically, this method is used on ball grid arrays
(BGAs) to evaluate their solder joint quality/integrity; however,
it also can be used on other SMT parts, such as bottom ter-
mination components (BTCs) and connectors.
4 Apparatus or Material
4.1
Recommended dye: Red Steel Dykem® or equivalent
4.1.1 Oil-based dyes are not recommended for this
procedure.
4.2 Vacuum pump and chamber (typically a mechanical
pump and bell jar)
4.2.1 Recommend metallurgical epoxy vacuum chamber
with vacuum gauge
4.3 Stereo microscope with digital camera
4.4 Baking oven capable of 100 °C
4.5 Cutting tool to section-out desired components from the
board without exerting excessive stress on the solder joints
4.5.1 Diamond sectioning saw recommended
4.6 JB Weld or equivalent structural adhesive strong enough
to bond the tee nut to the part package surface and withstand
the pull force
4.7 Tool to separate the component from the board
4.8 Compressed or canned air
4.9 Appropriate solvent (or solvent agreed upon between
the lab and the customer) for removal of flux residues remain-
ing on the board
4.10 General/assorted lab equipment (e.g., tongs, glass
beaker, cut-down plastic beaker, funnel, etc.)
4.11 Recommended safety equipment (e.g., fume hood,
gloves, eye protection, etc.)
4.12 Tee nuts appropriate to the size of the part
4.13 Sand paper (320 grit)
5 Procedure
5.1
Identify components to be dye and pull evaluated (con-
sult test plan).
5.2 Perform an initial visual examination of the selected SMT
part.
5.2.1 The initial visual examination is used to detect signs of
mechanical damage/stress. If flux is present, examine for
fractured/broken-up or disturbed flux around the SMT solder
joints (see Figure 1 and Figure 2).
5.2.2 If the SMT part required the use of corner-applied
adhesive and the adhesive is visible, examine and document
it per customer requirements to determine if dye and pull test-
ing is applicable. See IPC-7095 for additional guidance on the
proper use of corner-applied adhesive.
5.3 If the part has a heatsink, package metal heat spreader
or any other assembly that is attached, proceed as follows to
avoid inducing any mechanical stress into the solder joint.
5.3.1 Remove the heatsink. If there is any concern with the
proper method to remove an attached heatsink, it is highly
recommended that it be left in place until after the dye-drying
step (5.11).
3000 Lakeside Drive, Suite 105N
Bannockburn, IL 60015-1249
IPC-TM-650
TEST METHODS MANUAL
Number
2.4.53
Subject
Dye and Pull Test Method (Formerly Known as Dye
and Pry)
Date
8/2017
Revision
Originating Task Group
Bottom Termination Components (5-22k)
Material in this Test Methods Manual was voluntarily established by Technical Committees of IPC. This material is advisory only
and its use or adaptation is entirely voluntary. IPC disclaims all liability of any kind as to the use, application, or adaptation of this
material. Users are also wholly responsible for protecting themselves against all claims or liabilities for patent infringement.
Equipment referenced is for the convenience of the user and does not imply endorsement by IPC.
Page1of11