IPC-TM-650 EN 2022 试验方法.pdf - 第442页
L 1.12 1.70 GHz S 2.60 3.90 GHz C 3.95 5.85 GHz X 8.00 12.40 GHz 9.5 Other Metal-Clad Dielectrics This method can be adapted for measurements of other metal-clad dielectric materials. ∆ L must be determined for each new …

NOTE: GHz
is equivalent to cycles/ns to keep units consis-
tent in this section 7.2.1.
W = resonator width, mm
T = resonator conductor thickness, mm
Where combinations of resonant frequency, resonator width,
ground plane spacing, and nominal permittivity are encoun-
tered other than those listed in Table 1, a calculated 1/Q
c
must
be agreed upon. Data is not currently available for cor-
recting this calculated value to account for increased conduc-
tor loss due to surface treatments or type of copper foil used.
7.2.2
Corrections to the Loss Factor
Corrections
in the
total loss value, 1/Q, may be needed for materials of high
anisotropy of ε
r
as
mentioned in 1.2.2. The Q actually mea-
sured is Q
loaded
,
but is often assumed to be Q
unloaded
.
The
probe gap given in Table 1 is intended to provide insertion
loss at a resonance high enough to make Q
loaded
approxi-
mately
equivalent to Q
unloaded
.
When
materials with high anisotropy of permittivity are mea-
sured, probe coupling is affected and the insertion loss
becomes small, making a correction useful before applying
the above calculations. Insertion loss is determined by com-
paring transmitted power at resonant frequency of the fixture
and specimen with the resonator pattern card and with a simi-
lar card having a straight through 50 Ohm line. The dB
r
differ-
ence
as dB
r
is
related to the power ratio by
P
2
/P
1
=e
(log
e
(10)
dB
r
/
10)
[8]
and
the unloaded Q is determined from the measured Q by
Q
unloaded
=Q
loaded
/ [1-
√
P
2
/ P
1
] [9]
The
following values illustrate this relationship:
dB
r
60
50 40 30 20 15 10 5
Q
unloaded
/
Q
loaded
1.00
1.00 1.01 1.03 1.11 1.22 1.46 2.28
8.0 Report
The
report shall contain the following:
• The measured length of the resonator and ∆L value.
• The measured thickness of specimen stacks.
• The maximum transmission (resonant) frequency, f
r
.
•
If the three point method of 6.2, 6.3 or 6.4.1 is used, report
the frequencies of the two 3 dB points on the resonance
curve or the frequency and actual dB value of the two
points.
• If the non-linear regression (NLR) method of 6.4.2 is used,
then optionally report the number of data points used, NLR
uncertainty values for f
r
,Q
loaded
,d
B
r
•
The calculated effective stripline permittivity.
• The calculated effective dielectric loss tangent.
• If the test was not done in the X or machine direction, give
the direction in which test was performed. That is, orienta-
tion of the resonator with respect to the X or Y axis of the
specimen.
• The temperature of the test fixture during the test.
• The grade of copper foil used in the test pattern card.
9.0 Notes
9.1
Permittivity
The
dielectric of a stripline circuit affects
the electrical response of all the circuits printed on it. Velocity
of propagation, wavelength, and characteristic impedance all
vary with permittivity. If the permittivity varies from the design
value, the performance of such circuits is degraded.
Throughout this document, the term ‘‘permittivity’’ refers to
relative permittivity of the dielectric material, a dimensionless
ratio of the absolute permittivity of the material to that of a
vacuum.
9.2
Loss Tangent
The
attenuation and Q (figure of merit) of
stripline circuits are a function of combined copper and dielec-
tric loss. An excessively high loss tangent leads to loss in sig-
nal strength and to degraded performance of frequency selec-
tive circuits such as filters. In this method, a great saving in
time and cost of testing is achieved by using a permanent
stripline resonator, which is part of the test fixture. With this
fixture, variations in loss tangent due to the dielectric can be
monitored but not the additional loss due to the type of metal
and bonding treatment used in laminating.
9.3
Measurements at Other Frequency Bands
The
test
equipment of 4.1 can be modified for L, S, and C band mea-
surements at some additional cost. The test equipment of 4.2
will be able as is to handle other bands.
9.4
Frequency Ranges
Accepted
frequency ranges for the
various bands are:
IPC-TM-650
Number
2.5.5.5
Subject
Stripline
Test for Permittivity and Loss Tangent (Dielectric Constant
and Dissipation Factor) at X-Band
Date
3/98
Revision
C
P
age9of25
电子技术应用 www.ChinaAET.com

L
1.12 1.70 GHz
S 2.60 3.90 GHz
C 3.95 5.85 GHz
X 8.00 12.40 GHz
9.5
Other Metal-Clad Dielectrics
This method can be
adapted for measurements of other metal-clad dielectric
materials. ∆L must be determined for each new material.
Materials that are not somewhat compliant may yield signifi-
cant errors due to air gaps resulting from the conductor thick-
ness of the resonator.
9.6
Anisotropic Materials
For
anisotropic materials, test
methods in which the electric field is not imposed on the
dielectric in a stripline configuration can give misleading values
of effective stripline permittivity and loss tangent. This test
method measures an effective stripline permittivity.
9.7
High Permittivity Soft Substrates
Soft
substrates
consisting of PTFE highly filled with ceramic filler require addi-
tional steps in the preparation of resonator pattern cards to
embed the conductor pattern into the substrate so that thick-
ness of the card is uniform and the same in both the pattern
and non-pattern areas.
The following embedding procedure is needed when the reso-
nator pattern card has copper foil cladding of IPC-MF-150,
designation 1. If the weight of the foil is reduced to Q (0.010
mm), as recommended in 4.2.5 and mentioned in 5.1, then
the embedding procedure is not needed and consistency of
fixture performance with pattern card replacements is
improved. It appears that a soft substrate specimen is able to
accommodate the thinner pattern without excessive stress
concentration and bias in permittivity value.
When this preparative step is omitted or inadequately done for
designation 1 copper, it has been observed that for a given
resonator pattern card in the fixture, there will be a bias in the
permittivity value observed. For a specimen held in the fixture
for a period of time, there will be an initial high bias that drifts
downward over a period of several hours. When removed, the
specimen will have an embossed image of the resonator pat-
tern. When repeated testing is done among several speci-
mens with comparatively short clamp times of one or two
minutes before reading resonant frequency, the bias is initially
high and then decreases with frequency of test runs. This drift
in performance is observable when reference specimens are
repeatedly tested.
This drifting bias is believed to be due to the concentration of
the clamp force to the smaller resonator area used for these
materials combined with their higher degree of conformance.
Initially, the clamping excessively compresses material on both
sides of the resonator element raising its permittivity. With
time, the material in both pattern card and specimen con-
forms by deformation flow away from the high stress area so
that the bias decreases.
Use a card with embedded pattern leads to distribute stress
more evenly over the specimen for little or no drift in bias.
Embedding is done by clamping the pattern card between
stainless steel or aluminum foil release layers between accu-
rately planar metal blocks at about 0.69 to 1.38 MPa, while
heating the blocks above the polymer melt point long enough
to allow permanent conformance followed by cooling and
declamping.
10.0
References
1. Problems
in Strip Transmission Lines, Cohn, S. B., IRE
Transactions MTT 3 (March 1955): 119 126.
2. Microwave Filters, Impedance-Matching Networks, and
Coupling Structures, Matthaei, G. L.; Young, L.; and
Jones, E. M. TMcGraw Hill (1964): 206.
3. Characteristic Impedance of the Shielded- Strip Trans-
mission Line, Cohn, S. B., IRE Trans MTT, (July 1954): 52
57.
4. Discontinuities in the Center Conductor Strip Transmis-
sion Line, Altschuler, H. M. and Oliner, A. A IRE Transac-
tions MTT 8, (May 1960): 328.
5. The NIST 60-Millimeter Diameter Cylindrical Cavity Reso-
nator: Performance Evaluation for Permittivity Measure-
ments, NIST Technical Note 1354, Vanzura, E. J., Geyer,
R. G. and Janezic, M.D, August 1993, National Institute
of Standards and Technology, Boulder, CO 80303-3328.
IPC-TM-650
Number
2.5.5.5
Subject
Stripline
Test for Permittivity and Loss Tangent (Dielectric Constant
and Dissipation Factor) at X-Band
Date
3/98
Revision
C
Page
10 of 25
电子技术应用 www.ChinaAET.com
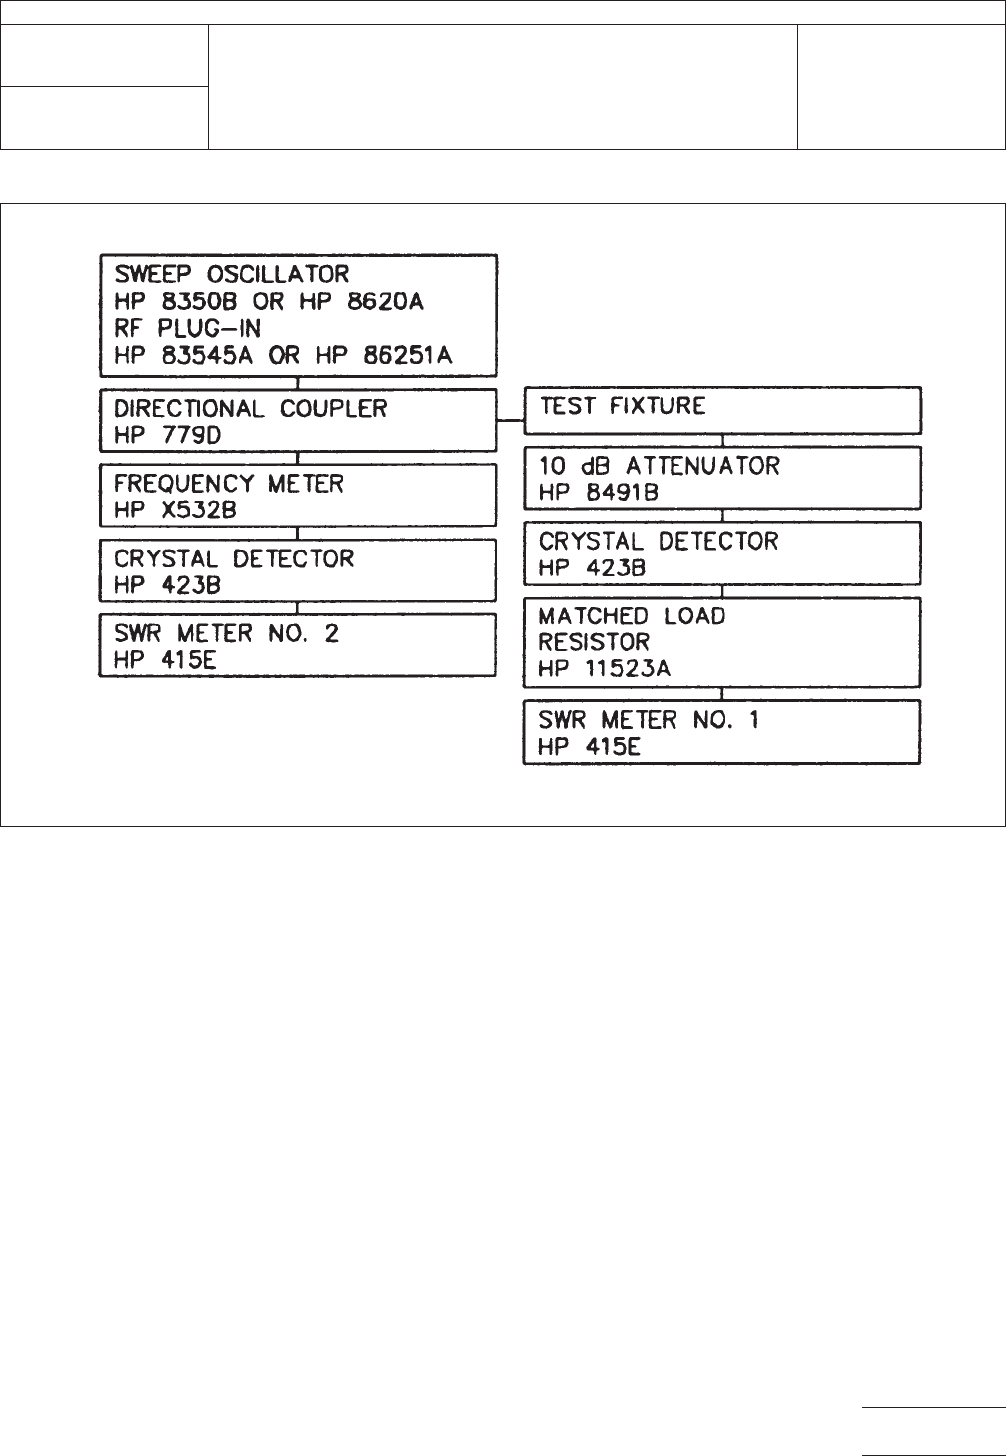
IPC-2555-1
Figure
1 X-Band Permittivity Test Setup
IPC-TM-650
Number
2.5.5.5
Subject
Stripline
Test for Permittivity and Loss Tangent (Dielectric Constant
and Dissipation Factor) at X-Band
Date
3/98
Revision
C
Page
11 of 25
电子技术应用 www.ChinaAET.com