IPC-TM-650 EN 2022 试验方法.pdf - 第311页
250 ° C [482 ° F] or other temperature as specified (such as, representative of a soldering operation). For example, determination of T g on a material with an antici- pated T g of 270 ° C [518 ° F] would require that th…

1.0
Scope
This
test is designed to determine the Glass
Transition Temperature (T
g
)
and the Thermal Expansion in the
Z-Axis of dielectric materials used in printed boards by the use
of thermal mechanical analysis (TMA).
Thermal Expansion (TE) is expressed in Coefficient of Thermal
Expansion (CTE) or Percent of Thermal Expansion (PTE).
2.0
Applicable Documents
None
3.0
Test Specimens
3.1 Size
Specimens
shall be approximately 6.35 mm x
6.35 mm [0.25 in x 0.25 in]. The thickness shall be a minimum
of 0.51 mm [0.020 in]; for thicknesses less than 0.51 mm
[0.020 in], or to increase the accuracy of the test, see 6.4.
3.2
Quantity and Sampling
Unless
otherwise specified,
two specimens shall be tested, to be taken from random loca-
tions of the material in question.
4.0
Apparatus or Material
4.1
Thermomechanical
analyzer (TMA) capable of determi-
nation of dimensional change to within 0.0025 mm [0.0001 in]
over the specified temperature range.
4.2
Diamond
blade or wheel, sanding equipment, or equiva-
lent, to provide a specimen of the size and edge quality speci-
fied.
4.3
Desiccator
capable of an atmosphere less than 30%
R.H. at 23°C [73.4°F].
4.4
Etching
system capable of complete removal of metallic
cladding.
4.5 Air
circulating oven capable of maintaining 105 ± 2°C
[221 ± 3.6°F].
4.6
Micrometer
capable of thickness measurements to
within 0.00025 mm [0.0001 in].
5.0
Procedure
5.1 Specimen Preparation
5.1.1
Metallic
clad laminate shall be tested without the clad-
ding. Specimens taken from multilayer boards shall have no
internal metal layers, if possible. Exterior metallic cladding shall
be removed by etching using standard industry practices.
5.1.2
Specimens
shall be cut to the specified size using
appropriate procedures and equipment to minimize mechani-
cal stress or thermal shock.
5.1.3
The
edges shall be smooth and burr-free by means of
sanding or equivalent (to allow the specimen to rest com-
pletely flat on the mounting stage). Use care to minimize
stress or heat on the specimen.
5.1.4
Specimens
shall be preconditioned by baking for 2 ±
0.25 hours, at 105 ± 2°C [221 ± 3.6°F], then cooled to room
temperature in a desiccator.
5.1.5
If
applicable, determine the thickness of the specimen
(for determination of Percent of Thermal Expansion) and
record as T
o
.
5.2
Measurement
5.2.1
Mount
the specimen on the stage of the TMA and
apply a load between 0.1 g and 10.0 g (see note 6.5 for
explanation of the load selection criteria).
5.2.2
Initial Temperature for Startup
a.
For T
g
determination,
start the scan at a temperature no
higher than 35°C [95°F]. An initial temperature of 23°C
[73°F] is recommended.
b. For TE determination start the scan at a temperature suf-
ficiently lower than the specified temperature range such
that the specified heat rate is stabilized (see 6.6).
5.2.3
Unless
otherwise specified, maintain the scan rate at
10°C [18°F] per minute.
5.2.4
Temperature Excursion
a.
For Tg determination, continue the temperature ramp to
at least 30°C [54°F] above the anticipated transition
region.
b. For TE determination, continue the temperature ramp to
The
Institute for Interconnecting and Packaging Electronic Circuits
2215 Sanders Road • Northbrook, IL 60062-6135
IPC-TM-650
TEST
METHODS MANUAL
Number
2.4.24
Subject
Glass
Transition Temperature and Z-Axis Thermal
Expansion by TMA
Date
12/94
Revision
C
Originating Task Group
MIL-P-13949 Test Methods Task Group (7-11b)
Material
in this Test Methods Manual was voluntarily established by Technical Committees of the IPC. This material is advisory only
and its use or adaptation is entirely voluntary. IPC disclaims all liability of any kind as to the use, application, or adaptation of this
material. Users are also wholly responsible for protecting themselves against all claims or liabilities for patent infringement.
Equipment referenced is for the convenience of the user and does not imply endorsement by the IPC.
P
age1of3
电子技术应用 www.ChinaAET.com
250°C
[482°F] or other temperature as specified (such
as, representative of a soldering operation).
For example, determination of T
g
on
a material with an antici-
pated T
g
of
270°C [518°F] would require that the test tem-
perature should reach in excess of 300°C [572°F]. TE mea-
surements should be determined only from that part of the
plot reaching 250°C [482°F] (or other temperature of interest).
5.2.5
If
residual stresses cause a sudden irreversible deflec-
tion at the glass transition, a second scan shall be run, either
on the same specimen or if desired, a new specimen.
5.3
Evaluation
5.3.1
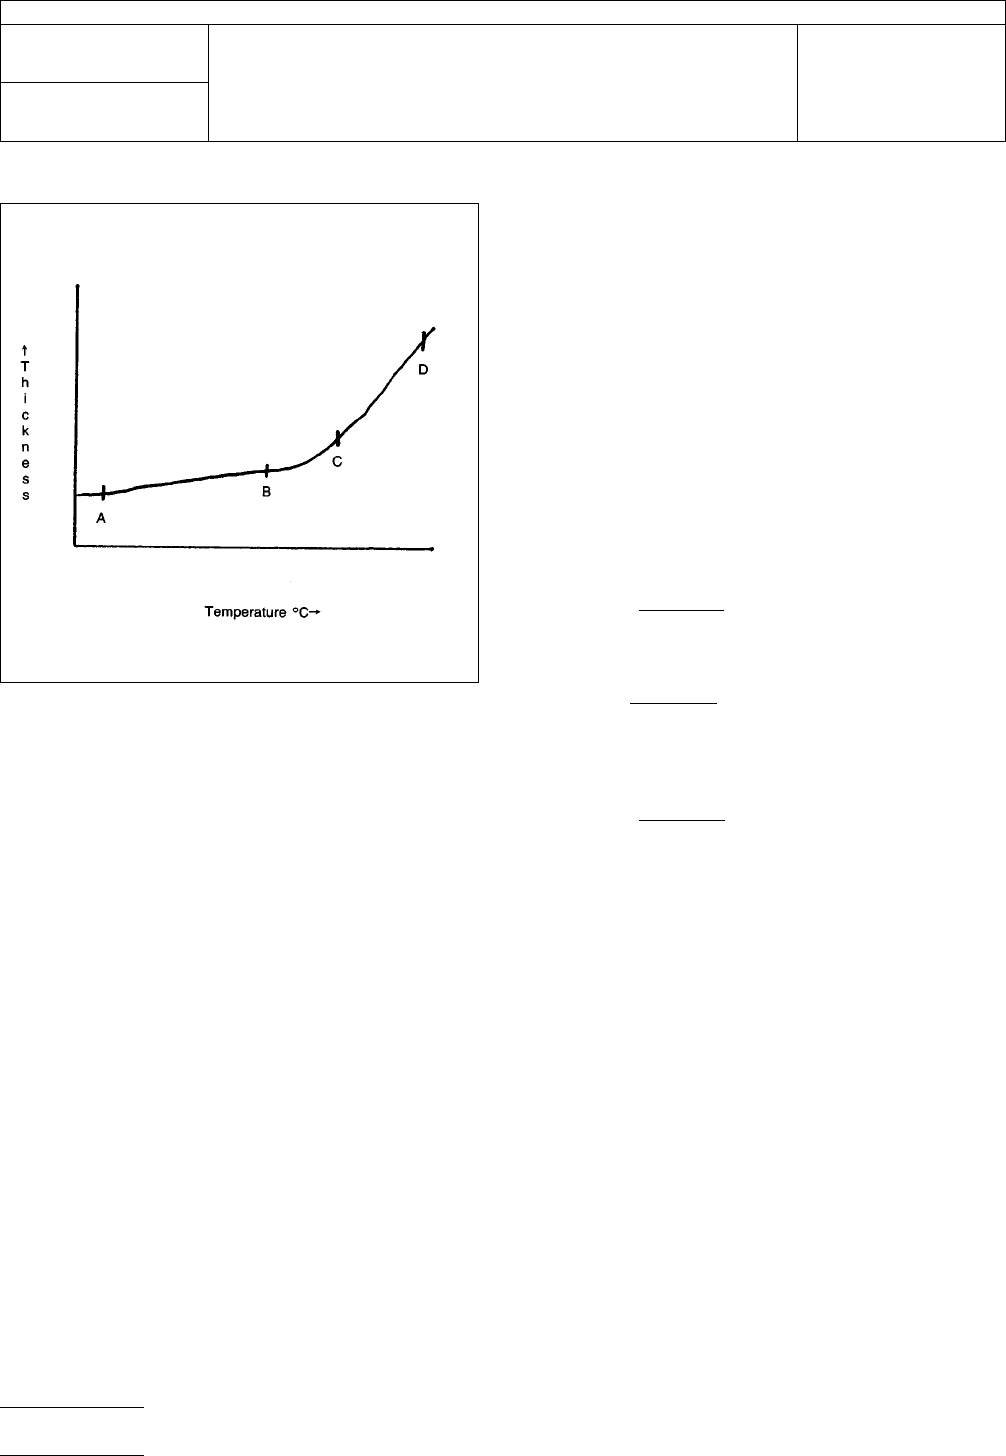
The
data for the scan should resemble the plot as
shown in Figure 1.
5.3.2
From
the TMA plot, record the thickness of the speci-
men as four points: Temperature ‘‘A’’ shall be chosen just
above room temperature, e.g., 25°C [77°F]. Temperatures
‘‘B’’ and ‘‘C’’ shall be chosen such that they are on the linear
portion of the graph, but just below and above the transition
region, respectively. Temperature ‘‘D’’ shall be selected to
represent a temperature of interest, such as a soldering
operation. Unless otherwise specified, Temperature ‘‘D’’ shall
be 250°C [482°F].
5.4
Calculations
5.4.1 Glass Transition Temperature
Determine
the point
at which lines drawn through points A and B and points C and
D will intersect. The temperature at which the tangent lines
intersect is the T
g
.
5.4.2
Coefficient of Thermal Expansion in the Z-Axis
The
CTE shall be calculated over the specified regions and
recorded in units of ppm/°C.
a.
CTE Below the Glass Transition
∝(A − B)=
(t
B
−t
A
)10
6
t
A
(T
B
− T
A
)
b.
CTE Above the Glass Transition.
∝(C − D)=
(t
D
−t
C
)10
6
t
C
(T
D
− T
C
)
c.
CTE from Near Room Temperature to 250°C.
(Or Other Temperature of Interest)
∝(A − D)=
(t
D
−t
A
)10
6
t
A
(T
D
− T
A
)
Where:
T
A
=
Temperature at point A on plot
T
B
=
Temperature at point B on plot
T
C
=
Temperature at point C on plot
T
D
=
Temperature at point D on plot
t
A
=
Thickness at T
A
t
B
=
Thickness at T
B
t
C
=
Thickness at T
C
t
D
=
Thickness at T
D
5.4.3
Percent of Thermal Expansion in the z-axis.
5.4.3.1
Select
the temperature range over which the expan-
sion in percentage shall be determined. The temperature
range from point A to point D is considered most meaningful.
Figure
1
IPC-TM-650
Number
2.4.24
Subject
Glass
Transition Temperature and Z-Axis Thermal Expansion by
TMA
Date
12/94
Revision
C
P
age2of3
电子技术应用 www.ChinaAET.com

5.4.3.2
The
PTE is calculated as follows:
Percent TE = t
D
–t
A
T
O
x
100
Where
t
o
=
Initial thickness (see 5.1.5)
t
D
=
Thickness at Temperature D
t
A
=
Thickness at Temperature A
5.5
Report
5.5.1
Report
the glass transition temperature of each speci-
men.
5.5.2
Report
the TE as CTE in ppm/°C or as PTE in percent-
age, and the temperature ranges over which the TE has been
determined. If specified, report the CTE over the temperature
ranges above and below the T
g
(A-B
and C-D).
5.5.3
Report
the scan rate and final TE temperature if other
than that specified.
6.0 Notes
6.1
Calibration
of the TMA must be carried out according to
the manufacturer’s instructions.
6.2
The
Tg for a given material may be significantly different
when measured by DSC versus TMA. The test equipment
used should be noted after the reported glass transition value,
i.e., 136.4° (DSC) or 132.6° (TMA).
6.3
Most
thermal analysis equipment have the software
capability to determine T
g
and
CTE values; it is recommended
that this approach be used for consistency, provided test
parameters (e.g., temperatures, edge smoothing factors, etc.)
do not conflict with the procedures specified.
6.4
To
improve the accuracy of the test, the thickness
should be at least 0.76 mm [0.030 in] and preferably 1.6 mm
[0.062 in]. If the material thickness to be measured is less than
0.020 inch, a specimen stack-up to at least 0.51 mm [0.020
in] may be used although the test error probability is greatly
increased. A sample of suitable thickness may be prepared
from the prepreg used in the manufacture of the base mate-
rial by laminating and curing as recommended by the supplier.
Specimen thickness should not exceed 2.36 mm [0.093 in] to
avoid variability from thermal gradients occurring within the
specimen.
6.5 Load
selection criteria. Initial load is recommended to be
5g. The load should be adjusted for differences in material
types or specimen configuration in order to assure intimate
contact between the probe, specimen, and stage. Avoid
excess load which may result in penetration or distortion of
the specimen.
6.6
Initial
temperature for starting the scan is determined by
an evaluation of the derivative of the time/temperature curve
for the equipment. Test data is not valid until the time/
temperature curve is stabilized. Refer to operating instruction
of the equipment for additional information.
6.7
Desiccator Conditions
The
Test Methods Task Group
determined that a great majority of test laboratories are unable
to consistently hold the Relative Humidity in a desiccator to
less than 20%. Based on data from participating company lab
management, the lowest practically feasible RH for use with
the affected IPC Test Methods is 30% maximum.
IPC-TM-650
Number
2.4.24
Subject
Glass
Transition Temperature and Z-Axis Thermal Expansion by
TMA
Date
12/94
Revision
C
P
age3of3
电子技术应用 www.ChinaAET.com