IPC-TM-650 EN 2022 试验方法.pdf - 第488页
Z odd,Ch 2 = ( V inc,Ch 2 − V r,TL,Ch 2 V inc,Ch 2 + V r,TL,Ch 2 ) Z TS,Ch 2 where: Z TS,Ch 1 is the characteristic impedance of the transfer stan- dard connected to Ch1 as determined in Step 3 of 5.3.3, Z TS,Ch 2 is the…
and
the characteristic impedance, Z
TS,Ch2
,
of the transfer
standard for Channel 2 (Ch2) using
Z
TS,Ch2
=
(
V
inc,Ch2
− V
r,Ch2
V
inc,Ch2
+ V
r,Ch2
)
Z
std
where:
Z
std
the
characteristic impedance of the reference standard
(the airline).
5.3.4
Transmission Line Measurement Process
The
instrument
setting must be the same as that for 5.3.3. This
process should be done after the measure zone has been
defined (see 5.3.2).
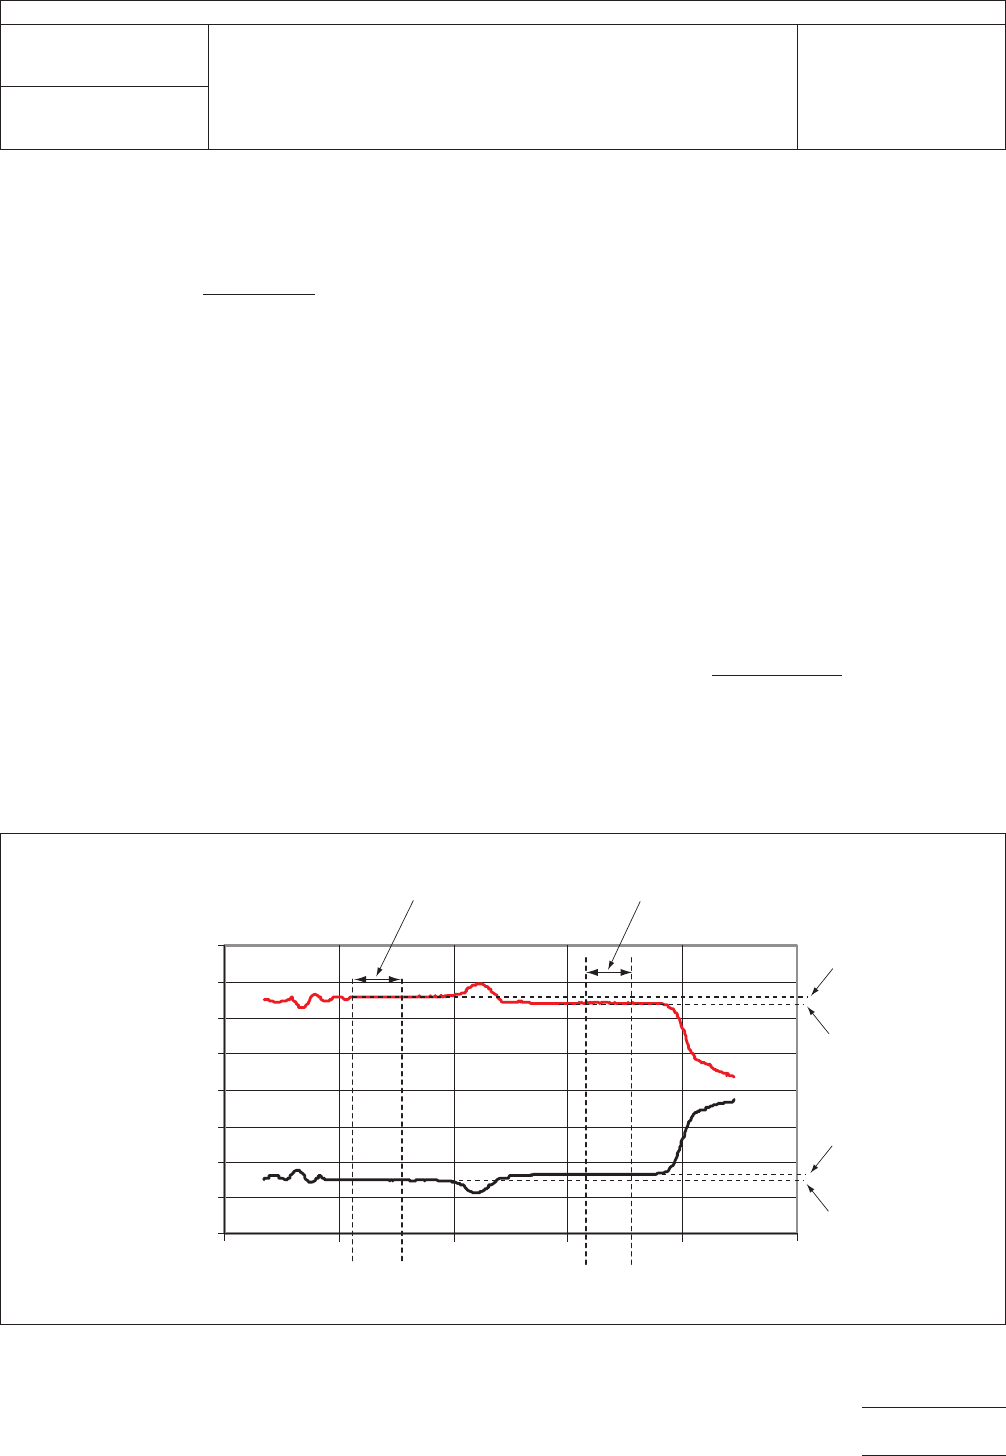
Step
1 –
Probe
the transmission line and measure the aver-
age voltage levels for the high and low states for the two dif-
ferential TDR waveforms, which are labeled V
TS,Ch1,3
,
V
TS,Ch2,3
, V
TL,Ch1
,
and V
TL,Ch2
in
Figure 5-17. There are a total
of four states, two for each of the differential waveforms. Cal-
culate the voltage difference, V
r,Ch1,TL
for
Channel 1 (Ch1)
using:
V
r,TL,Ch1
= V
TS,Ch1,3
− V
TL,Ch1
and
the voltage difference, V
r,Ch2,TL
for
Channel 2 (Ch2) using:
V
r,TL,Ch2
= V
TS,Ch2,3
− V
TL,Ch2
where:
V
TS,Ch1,3
is
the average voltage level of that part of the Ch1
TDR waveform corresponding to the transfer standard (not
the same value as used in 5.3.3, Steps 1 and 2),
V
TS,Ch2,3
is
the average voltage level of that part of the Ch2
TDR waveform corresponding to the transfer standard (not
the same value as used in 5.3.3, Steps 1 and 2),
V
TL,Ch1
is
the average voltage level of that part of the Ch1 TDR
waveform corresponding to the transmission line under test,
and
V
TL,Ch2
is
the average voltage level of that part of the Ch2 TDR
waveform corresponding to the transmission line under test.
Step
2 –
Calculate
the odd-mode impedance, Z
odd,Ch1
,
for
the signal line of the transmission line under test connected to
Channel 1 (Ch1) using:
Z
odd,Ch1
=
(
V
inc,Ch1
− V
r,TL,Ch1
V
inc,Ch1
+ V
r,TL,Ch1
)
Z
TS,Ch1
and
the odd-mode impedance, Z
odd,Ch2
,
for the signal line of
the transmission line under test connected to Channel 2 (Ch2)
using:
IPC-2257a-5-17
Figure
5-17 Differential TDR Measurement of Transmission Line
-0.4
-0.3
-0.2
-0.1
0.0
0.1
0.2
0.3
0.4
Signal (V)
Time
T
ransmission Line
Measurement Zone
t
i,TL
t
f
,TL
V
TL,Ch2
V
TL,Ch1
Ch2
Ch1
V
TS
,Ch2,
3
V
TS
,Ch1,
3
t
i,TS
t
f
,TS
Transfer Standard
Measurement Zone
IPC-TM-650
Number
2.5.5.7
Subject
Characteristic
Impedance of Lines on Printed Boards by TDR
Date
03/04
Revision
A
Page
19 of 23
电子技术应用 www.ChinaAET.com

Z
odd,Ch2
=
(
V
inc,Ch2
− V
r,TL,Ch2
V
inc,Ch2
+ V
r,TL,Ch2
)
Z
TS,Ch2
where:
Z
TS,Ch1
is
the characteristic impedance of the transfer stan-
dard connected to Ch1 as determined in Step 3 of 5.3.3,
Z
TS,Ch2
is
the characteristic impedance of the transfer stan-
dard connected to Ch2 as determined in Step 3 of 5.3.3,
V
r,TL,Ch1
is
the reflected voltage value from Ch1 as calculated
in Step 1,
V
r,TL,Ch2
is
the reflected voltage value from Ch2 as calculated
in Step 1,
V
inc,Ch1
is
the voltage amplitude computed for Ch1 in Step 1
of 5.3.3, and
V
inc,Ch2
is
the voltage amplitude computed for Ch2 in Step 1
of 5.3.3.
Step
3 –
Calculate
the differential impedance, Z
TL,diff
, of
the
transmission line under test using:
Z
TL,diff
= Z
odd,Ch1
+ Z
odd,Ch2
6
Special Considerations and Notes
6.1 General
6.1.1 Quality Control
Measurements
for manufacturing
control are performed to identify and correct process or mate-
rials problems occurring during a manufacturing run, as well
as to assure that a product will perform electrically as
designed. To facilitate the large number of measurements
required in a production environment and to maximize mea-
surement repeatability and reproducibility between different
operators and test systems, it is particularly useful to auto-
mate the TDR calibration and measurement by using com-
puter control. This can be easily achieved using a personal
computer and suitable equipment as described in Section 4.
Examples of parameter variations detectable by TDR, and that
are evidence of process or materials problems, include the
following:
a. Over/under-retching (line width problems).
b. Over/under-plating (line width and thickness problems).
c. Permittivity of the dielectric.
d. Thickness of the dielectric.
e. Degradation from excessive heating and humidity.
f. Damage from excessive pressure during the multilayer pro-
cess.
g. Variations in the laminate glass-to-resin content.
h. Variations in additional coatings applied to the board sur-
face, e.g., solder mask.
Measurement repeatability is described in IPC-TM-650 Test
Method 1.9, Measurement Precision Estimation for Variables
Data. This test method also describes a process to evaluate
the reproducibility of a measurement system for multiple
operators, on different days, and when using different instru-
ments. This evaluation process should be followed and a
precision-to-tolerance ratio acceptable to the customer
obtained.
6.1.2
Single-Ended and Differential Lines
Increased
performance
requirements for computer and other electronic
products often demand even greater signal fidelity, time pre-
cision, and noise immunity, than can be obtained with a
single-ended transmission line. A single-ended transmission
line is a transmission line design consisting of a single signal
conductor placed over one ground plane, as in microstrip, or
between two ground planes, as in stripline. Single-ended lines
may be called unbalanced transmission lines. Differential lines
are used to increase signal fidelity with improved time preci-
sion and increased noise immunity. Differential lines may also
be called balanced or coupled transmission lines. The
required TDR method is different for differential lines.
6.1.3
Environmental Factors
Temperature
and humidity
should be monitored during the test. Long exposures to tem-
peratures and humidities other than standard laboratory con-
ditions (temperature range of 20 °C to 23 °C [68 °F to 73.4 °F]
and relative humidity range of 35 % to 65 %) can impact the
dielectric properties of the materials in the test objects. Fur-
thermore, the electrical characteristics of the TDR, such as
sampler gain, are temperature dependent. Therefore, for the
most repeatable measurements, the TDR instrumentation
should be maintained within the manufacturer recommended
temperature and humidity ranges. Low relative humidity may
result in electrostatic discharge damage to the TDR unit.
6.1.4
Measurement Accuracy and Repeatability
Accu-
racy
and repeatability depend on the impedance of the line
being measured, the type and condition of probes, cables,
sampling head, and the experience of the test technician.
Accuracy is the difference between the most likely measure-
ment and the defined standard. The most likely measurement
is also called the mode of all measurements within a sample
IPC-TM-650
Number
2.5.5.7
Subject
Characteristic
Impedance of Lines on Printed Boards by TDR
Date
03/04
Revision
A
Page
20 of 23
电子技术应用 www.ChinaAET.com

set.
Three times the standard deviation around each side of
the mode is the repeatability.
The ability to resolve a measurement value is fundamental to
the accuracy of any measurement process. The TDR instru-
ment should have sufficient measurement resolution to facili-
tate the accuracy requirements of the measurement method
described herein. The total risetime of the TDR system (includ-
ing cables, probes, etc.) and step aberrations define the
impedance resolution (see 4.1.2).
6.1.5
General Cautionary Statement
TDR
test systems
and associated accessories are precision high frequency
devices. Most TDRs include hardware to protect the static-
sensitive sampling heads. However, operators and mainte-
nance staff should take proper ESD precautions (see manu-
facturer’s recommendations). High frequency cables, because
they typically use solid center conductors, are not as flexible
as typical coaxial cable. Consequently, care should be taken
not to excessively bend and flex the high frequency cables.
The probes used in TDR systems typically use spring-loaded
contacting mechanisms and these should be checked peri-
odically to ensure proper operation. Statistical process control
methods and control charts can provide useful information
regarding the condition of the TDR system and its associated
accessories.
6.1.6
TDR Measured Values
The
units of the values out-
put by the TDR system may be in voltage, reflection coefficient
(commonly called ‘‘rho’’ for the Greek character, ρ, represent-
ing it), and impedance.
6.1.6.1
Impedance
If
the TDR system provides impedance
values directly, no further computation is required to obtain
the characteristic impedance of the transmission line under
test.
6.1.6.2
Reflection coefficient, ρ
If
the TDR unit provides
its output in terms of ρ, then the characteristic impedance of
the transmission line under test must be computed from ρ.
6.1.6.3
Voltage
If
the TDR unit provides its output in term
of voltages, these voltages must first be used to compute the
amplitude of the incident and reflected pulses. Note, all volt-
ages values measured in the test procedures are that of static
voltage levels. These voltage levels are used to compute pulse
amplitudes. The pulse amplitudes, in terms of voltage, are
then used to compute the reflection coefficient of the trans-
mission line under test relative to the TDR, as shown in the
test methods, and these reflection coefficients are then used
to determine the characteristic impedance of the transmission
line under test.
6.2
Calibration
6.2.1 System Verification
The
use of test reference speci-
mens corresponding to different impedance values, for
example 28 Ω,50Ω, and 100 Ω for single-ended transmis-
sion lines and 100 Ω for differential transmission lines, should
be measured according to the user-defined sampling plan
and compared to impedance control limits to ensure the sys-
tem is functioning correctly.
6.2.2
Calibration Artifacts
Air
line standards should be
checked for mechanical tolerances or replaced at regular
intervals. They should be handled with care. Worn out stan-
dards can cause a significant but unknown error than can
exceed 2 Ω. The air line should be compared to another air
line periodically to verify the air line in use has not been dam-
aged. The airline should also be calibrated and documented
periodically (not less than once every two years) by a qualified
certification laboratory and kept in an environment safe from
mechanical shocks, dust and dirt. Dust and dirt degrade the
fine threads of the connection and damage the electrical mat-
ing surfaces. Also, some TDR equipment manufacturers have
requirements for the minimum length of the airlines they rec-
ommend for calibration and standardization. Check with the
manufacturer regarding their calibration requirements. For dif-
ferential impedance of 100 Ω, each channel can be checked
with a 50 Ω airline.
Ideally, the effects of material properties of the air line should
be included in the calculation of the air line impedance
because some of the corresponding transmission line proper-
ties, such as conductor resistance, will be frequency depen-
dent. Also, beadless air lines should be used because their
geometries can be readily measured whereas the geometries
of beaded air lines are more difficult to measure.
6.3
Measurement System
6.3.1 Bandwidth/Risetime Resolution
The
frequency
components of the TDR step are approximately related to the
bandwidth by:
BW
−3dB
≈
0.35
t
d
IPC-TM-650
Number
2.5.5.7
Subject
Characteristic
Impedance of Lines on Printed Boards by TDR
Date
03/04
Revision
A
Page
21 of 23
电子技术应用 www.ChinaAET.com