Operating Instructions_VF335_en.pdf - 第159页
6|Function description 6.8.1 The bottom toolbar of the process recorder The following buttons are located in the bottom toolbar: By clicking on this button you can start recording. During recording, the button changes …
6|Function description
6.8 The process recorder
The process recorder is used to record readings and to graphically display the re-
corded measurement results. You can filter out individual readings to improve clar-
ity. Readings are saved automatically and can later be retrieved and printed for
comparison.
NOTE
Are any changes possible?
The [Process recorder] user rights are required access this dialog. Settings can only be
displayed if no name and password are logged in. In this case, press the [ESC] key on
your keyboard, or click on the [Cancel] button when a password is required.
Open the [Process recorder] dialogue
ü Opening a dialogue:
a) Click on the
button in the top toolbar of the start dialogue.
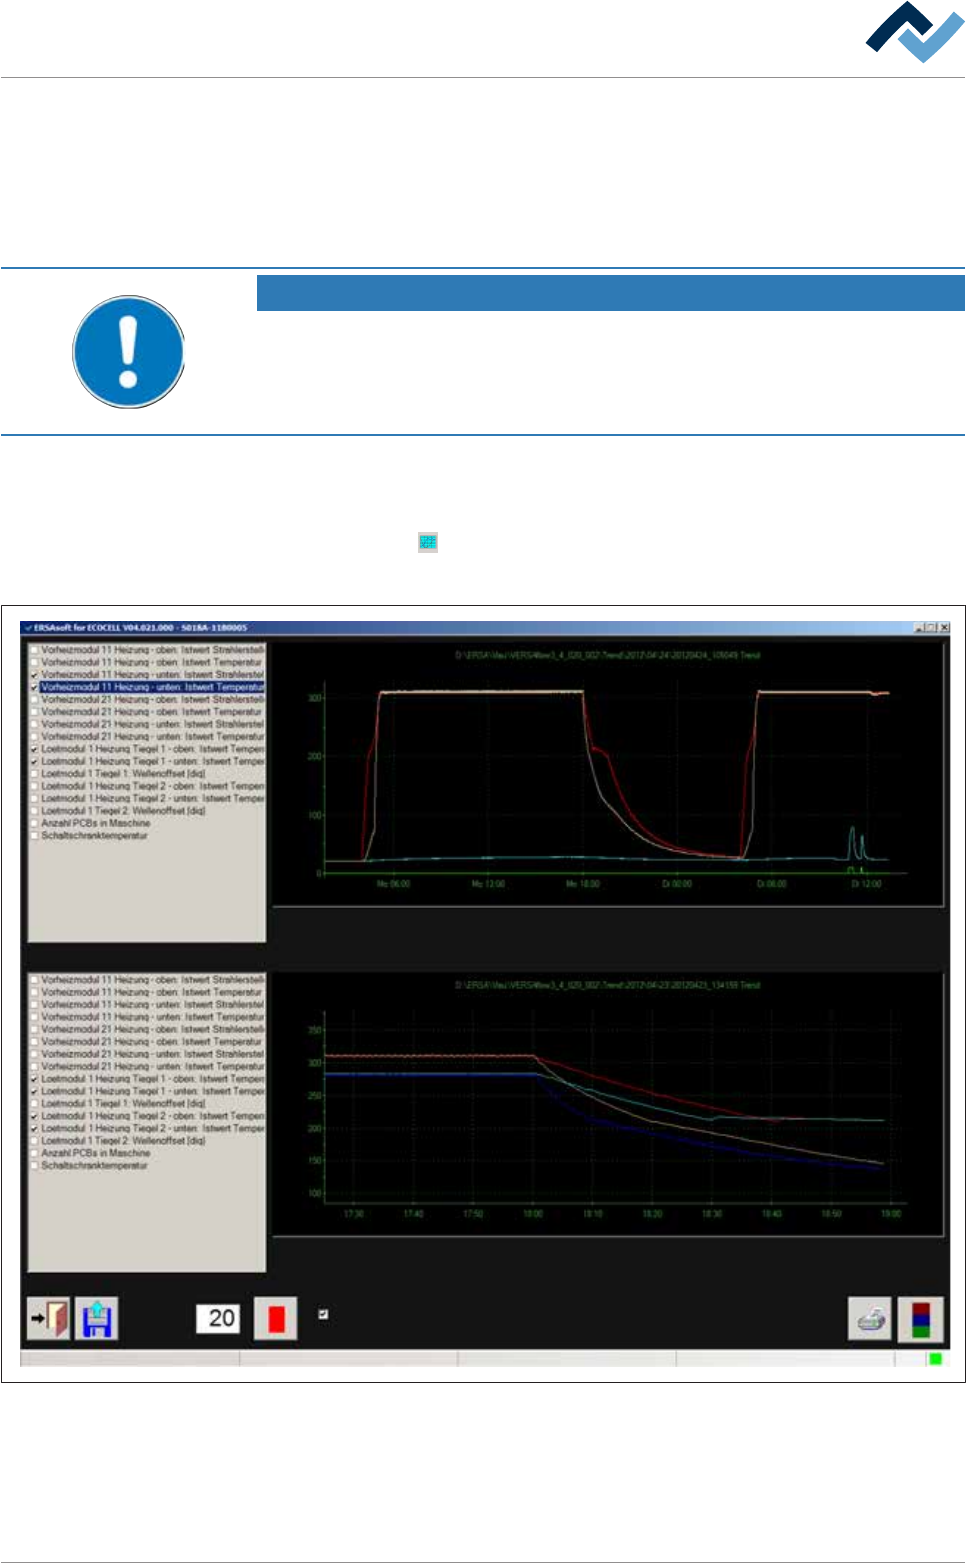
ð The [Process recorder] is opened:
User ersa
Interval
Zoom in
Maintenance mode
Fig.31: The [Process recorder] dialog. Depending on your machine equipment, this illustration may differ from the actual display.
Ersa GmbH Operating Instructions_VF335_en|Rev. 14|30/11/2017 158/695
6|Function description
6.8.1 The bottom toolbar of the process recorder
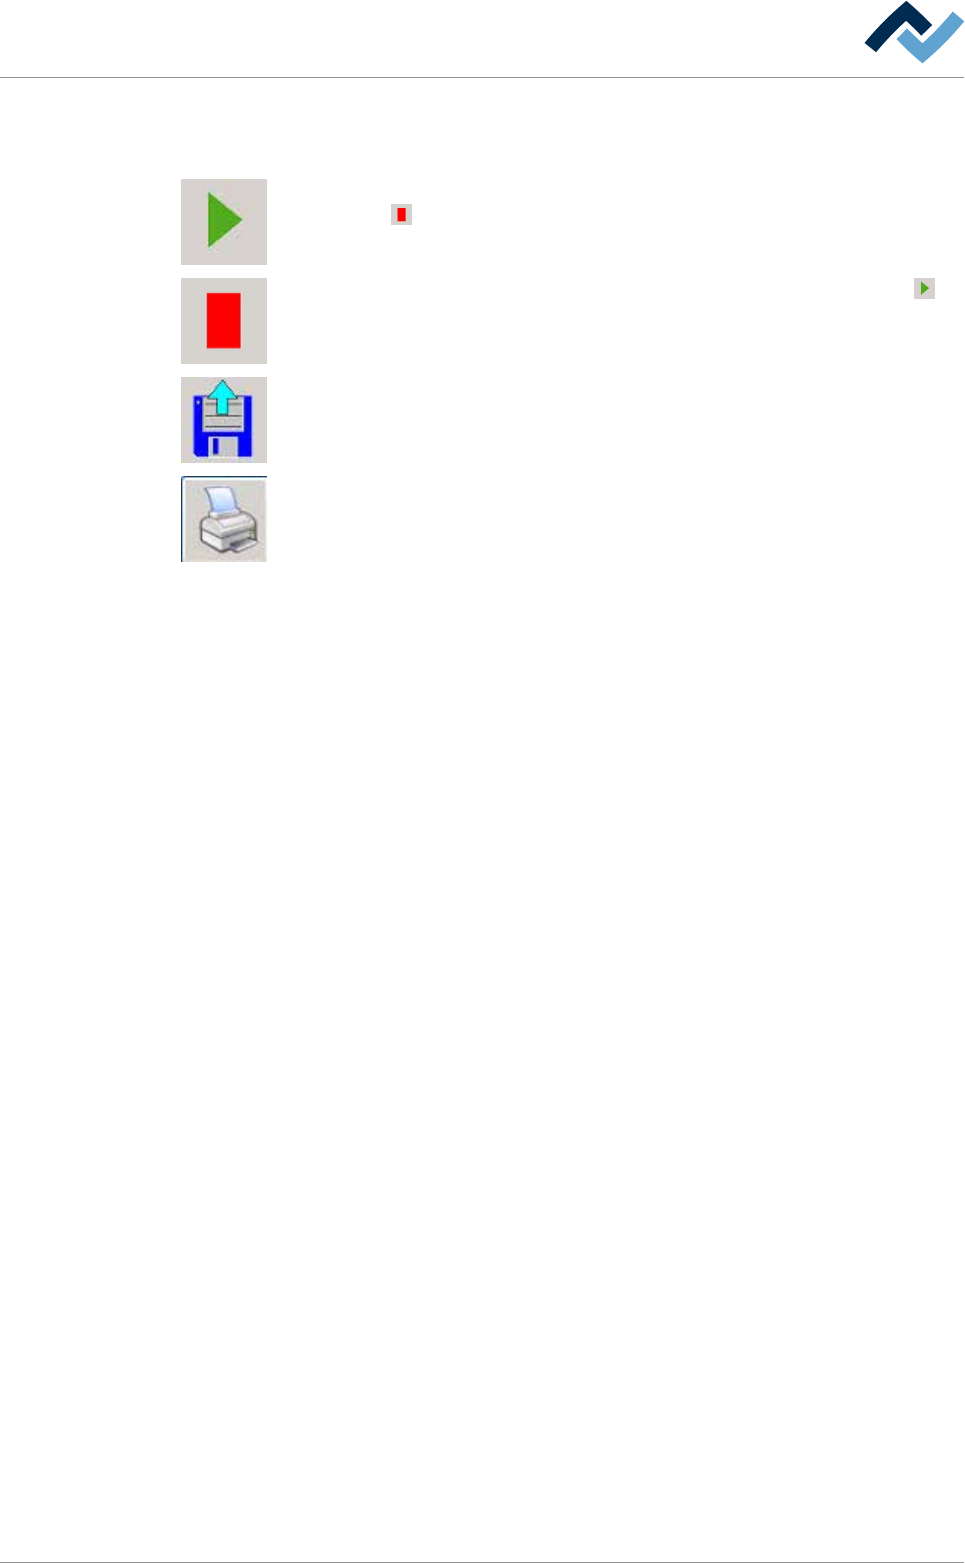
The following buttons are located in the bottom toolbar:
By clicking on this button you can start recording. During recording, the button
changes into
.
By clicking on this button you can stop recording. The button will change into .
By clicking on this button you can import data from a previously recorded process
into the bottom frame of the process recorder.
By clicking on this button you can print the process data.
Ersa GmbH Operating Instructions_VF335_en|Rev. 14|30/11/2017 159/695
6|Function description
6.8.2 The top frame of the [Process recorder] dialog
User ersa
maintenance mode
Interval
Zoom in
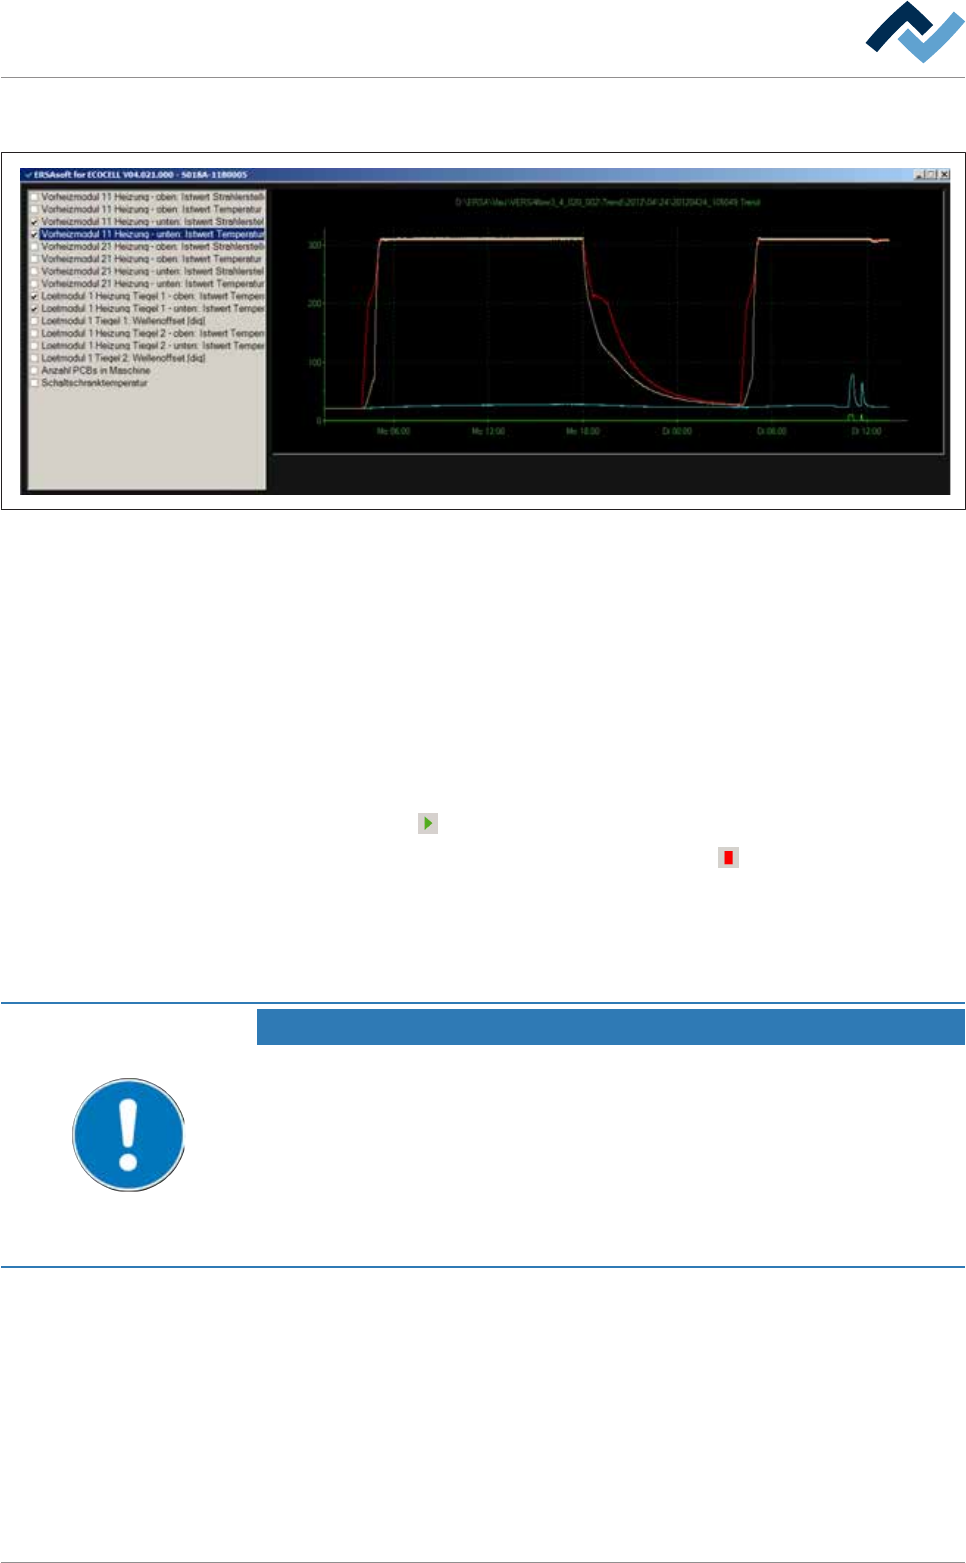
Fig.32: The [Process recorder] dialog. Depending on your machine equipment, this illustration may differ from the actual display.
Recording and graphically displaying readings
The window on the left reflects the machine configuration. This window provides
checkboxes for the selection of the values to be displayed. The selected, current
readings are graphically displayed in the right window.
ü Recording and graphically display readings:
a) In the left window, select which readings are to be displayed.
b) In the bottom toolbar, click on the input field [Interval] and enter a value for
the measurement interval in [seconds].
c) Click on the
button.
ð The recording starts. The button will change into
. The readings are then
graphically displayed in the top frame. At the same time, the readings are auto-
matically saved in a file. Once a certain file size is exceeded, the file is automat-
ically closed and a new one is created.
With regard to this, please read Chapter The [File paths] editing dialogue .
NOTE
Where can I find the data?
The files are automatically named by the system in chronological order and stored in
appropriate folders and subfolders: [Year]\[Month]\[Filename.trend]. This way, they
can be reassigned at any time. The file name itself occurs in the format:
2009_05_11_06_51_49.trend - The file was created on 11/05/2009 at 06.51 49 sec.
The maximum file size is about 150 kB. The shorter the measurement interval is set in
the [Interval] input field, the faster the maximum file size is reached and the more
files are created.
Zoom function
ü Viewing the graphic in a higher resolution:
a) Click on the [Zoom in] checkbox.
ð The zoom function is enabled.
b) Click with the mouse on the desired section of the graphic and, while pressing
the mouse button, drag over the desired area.
Ersa GmbH Operating Instructions_VF335_en|Rev. 14|30/11/2017 160/695