RS-1_instruction manual.pdf - 第877页
Pa r t 2 Det ai l ed Des c r i pti on o f Ea c h Fu nc ti on Chapte r 1 1 S el f - diagnosis Func ti on 11 - 19 The s et head i s m oved ont o the v acuum cal ibr ati on and the a tt aine d v acuum sta tus is m easur ed …
Part 2 Detailed Description of Each Function Chapter 11 Self-diagnosis Function
11-18
(2) Setting method
1) Head selection
The default is “F-continuous measurement”/”R-continuous measurement”, being a status
where no head can be selected. However, if you remove the check mark from
“F-continuous measurement” or “R-continuous measurement” or remove the check mark of
continuous measurement by Select device, a head can be selected.
After selecting a device to be measured, select a head for measurement in the check box
provide in the setting head group. You can select multiple heads to be measured at a time.
(However, it is impossible to select a unit for which “No use” is set in “Device enable” in
Machine setup.)
2) Operation
A value can be obtained automatically by performing operations as instructed.
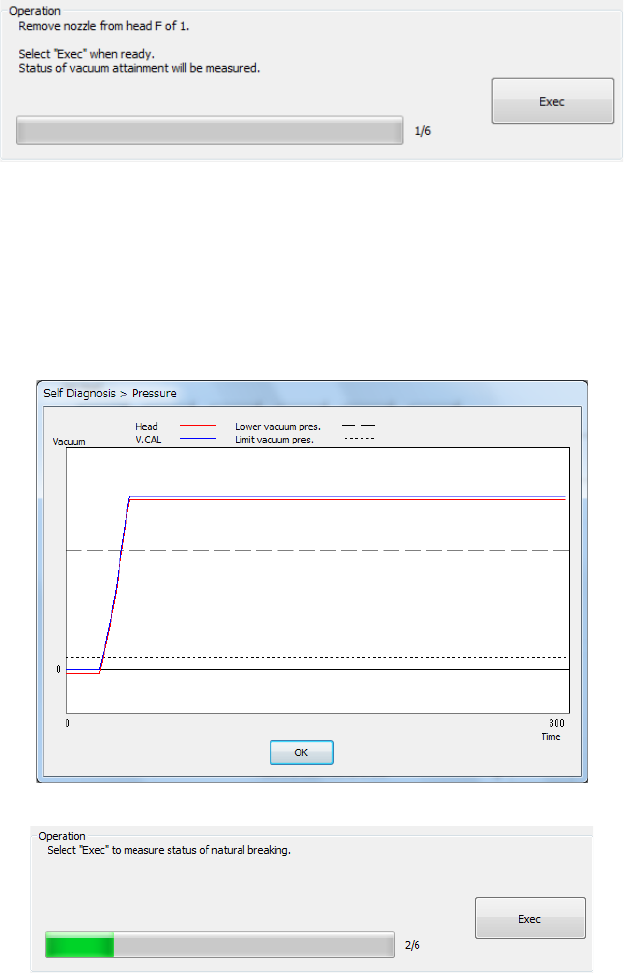
(3) Measurement sequence
The set head is moved onto the vacuum calibration and the attained vacuum status is
measured 3 times.
- The mean values between the 2
nd
and 3
rd
measurements are displayed.
- The graph of the pressure value displayed after measurement shows the data of the 3
rd
measurement.
- Press <Exec>.
Part 2 Detailed Description of Each Function Chapter 11 Self-diagnosis Function
11-19
The set head is moved onto the vacuum calibration and the attained vacuum status is
measured 3 times.
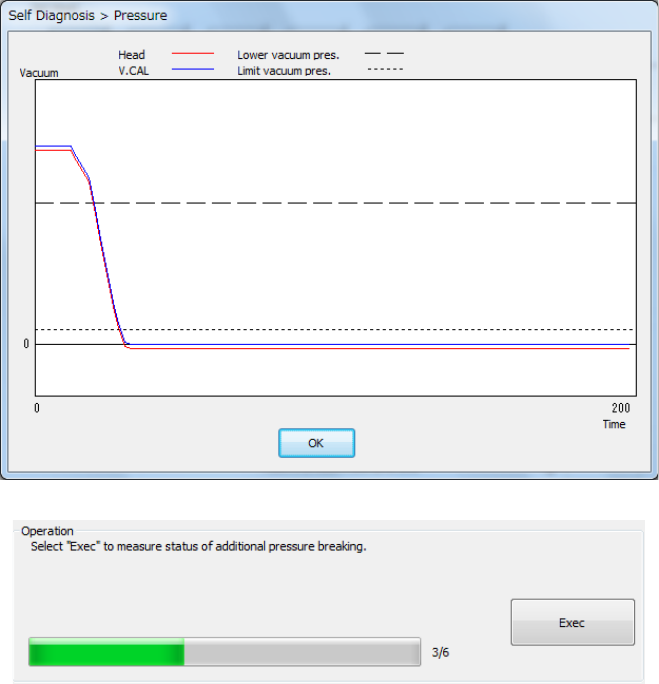
The set head is moved onto the vacuum calibration and the natural break status is measured 3
times.
- The mean values between the 2nd and 3rd measurements are displayed.
- The graph of the pressure value displayed after measurement shows the data of the 3rd
measurement.
- Press <Exec>.
Part 2 Detailed Description of Each Function Chapter 11 Self-diagnosis Function
11-20
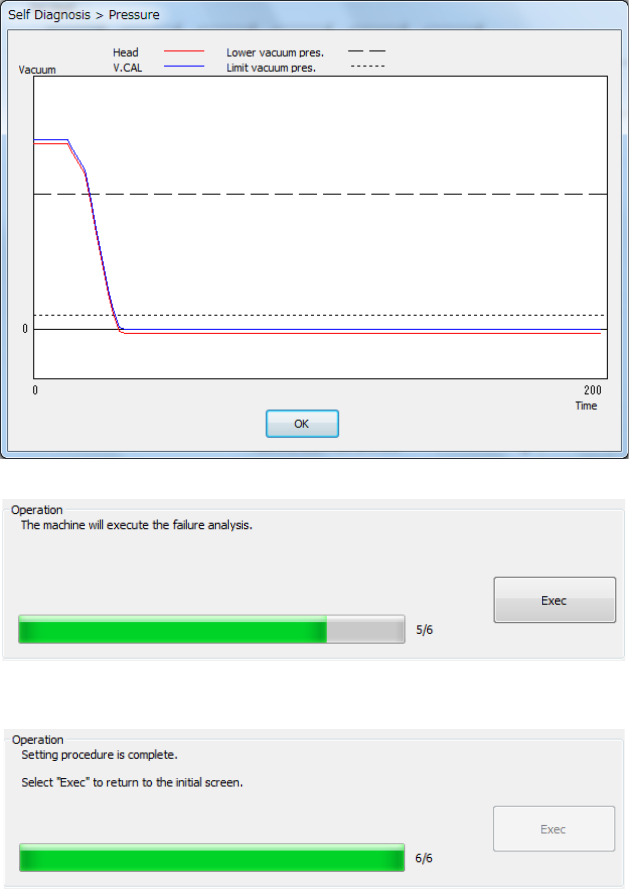
The set head is moved onto the vacuum calibration and the pressurized break status is
measured 3 times.
- The mean values between the 2nd and 3rd measurements are displayed.
- The graph of the pressure value displayed after measurement shows the data of the 3rd
measurement.
- Press <Exec>.