semi合集-English.pdf - 第3696页
SEMI PR8-0703 © SEMI 2003 26 RELATED INFORMATION 3 EQUIPMENT DATA LIFECYCLE NOTICE: This related information is no t an official part of SEMI PR8. This related information is not intended to modify or supersede the offic…

SEMI PR8-0703 © SEMI 2003 25
R2-1.1.4 Fault Detection and Classification (FDC)
R2-1.1.4.1 Scope of FDC Systems
R2-1.1.4.1.1 FDC systems are data-intensive, time-
critical applications. They typically collect process
variable, event, and exception/alarm data from the
equipment as it’s produced, and analyze the results,
looking for faults that indicate or could lead to mis-
processing. If such a condition is detected, an FDC
system may send a control signal to the equipment
through the host, to abort processing before further
material is lost.
R2-1.1.4.2 Timeliness of FDC Data
R2-1.1.4.2.1 FDC applications can be very time
critical, sometimes in the sub-second range. As the
time criticality of FDC applications becomes more
acute, the ability of this interface to support these
applications will be severely tested.
SEMI PR8-0703 © SEMI 2003 26
RELATED INFORMATION 3
EQUIPMENT DATA LIFECYCLE
NOTICE: This related information is not an official part of SEMI PR8. This related information is not intended to
modify or supersede the official proposed standard. Determination of the suitability of the material is solely the
responsibility of the user.
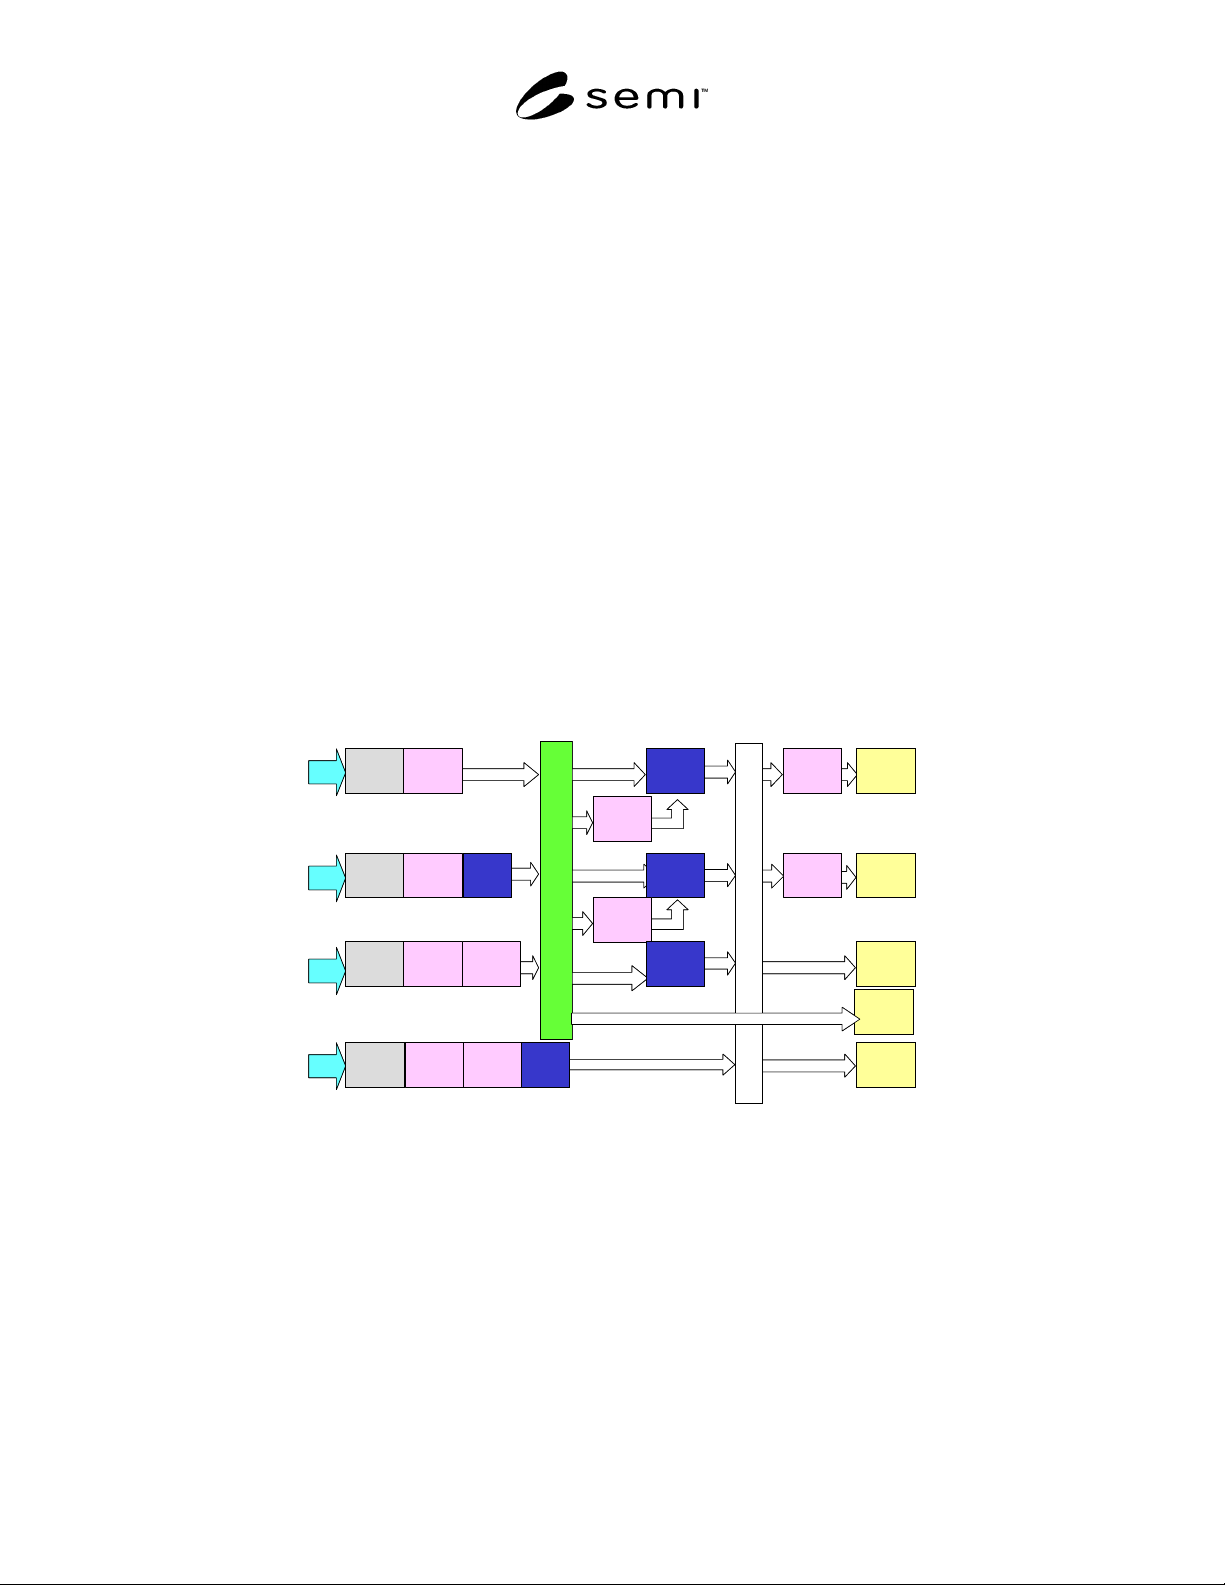
R3-1 The Data Life Cycle
R3-1.1 The data originating from the equipment may be processed or converted into many forms depending on how
the data is to be utilized. The data obtained through the EDA interface will be processed by data consumers and
may be converted into a command that initiates certain control sequences, or perhaps converted into an STS or EPT
report. Other data obtained through the EDA interface will be linked together with JOB information (e.g. CJ, PJ,
carrier ID, slot ID, etc….) and used as process data. For APC purposes, process data and equipment health
monitoring data may be linked together to yield suitable APC/FDC engine input. The examples below show the
data life cycle steps from data generation to its consumption. The data through the same EDA interface can have
different data performance attributes such as data resolution depending on data, and may have different data life
cycle scenarios.
R3-1.1.1 Data Life Cycle Schematic
R3-1.1.1.1 The data life cycle schematic shows not only data acquisition but also utilization in many ways. The life
cycles shown in the diagram are all possible life cycle scenarios. Although this standard does not define all of the
life cycle scenarios (only scenarios #1 and #3), it is important this standard does not preclude other possible
scenarios such as data query and application calls. The A interface of an equipment may have all of these data life
cycle models depending on data utilization or applications.
1
2
3
4
re portStorage
Gene
-ration
Assort
-ment
1
re port
Gene
-ration
Assort
-ment
2
Storage
Assort
-ment
1
Gene
-ration
Storage
Assort
-ment
1
Assort
-ment
2-2
Storage
Assort
-ment
2-1
Assort
-ment
2
re port
Assort
-ment
2
re portStorage
Gene
-ration
Assort
-ment
2
Assort
-ment
1
Higher Level Interface
EDA Interface
re po rt
1
2
3
4
re portStorage
Gene
-ration
Assort
-ment
1
re port
Gene
-ration
Assort
-ment
2
Storage
Assort
-ment
1
Gene
-ration
Storage
Assort
-ment
1
Assort
-ment
2-2
Storage
Assort
-ment
2-1
Assort
-ment
2
re port
Assort
-ment
2
re portStorage
Gene
-ration
Assort
-ment
2
Assort
-ment
1
Higher Level Interface
EDA Interface
re po rt
Figure R3-1
The Data Life Cycles
SEMI PR8-0703 © SEMI 2003 27
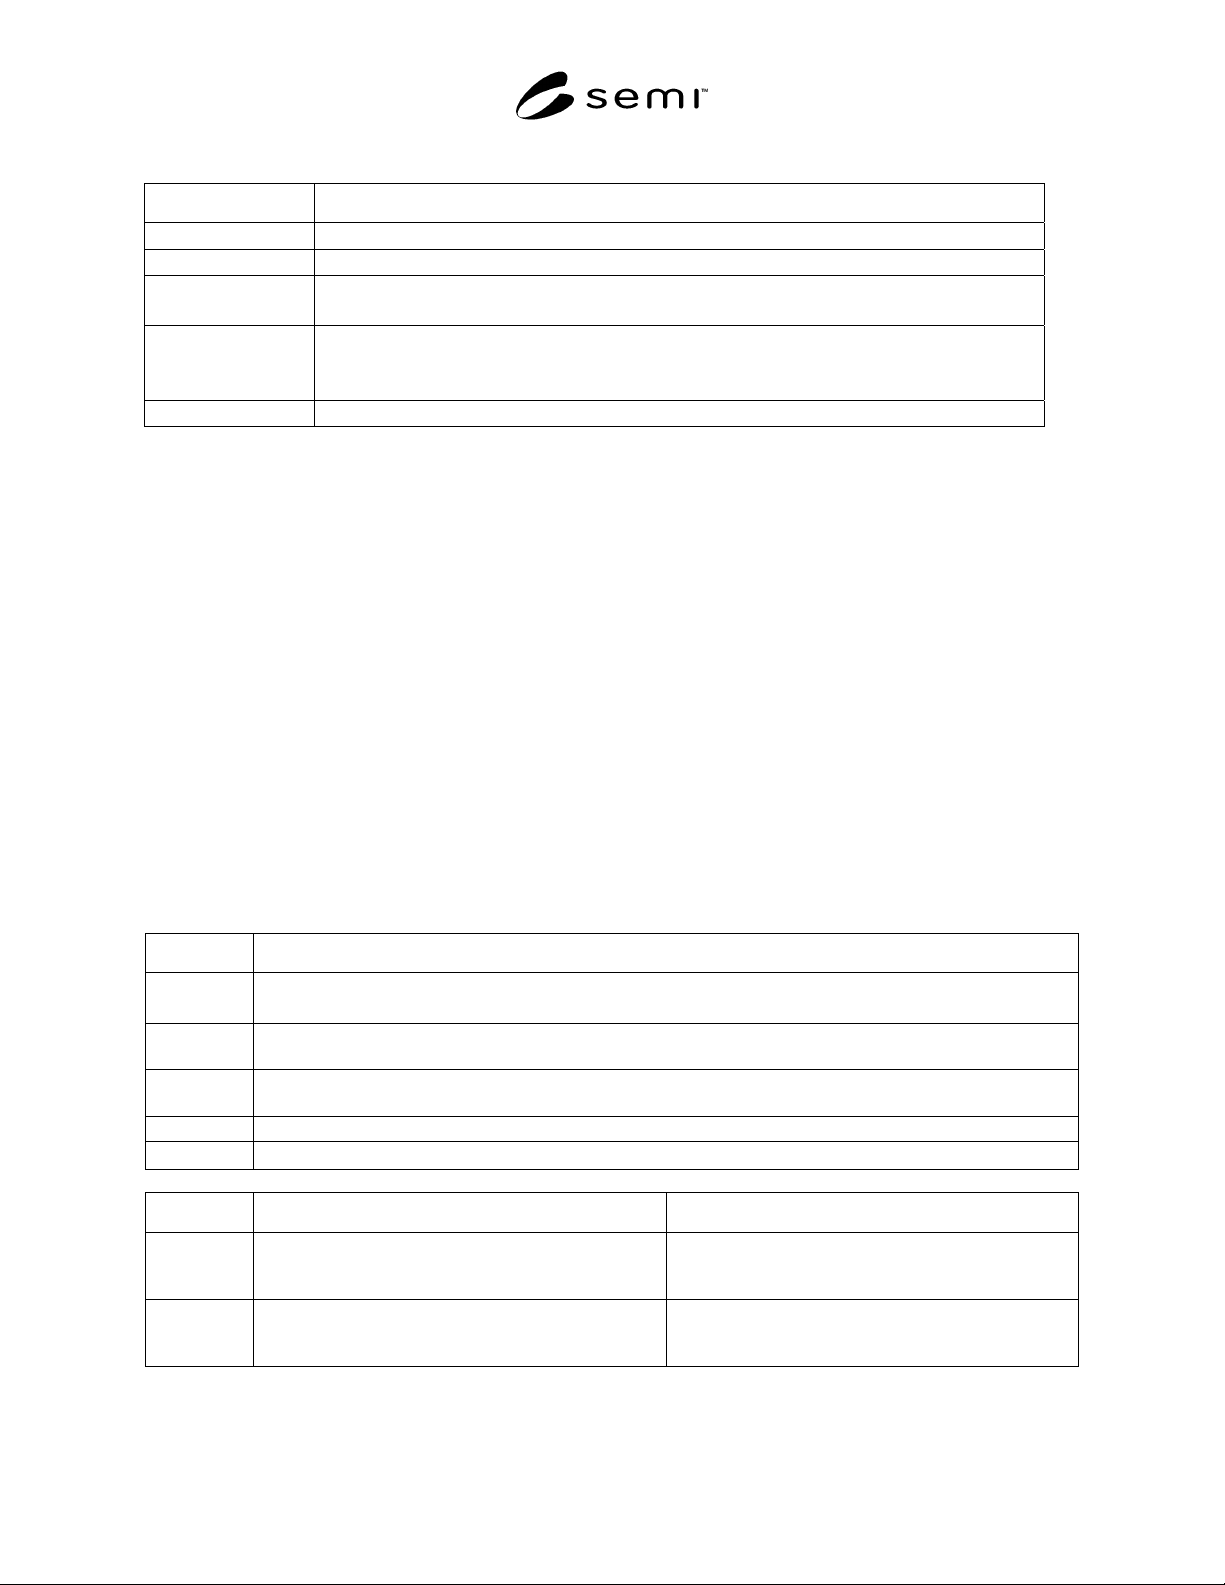
Table R3-1 Possible Data Life Cycle Scenarios
Steps Description
Generation Generation of data which can be reported out of the equipment.
Assortment 1 Least value adding processing for data handling; give tag such as name or index or time stamp.
Assortment
2, 2-1, 2-2
Make collected data be easily utilized by applications; linkage with other data or any value
adding data processing (calculation of average, max. or min.).
Storage Store EE data for a certain period of time.
May provide query function from the higher level applications.
This includes storage of value added data created by assortment 2.
Report Output by a certain application to viewers or in the form of files.
R3-1.1.1.2 The form of the data may vary depending on how much capability the equipment has to process the data,
or on the resolution that the application requires.
R3-1.1.1.3 Above data life cycle schematic show that:
1) The data resolution requirement varies with data itself, the application, or the system.
• Detailed equipment data such as detailed equipment event data (DEE)
• Data associated with JOB information
• Processed and value added data
2) Data acquisition method may vary.
• Trace data requirement
• Query (this is not the scope of this standard)
• Subscription by application
R3-1.1.2 Example of Data Life Cycle for Low Level Data such as Detailed Equipment Data (DEE)
R3-1.1.2.1 This example describes how the Calculation of equipment utilization Data for EPT and STS may be
generated from low level equipment data.
Step Description
Assortment
1
Input data is I/O event data of sensors and actuators.
Give name and time stamp.
Assortment
2-1
From the consequence abstract the sequence start and stop events. Link with equipment structure model or
JOB information.
Assortment
2-2
Calculate necessary indices.
Storage Store calculated data. Provide subscription capability to show past data.
Report Report or show.
Scenario Function/application in equipment Higher level applications
Scenario 1 Give elementary data its name and time stamp. Detect necessary sequence starts and stops so as to
calculate necessary indices. Report formation
function.
Scenario 4 Calculation for EPT/STS embedded in equipment and
put out data.
Application acquires the result of equipment
utilization calculation, and this application only has
viewer output function.