semi合集-English.pdf - 第7352页
SEMI MF1391-0704 © 2004 4 4 reference slices shall be equal to with in ± 0.5 mm (see Section 10.5). 9.2.4 Surface area large enou gh such that with respect to the holders no in cident radiation can bypass either the test…

SEMI MF1391-0704 © 2004 3
5.3.5 FWHM — acronym for full width at half
maximum, the width of the absorbance band at half its
magnitude as measured from the baseline.
5.3.6 reference spectrum, n — the spectrum of the
reference specimen.
5.3.6.1 Discussion — For true double-beam
instruments, it is obtained directly with the reference
specimen in the sample beam and the reference
(second) beam empty. For FT-IR and other single-
beam instruments, it is the result of ratioing the single-
beam spectrum of the reference specimen to the
background spectrum (see Section 5.3.1).
5.3.7 sample spectrum, n — the spectrum obtained
when the sample specimen is placed in the infrared
beam.
5.3.7.1 Discussion — For true double-beam
instruments, it is obtained directly with the sample in
the sample beam and the reference (second) beam
empty. For FT-IR and other single-beam instruments, it
is the result of ratioing the single-beam spectrum of the
sample to the background spectrum (see Section 5.3.1).
6 Summary of Test Method
6.1 At room temperature, test slices are prepared that
are polished on both sides to a nominal thickness of 2.0
mm. At cryogenic temperatures, the thickness of the
test slices can range from 2.0 to 4.0 mm.
6.2 A reference slice of known low carbon content (see
Section 3.2) is prepared in the same manner.
6.3 After verifying that the instrument is suitably set up,
transmittance spectra of the sample and reference are
obtained over the range from 700 to 500 cm
−1
(14.3 to
20.0 µm) on a double-beam dispersive or single-beam
Fourier Transform Infrared (FT-IR) spectrophotometer
in accordance with manufacturer's instructions.
6.4 Absorbance spectra are derived from these
transmittance spectra and a carbon-only spectrum is
obtained as the difference between the two absorbance
spectra.
6.5 A baseline is drawn between the regions on both
sides of the carbon peak on this difference absorbance
spectrum, and absorbance values of both the peak and
baseline are recorded.
6.6 The absorbance peak height is taken as the
difference between these two values. This peak height,
corrected for sample thickness, is multiplied by a
constant to calculate the substitutional carbon concen-
tration. Two constants are used, one for measurements
at room temperature (300 K), and one for measure-
ments at cryogenic temperatures (below 80 K).
7 Apparatus
7.1 Infrared Spectrophotometer — Either a dispersive
(computerized or non-computerized) or a Fourier trans-
form (FT-IR) spectrophotometer may be used. The
resolution of the spectrophotometer must be at least 2
cm
−1
at room temperature, or 1 cm
−1
at cryogenic
temperatures, over the range from 500 to 700 cm
−1
for
either dispersive or Fourier transform infrared spectro-
photometers. The total operating range of the
spectrophotometer shall include the range from 500 to
2000 cm
−1
.
7.2 Micrometer Caliper — or other instrument, capable
of measuring the thickness of the specimens to an
accuracy of 0.005 mm.
7.3 Equipment and Materials for Slicing and Polishing
Silicon — to a final thickness tolerance of 0.005 mm or
less, and a total thickness variation of 0.01 mm or less.
7.4 Thermometer — or other instrument capable of
measuring the temperature of the sample chamber (for
room temperature measurements) or the sample holder
(for cryogenic temperature [below 80 K]
measurements) to within ± 2°C.
7.5 Calcium Fluoride Crystal (CaF
2
), cut to nominal
thickness of 5 mm.
8 Sampling
8.1 Unless otherwise specified, a silicon slice used for
the carbon test is to be measured at the nominal slice
center.
9 Test and Reference Specimens
9.1 A single crystal slice of about 2-mm thickness must
be used at room temperature, and a slice of 2.4 to 3.5-
mm thickness is preferable at cryogenic temperatures.
9.2 Both the test and reference specimens must be
carefully shaped to the following criteria:
9.2.1 Thickness variation over the measurement area
shall be 0.005 mm or less.
9.2.2 Surface preparation shall be identical,
9.2.3 Thickness equality shall meet one of the
following:
9.2.3.1 When the measurement is made with double
beam simple dispersive infrared spectrophotometers,
the final thickness of test and reference slices shall be
equal to within ± 0.01 mm (see Section 10.4).
9.2.3.2 When the measurement is made with computer
assisted double-beam dispersive or single-beam FT-IR
spectrophotometers, the final thickness of test and

SEMI MF1391-0704 © 2004
4
4
reference slices shall be equal to within ± 0.5 mm (see
Section 10.5).
9.2.4 Surface area large enough such that with respect
to the holders no incident radiation can bypass either
the test or reference specimen.
9.3 The reference specimen must be selected from float
zone silicon with a minimal substitutional carbon
concentration and a carrier concentration such that there
is no measurable free carrier absorption of infrared
radiation in the range from 500 to 2000 cm
−1
.
NOTE 1: A satisfactory method of selecting usable reference
specimens is to prepare polished slices of equal thickness
from many different low-carbon silicon crystals produced by
the float zone method, and then compare them to each other in
an infrared radiation (IR) spectrophotometer. The selection
must be carried out at cryogenic temperatures for cryogenic
measurements. The specimen(s) showing the highest relative
transmittance at 605 cm
−1
at room temperature, or at 607.5
cm
−1
at cryogenic temperatures (below 80 K), can be used as
reference specimen(s).
9.4 Both test and reference specimens must have
resistivity greater than 3 Ω·cm for p-type silicon and
greater than 1 Ω·cm for n-type silicon.
10 Procedure
10.1 Instrumental Checks
10.1.1 With reference to the transmittance spectrum,
establish the 100% transmittance line to measure the
stability and the noise level by one of the following
methods.
10.1.1.1 For double-beam instruments, record the
transmittance spectrum with both the sample and
reference beams empty.
10.1.1.2 For single-beam instruments, record the trans-
mittance spectrum as the ratio of two spectra taken with
the sample beam empty. Take the two spectra at times
separated by at least the time required to load samples
and take two sequential spectra.
10.1.1.3 In both cases, plot the transmittance spectrum
over the wavenumber range covering 500 to 700 cm
−1
to obtain the 100% line.
10.1.1.4 If the 100% transmittance line is 100 ± 0.5%
over the entire range, continue to the next step.
Otherwise, adjust or repair the instrument so as to meet
this criterion.
10.1.2 Establish the 0% transmittance line, (T).
10.1.2.1 For double-beam dispersive (DIR)
instruments, record the transmittance spectrum between
700 and 500 cm
−1
with the sample beam blocked.
10.1.2.2 For FT-IR instruments, collect a background
spectrum with the beam empty. Next, collect a
spectrum with a CaF
2
crystal wafer, 5-mm thick, in the
beam. Obtain the spectrum that is the ratio of the CaF
2
spectrum to the background spectrum, and plot the
percent transmittance spectrum between 700 and 500
cm
−1
.
10.1.2.3 In either of these cases, the 0% transmittance
must not exceed ± 0.5% over the range between 700
and 500 cm
−1
.
10.1.2.4 Alternatively, for FT-IR instruments, plot the
single-beam background spectrum (empty beam only)
from 1000 to 200 cm
−1
. The recorded energy in a
region where the detector is known to give a zero
response (below 300 cm
−1
for most detectors) must not
be greater than 1.0% of the maximum signal in this
region.
4
,
5
10.1.3 To determine the mid-scale linearity of the
instrument obtain a spectrum of the silicon reference
specimen over the wavenumber range from 1600 to
2000 cm
−1
. If the value of the transmittance is not 53.8
± 2% over this wavenumber range, align the sample at a
small angle to the axis of the incoming IR beam, in
order to minimize undesirable reflections between the
silicon surfaces and the spectrometer components.
NOTE 2: This angle may be determined by initially placing
the silicon slice normal to the axis of the incoming beam, and
then gradually tilting the specimen while repeatedly obtaining
the transmittance spectrum above 1600 cm
−1
. The optimum
angle is typically less than 10°.
10.2 Measure and record the thicknesses of the test and
reference specimens to within ± 0.005 mm, at their
centers.
10.3 For room temperature measurements, measure and
record the temperature of the sample chamber to ± 2°C.
At cryogenic temperatures (below 80 K), measure and
record the temperature of the sample holder.
10.4 Obtain the carbon-only absorbance spectrum by
one of the following methods (see Figure 1):
4 Chase, D. B., Applied Spectroscopy 38(4), 491–494 (1984).
5 Hoffman, P., and Knozinger, E., Applied Spectroscopy 41(8),
1303–1306, (1987).
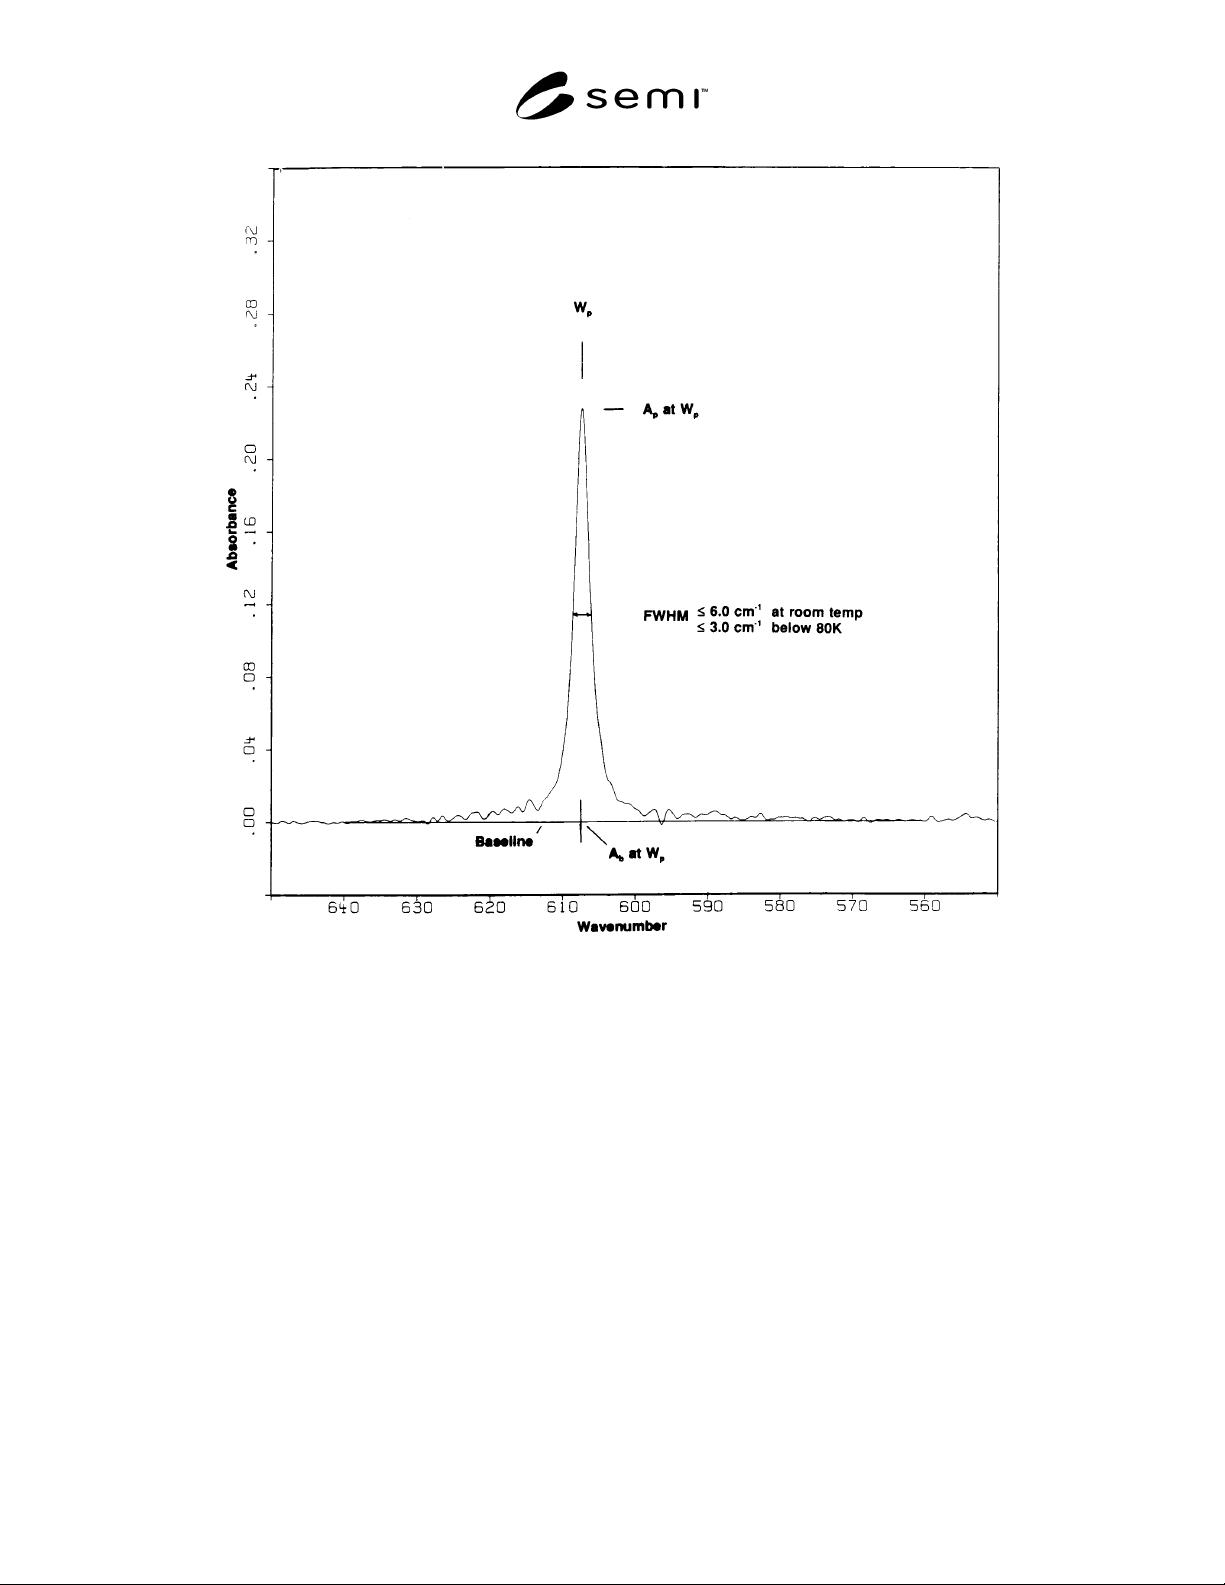
SEMI MF1391-0704 © 2004 5
Figure 1
Carbon-Only Absorbance Spectrum
10.4.1 For double-beam instruments, position the
sample specimen in the sample beam and the reference
specimen in the reference beam and collect and plot the
carbon-only absorbance spectrum over the range of at
least 700 to 500 cm
−1
. Use a resolution of 2 cm
−1
or
better, at 605 cm
−1
, at room temperature, and a
resolution of 1 cm
−1
or better, at 607.5 cm
−1
, at cryo-
genic temperatures (below 80 K). Take spectra with the
sample chamber in a vacuum, dry nitrogen, or dry air.
Position the specimen so that the infrared beam passes
through the center of the specimens.
10.4.2 For single-beam (computer-assisted)
instruments, first collect a background spectrum with
the beam empty, then collect sample and reference
spectra sequentially under the same conditions as given
in Section 10.4.5. Ratio the sample and reference
spectra to the background and convert to absorbance.
Multiply the reference absorbance spectrum by the ratio
of the test specimen thickness to the reference specimen
thickness and subtract this normalized absorbance from
the test specimen absorbance to obtain the carbon-only
spectrum.
NOTE 3: If the user has interactive arithmetic capability,
subtract the reference absorbance spectrum from the sample
absorbance spectrum in a ratio that provides the best flatness
of the non-peak baseline between 560 and 640 cm
−1
. This
eliminates the 2-phonon band due to silicon and gives a
carbon-only spectrum.
10.5 With regard to the plot of the carbon-only
absorbance spectrum over the range from 500 to 700
cm
−1
, define the baseline by drawing a straight line
from 560 to 640 cm
−1
. Use the average in the regions
from 550 to 570 cm
−1
, and 630 to 650 cm
−1
, to define
the endpoints of the straight line.