semi合集-English.pdf - 第5412页
SEMI M58-0704 © SEMI 2004 5 where: s DepC = relative standa rd deviation of the measured p eak from Bottle C taken from the Deposition System Diameter Data: Bottle C portion of t he data sheet, and u BottleA has the same…

SEMI M58-0704 © SEMI 2004 4
10.8.1 Determine the FWHM values in nm obtained
from the histograms and record these in the FWHM on
Wafer columns of the SSIS Data portions of the data
sheet.
10.8.2 If desired, enter the peak diameter values and
counts found from the SSIS histograms in the Measured
Peak and Count columns of the SSIS Data portions of
the data sheet. These values may be used to evaluate
SSIS calibration and deposition system count accuracy,
respectively, but they are not used to evaluate the
deposition system against the requirements of SEMI
M52.
11 Calculations (see Note 2)
11.1 Calculate and record the mean diameter in nm to
one decimal place and the relative standard deviation as
a percentage of the mean of each of the four columns of
the Deposition System Diameter portion of the data
sheet.
11.2 Calculate and record the Relative FWHM in each
appropriate column of the SSIS Data portions of the
data sheet by dividing the FWHM in nm by the
measured peak diameter in nm and converting to
percent with two decimal places.
11.3 Calculate the mean and standard deviation of each
of the columns in the three SSIS Data portions of the
data sheet.
11.4 Calculate the expanded relative combined standard
uncertainty, U
relA
, for the peak diameter associated with
the deposition from Bottle A as follows:
22
2
BottleADepArelA
usU += (1)
where:
s
DepA
=
p
ooled relative standard deviation fo
r
system repeatability associated with the
deposition from Bottle A taken from the
Deposition System Diameter Data portion o
f
the data sheet by adding the square of the
standard deviation from the five depositions
made at the beginning of each day to the
square of the standard deviation from the
five scans made at the end of each day,
dividing by 2, and taking the square root.
u
BottleA
=
1σ relative combined standard uncertainty
of the peak diameter of the particle
distribution in Bottle A as certified by the
manufacturer found in the Bottle Pea
k
Diameter portion of the data sheet.
Record the result as a percentage to one decimal place
in the Bottle A column of the Dep Peak Uncertainty
row of the Analysis portion of the data sheet. Take the
certified value of the peak diameter of the deposition as
the peak diameter of the deposition from Bottle A.
11.5 Calculate the expanded relative combined standard
uncertainty, U
relB
, for the peak diameter associated with
the deposition from Bottle B as follows:
22
2
BottleADepBrelB
usU += (2)
where:
s
DepB
= relative standard deviation of the measured
p
eak from Bottle B taken from the
Deposition System Diameter Data: Bottle B
portion of the data sheet, and
u
BottleA
has the same meaning as in Equation (1). The
first term of this equation accounts for the variation due
to the uncertainty in the finding of the peak diameter of
Bottle B by the DMA and the second term accounts for
the uncertainty in the certified peak diameter of the
suspension in Bottle A, which is used to correct the
peak diameter of Bottle B as found by the DMA.
Record the result as a percentage to one decimal place
in the Bottle B column of the Dep Peak Uncertainty
row of the Analysis portion of the data sheet.
Determine the peak diameter of the deposition from
Bottle B as follows:
−
+=
A
AA
BB
Cert
MeanCert
MeanPeakDia 1 (3)
where:
Mean
B
= value of the mean deposition diameter fro
m
Bottle B taken from the Deposition System
Diameter Data portion of the data sheet, and
Mean
A
= average mean deposition diameter fro
m
Bottle A taken from the De
p
osition Syste
m
Diameter Data portion of the data sheet by
adding the mean from the depositions at the
b
eginning of the day to the mean from the
scans at the end of the day, and
Cert
A
= value of the peak diameter in the suspension
in Bottle A as certified by the manufacture
r
found in the Bottle Peak Diameter portion o
f
the data sheet.
Record PeakDia
B
in the Bottle B column of the
Peak(DepSysCorrected) row of the Analysis portion of
the data sheet.
11.6 Calculate the expanded relative combined standard
uncertainty, U
relC
, for the peak diameter associated with
the deposition from Bottle C as follows:
22
2
BottleADepCrelC
usU += (4)

SEMI M58-0704 © SEMI 2004 5
where:
s
DepC
= relative standard deviation of the measured
p
eak from Bottle C taken from the
Deposition System Diameter Data: Bottle C
portion of the data sheet, and
u
BottleA
has the same meaning as in Equation (1). Again,
the first term of this equation accounts for the variation
due to the uncertainty in the finding of the peak
diameter of Bottle C by the DMA and the second term
accounts for the uncertainty in the certified peak
diameter of the suspension in Bottle A, which is used to
correct the peak diameter of Bottle C as found by the
DMA. Record the result as a percentage to one decimal
place in the Bottle C column of the Dep Peak
Uncertainty row of the Analysis portion of the data
sheet. Take the peak height of the deposition as the
chosen value of deposition diameter corrected as
follows:
−
+=
A
AA
CC
Cert
MeanCert
MeanPeakDia 1
(5)
where:
Mean
C
= value of the mean chosen deposition
diameter from Bottle C taken from the
Deposition System Diameter Data portion o
f
the data sheet, and
Mean
A
and Cert
A
have the same meaning as in Equation
(3). Record PeakDia
C
in the Bottle C column of the
Peak(DepSysCorrected) row of the Analysis portion of
the data sheet.
11.7 Record the Mean Relative FWHM values for each
of the three bottles in the SSIS Data sections as
percentages with one decimal place in the FWHM SSIS
row of the Analysis portion of the data sheet.
11.8 Average the two mean deposition system
diameters for Bottle A found in the Deposition System
Diameter data and record this average and the mean
deposition system diameters for Bottles B and C in the
Peak (Dep System) row of the Analysis portion of the
data sheet. This is additional information only.
11.9 Record the Mean Measured Peak from the three
SSIS Data sections for each of the three Bottles in the
Peak (SSIS) row of the Analysis portion of the data
sheet. This is additional information only.
11.10 Record the value of N (Particles Deposited) in the
Count row of the Analysis portion of the data sheet.
12 Interpretation of Results
12.1 If a value for Bottle A, B, or C in the Dep Peak
Uncertainty row of the Analysis portion of the data
sheet is greater than 3.0%, the deposition system cannot
be used with this bottle or these settings to produce
calibration standards that meet the uncertainty
requirements of SEMI M52.
12.2 If a value for Bottle A, B, or C in the FWHM row
of the Analysis portion of the data sheet is greater than
5.0%, the deposition system cannot be used with this
bottle or these settings to produce calibration standards
that meet the FWHM requirements of SEMI M52.
12.3 Although it is not required by SEMI M52, the
mean for the deposited diameters determined by the
SSIS can be compared to the values found by the
deposition system and the PSL sphere manufacturer. A
significant difference in mean may imply that the SSIS
is not properly calibrated.
12.4 Although it is not required by SEMI M52, the
mean count values determined by the SSIS may be
compared to the count value set by the deposition
system. A significant difference may imply that the
deposition system needs to be adjusted.
13 Report
13.1 Report all the information, data, and calculations
recorded on the data sheet. A completed example of
such a report is provided in Related Information 2.
14 Precision and Bias
14.1 No data regarding precision and bias are presently
available. At present there are no plans to develop such
data, but should such data become available, it will be
added to this test method.
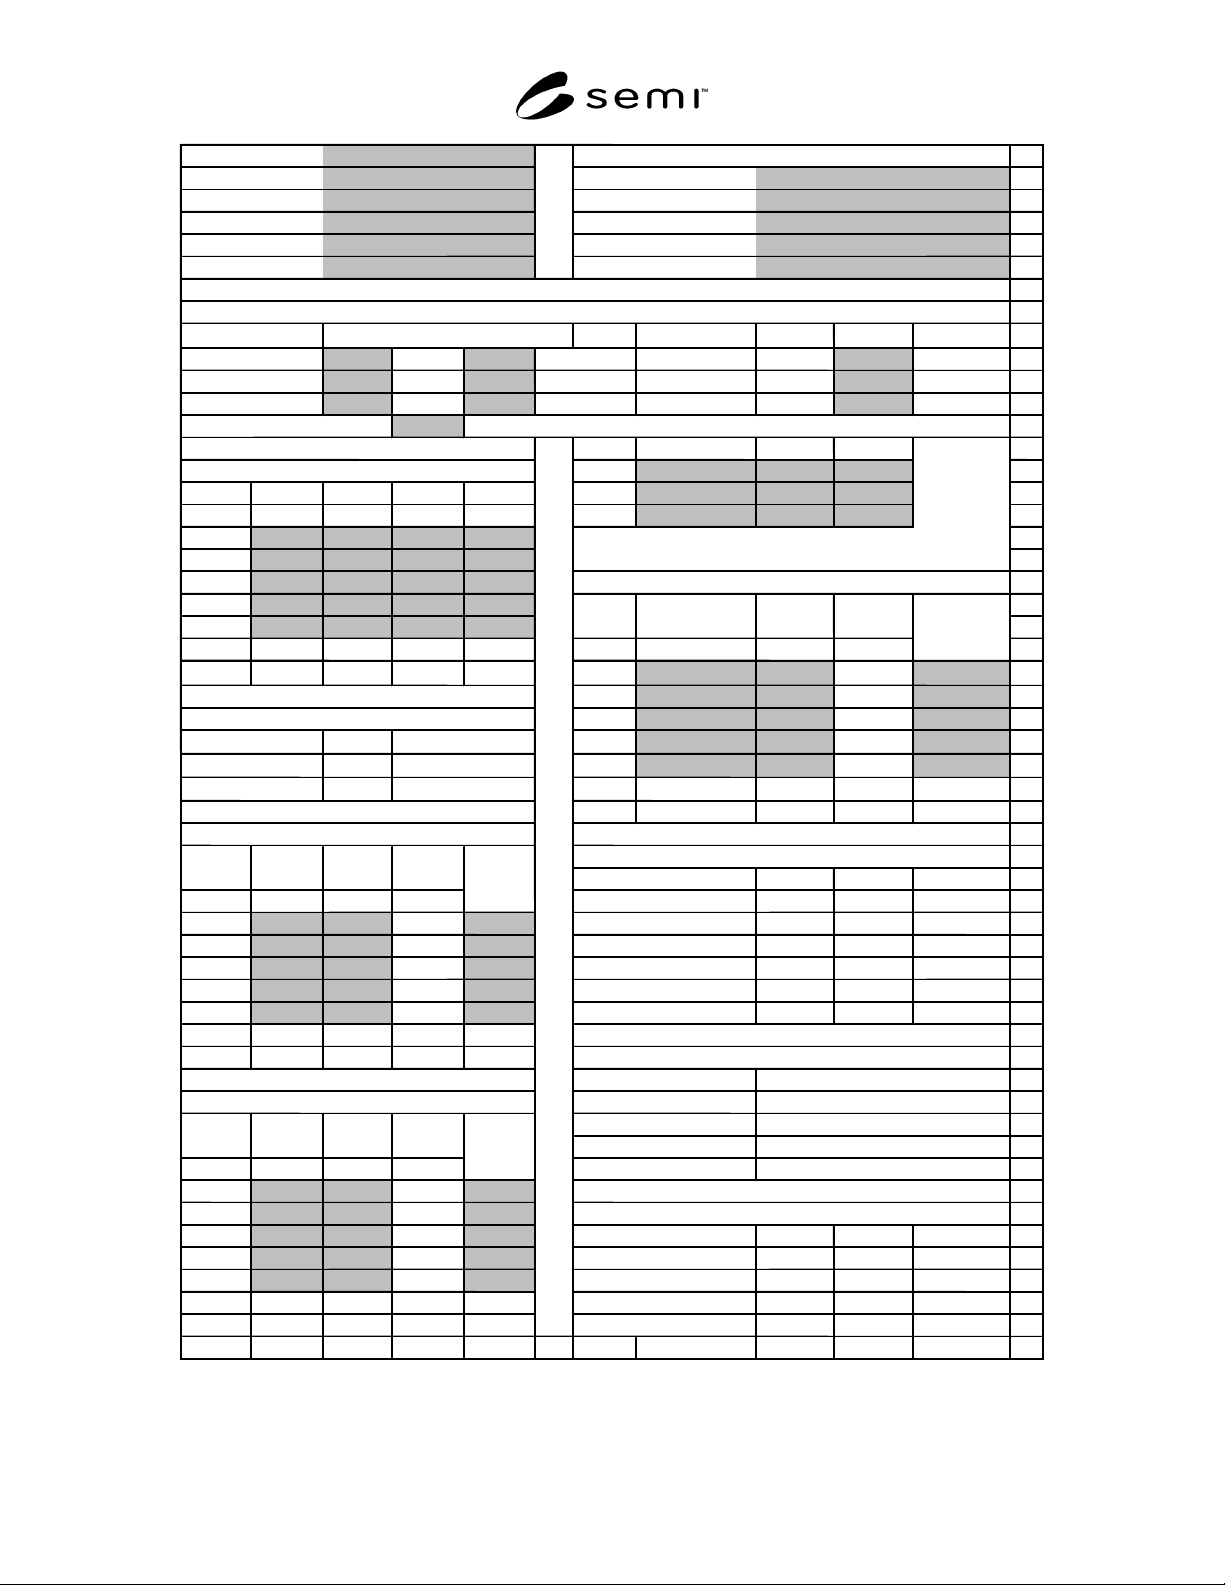
SEMI M58-0704 © SEMI 2004 6
Lab: Identification of deposition system used:
1
Contact Supplier/Model #
2
Address
System S/N
3
System S/W Revision
4
Phone
Date of Test
5
email Date of Last Previous Test
6
7
Characteristics of Suspensions Used for Test
8
u
B
ottle i
%FWHM
i
9
B
ottle A, Certified
nm ±
nm (1
σ
) or
10
nm ±
nm (1
σ
) or
11
nm ±
nm (1
σ
) or
12
Particles Deposited (
N
)
13
S
upplier
P
art No.
L
ot No.
14
Deposition System Diameters (nm)
B
ottle A
15
B
ottle A
B
ottle B
B
ottle
C
B
ottle A
B
ottle B
16
D
ay
nm nm nm nm
B
ottle
C
17
1
18
2
19
3
SSIS Data: Bottle C
20
4
21
5
22
M
ean
D
ay
nm nm %
23
s
D
ep
1
24
2
25
Dep System Sizing Corrections
3
26
M
ean
A
=
nm
4
27
s
D
epA
= 5
28
Cert
A
−
Mean
A
=
nm
M
ean
29
Std Dev
30
SSIS Data: Bottle A
31
Analysis
32
B
ottle A
B
ottle B
B
ottle
C
33
D
ay
nm nm %
D
ep Peak Uncertainty
34
1
F
WHM (SSIS)
35
2
P
eak (Dep System)
36
3
P
eak (Dep Sys Corrected)
37
4
P
eak (SSIS)
38
5
M
easured Count
39
M
ean
40
Std Dev
Compare Quantity with Limit
41
42
SSIS Data: Bottle B
Uncertainty Limit
43
F
WHM Limi
t
44
SSIS Peak
45
D
ay
nm nm %
SSIS Count
46
1
47
2
Interpretation of Results
48
3
B
ottle A
B
ottle B
B
ottle
C
49
4 Uncertainty
50
5
51
M
ean SSIS/Dep Peak Comp
52
Std Dev SSIS/Dep Count Comp
53
A B C D E F G H I J K
M
easured Pea
k
S
uspension
P
eak Diamete
r
B
ottle B
B
ottle
C
R
elative
F
WHM
Count
F
WHM
F
WHM on
Wafer
Quantity
L
imi
t
Count
R
elative
F
WHM
M
easured
Peak
F
WHM
on Wafer
3.0% (SEMI M52)
Count
5.0% (SEMI M52)
Dep Sys Corrected Peak (Info only)
Dep System Count (Info only)
M
easured
Peak
F
WHM
on Wafer
R
elative
F
WHM
Figure 1
Example of Data, Calculation, and Analysis Sheet for Test Procedure