semi合集-English.pdf - 第6472页
SEMI G78-0699 © SE MI 1999 5 X offset = (right – left)/2 + left Die pad Cente r Lef t X Y Y Pads- Scrub m ar k & scrub m ar k cente r X Die pad Cente r Top Bottom Y X Pads- Scrub m ar k & scrub m ar k cente r Y o…

SEMI G78-0699 © SEMI 1999 4
is to be entered into the data collection table as part of
the application of this method.
6.2.4 The algorithm collects data from 9 wafers out of
a lot of 10. Three setups are performed using 3 wafers
per setup. All dice will be probed, but data will be taken
only on twelve of the die on each wafer. Twenty-four
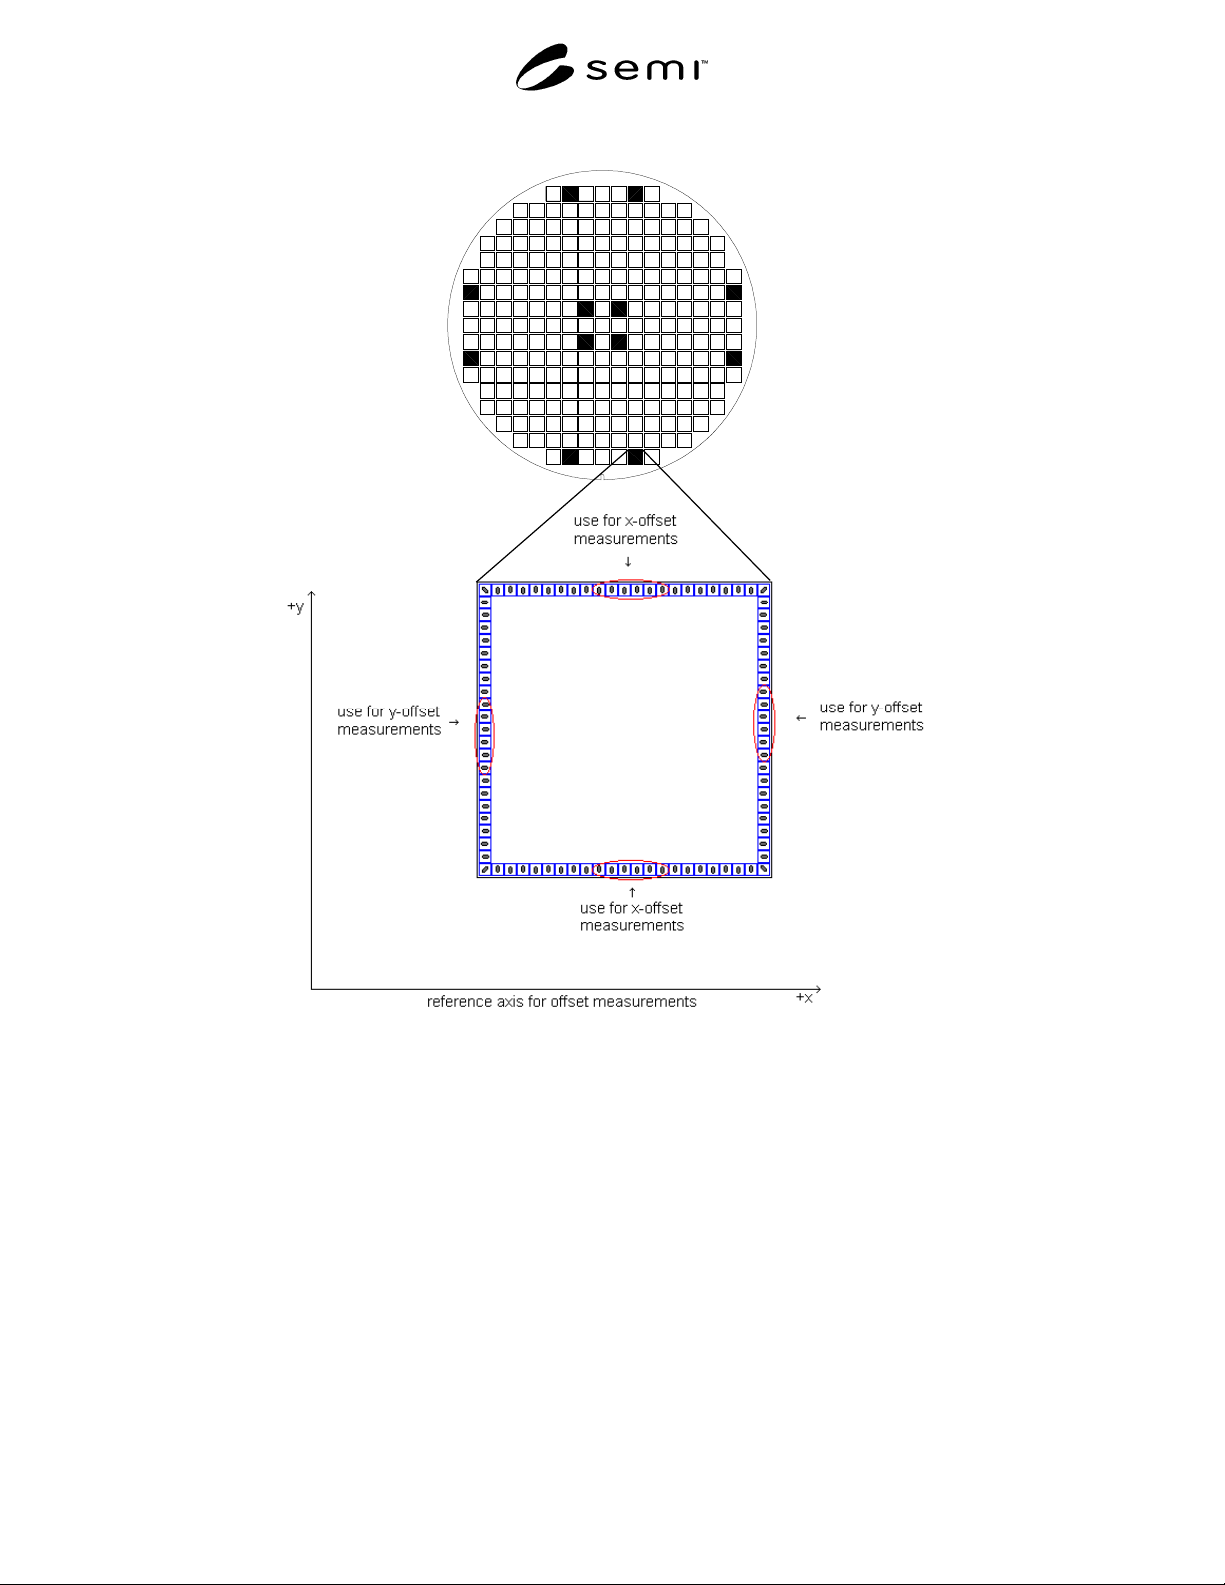
pads on each die are evaluated (see Figure 4). Overall,
2592 die pads are analyzed in a lot.
6.2.5 When all the data is collected and analyzed, each
probe system will have an average die offset value.
This will be a comparative representation of accuracy
consisting of average offsets for all evaluated die. This
comparative representation of accuracy is a measure of
how accurate the probe systems place the chuck, and
thus the probe needles, to the center point on the die
pads, consistent with normal operation of the probe
systems.
6.2.6 In general, when the probe marks are viewed
across all dice, there will be a data spread, or
distribution of error points for each wafer.
Repeatability is the ± 3σ variation of all die offsets,
identified in this method as the 3σ calculation of
Normalized Die Offset.
6.3 Probe Card Issues – Probe card construction
variability and probe card usage at temperatures other
than ambient are important considerations. The
following sources of error should be kept in mind:
• In a hot chuck environment the probe card and
needles will experience a high percentage of the
elevated chuck temperature. The material selection
for the probe card will determine how it expands
and contracts due to the temperatures applied.
Probe systems can be equipped with programmable
preheat (soak) times. Longer preheat times will
reduce probe card variability while decreasing
throughput.
• Needle construction can result in excessive error
due to bending of the needles when excessive
probe system z-stage overdrive is applied. The
number of needles and the selection of needle
technology, i.e., cantilever versus vertical, is
another variable, having a noticeable influence on
measurement results.
• Since each user of this method is not confined to a
standard for probe card construction, the user of
this method is advised to choose a probe card and
vendor with good integrity, and to use that same
probe card when evaluating multiple probe
systems. The assertion here is that the same probe
card used to evaluate multiple systems will react in
a repeatable manner under varying environmental
conditions. This assumes there is no excessive
probe card needle wear during the multiple
evaluations, and that needle alignment is verified
or achieved before each execution of the
procedure.
6.3.1 Probe mark scrub length can vary due to several
factors including:
variations in the flatness of the chuck and
stage travel that are not compensated by the z-
sensor mapping algorithms
by hard spots in the aluminum pads, or
by variations in probe tip geometry, etc.
6.3.2 To minimize the impact of this variation in the
probe mark analysis algorithm, use only scrub mark
location data that is taken normal to the direction of
scrub. Distances measured normal to the orientation of
the scrub mark are generally accepted to be
significantly more stable than that which is taken
parallel to the scrub mark (see Figure 2).
6.3.3 In summary, the probe card itself can be a
limiting factor when making needle placement accuracy
measurements, especially at varying environmental
conditions. Material selection, vendor to vendor
variation, construction of a probe card (blade, epoxy
ring, vertical, etc.), especially with varying
environmental conditions, will create inconsistent
analysis results, unless care is taken with the
application of this method. The precautions discussed
here are meant to promote consistent and accurate
evaluation results for this method.
6.3.4 Nevertheless, the precautions mentioned here
could ALSO be an important basis for using this
method. As an example, a probe card is typically
designed for XY positional placement and planarity,
and is expected to meet customer specification
requirements in normal operation at room temperatures.
This method could serve as a means of establishing
numerical results that represents the effects that
temperature or probe card construction variability have
on probe card specification requirements.
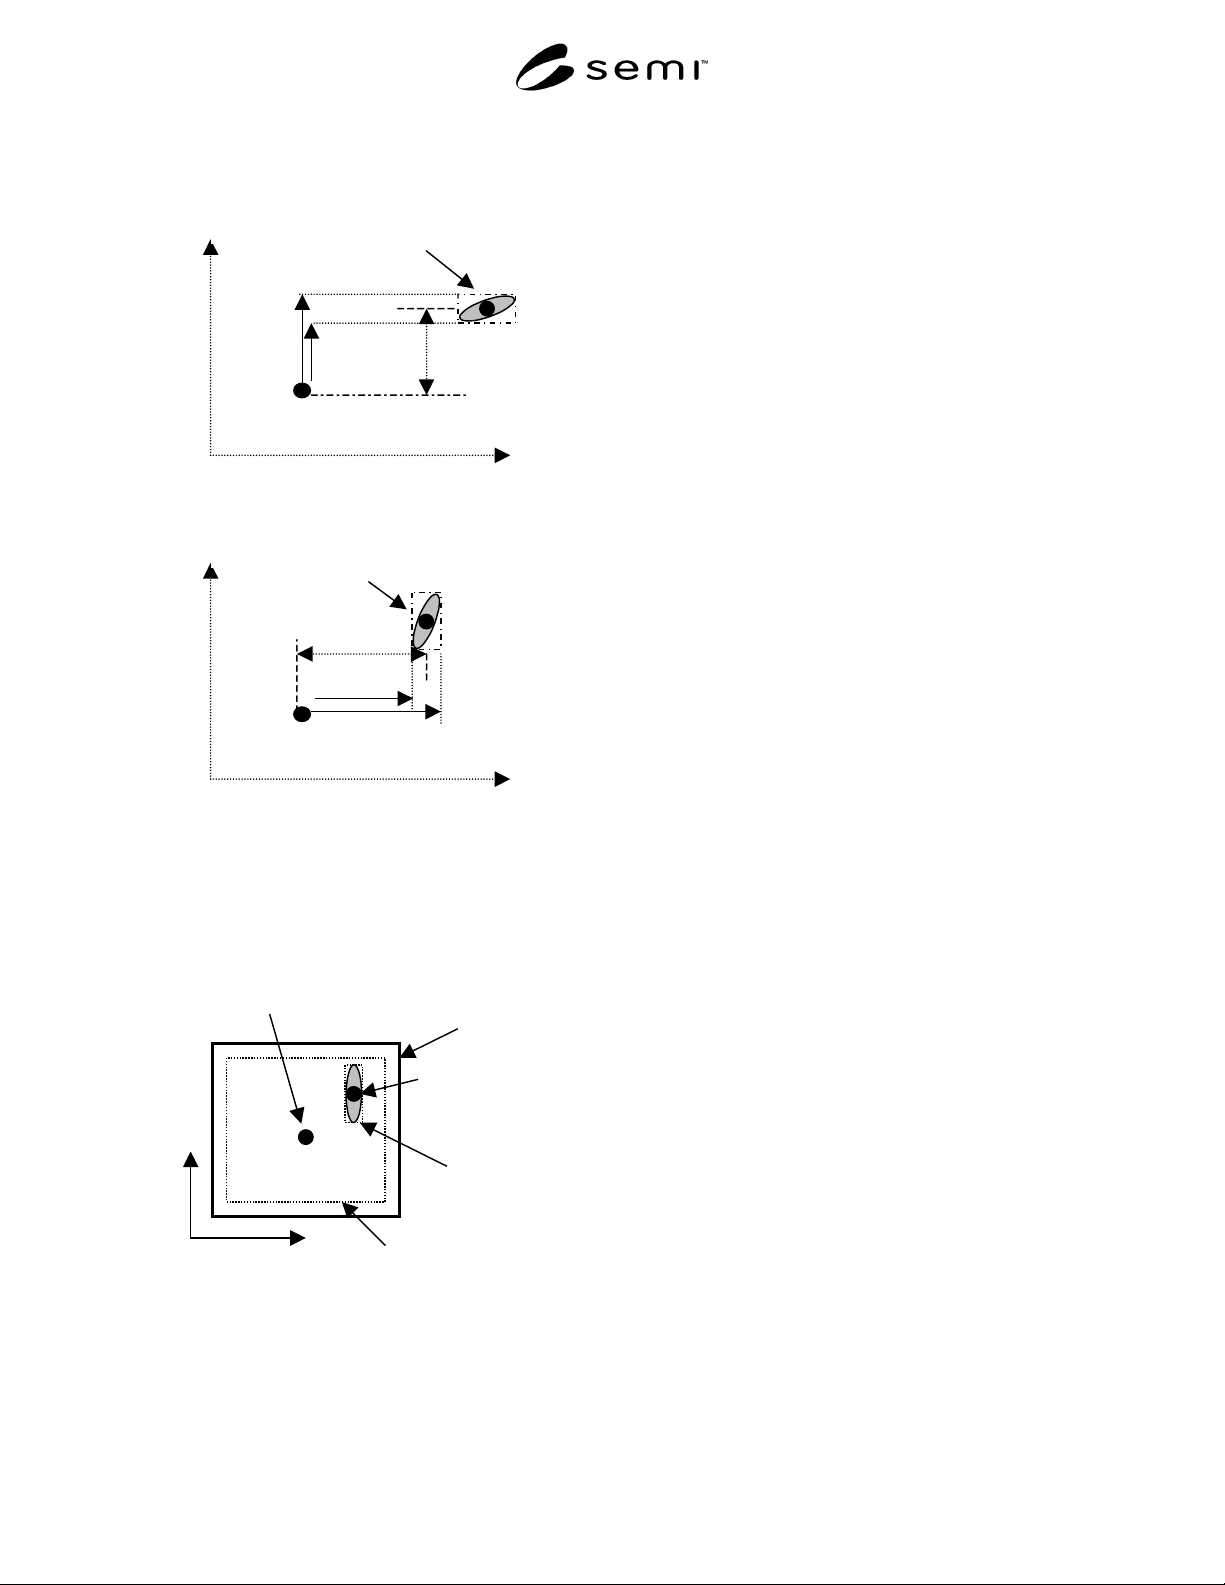
6.4 The PMA Algorithm – A best-f it rectangle can be
drawn around the scrub mark and the passivation
opening for each pad, reference Figure 3.
NOTE: Applying a best-fit rectangle around the passivation
opening may prove difficult for certain vision systems.
Application of the best-fit rectangle around the die pad metal
is an acceptable alternative. The center position of the best-fit
rectangle around the scrub mark will represent the center of
the scrub mark. The center of the die pad is the center of the
best—fit rectangle around the passivation opening. The
distance between the two centers is the pad offset. Pad offset
is computed from the four values left, right, top, and bottom,
reference Figure 2.
SEMI G78-0699 © SEMI 19995
X offset =
(right – left)/2 + left
Die pad
Cente
r
Lef
t
X
Y
Y Pads- Scrub mark &
scrub mark cente
r
X
Die pad
Cente
r
Top
Bottom
Y
X Pads- Scrub mark &
scrub mark cente
r
Y offset =
(top – bottom)/2 + bottom
Right
Offset
Offset
Figure 2
X and Y Offset
Scrub mark
and scrub mark
center
Die pad
Passivation opening and best fit
rectangle
Best fit
rectangle
Die pad center
Y
X
Figure 3
Scrub Mark Analysis
6.4.1 Vision system measurements will be made
establishing offset distances from the die pad center to
the scrub mark. The stability of the measurement is
greater when made perpendicular to the direction of the
scrub mark. This will establish X and Y offsets via
measurement of offsets for pads in the X and Y plane of
the die.
6.4.2 Once the offsets are established, a two-step
procedure will manipulate 1296 X and 1296 Y offset
values. The end result of the algorithm will be a
relative measure of the total probe system accuracy and
repeatability for the pads analyzed. Figure 5 represents
a visual summary of the method.
6.5 Considerations of Scale — When evaluating the
suitability of a particular probe system to probe a
particular size of bond pad, or to probe accurately at a
particular pad-to-pad pitch, a good rule of thumb is that
the prober’s positional accuracy, as stated in its
specifications, should be 1/10 that of the scale of the
features to be probed. For example, if the probe system
being evaluated has an overall placement accuracy of
5µm, it would be inappropriate to analyze wafers using
this method and this probe system for dice that have
pads less than 50 µm square (this would be less than
10x).
6.5.1 Regardless, when this method is used for
evaluation of multiple systems, it is essential that die
and bond pad size/pitch consistency be maintained from
evaluation to evaluation if the results are to be
meaningful.
6.5.2 The same 10× rule applies to the vision system
or automated Probe Mark Analysis system employed to
make the pad offset measurements. These systems
should have a pixel resolution that is at least 10× finer
than the die pad dimensions associated with the scrub
marks being measured.
6.6 Conclusion — It is assumed th at the user of this
method has a wafer probe system or systems, or is
planning to make a selection from the various systems
available in the market place, and requires objective
comparative analysis for accuracy, repeatability and
throughput.
6.6.1 It should be clear that this method employs a
three-step process of probing, probe mark data
collection, and data analysis.
6.6.2 When probing, every die on ea ch of the ten
wafers is to be “tested” and probed. Of those ten
wafers, the last nine with 12 die per wafer will be used
for scrub mark data collection. At least 24 pads per die
will be used for the analysis. The first wafer is meant
only to allow stabilization for the probe system and its
probe card.
SEMI G78-0699 © SEMI 1999 6
Figure 4
Recommended Dice and Pads to be used for Data Collection
6.6.3 It is important that the wafers used with this
method are probed only once, or else multiple scrub
marks may be difficult for the measurement system to
deal with and will most likely influence the analysis
results. This method assumes the wafer is ideal, having
no die skew due to wafer process anomalies.
NOTE: It is possible that a not so perfect probe tip to pad
alignment (PTTPA) may create misleading results for this
method. It is recommended that PTTPA be done on die
located at the edge of the wafer, as shown in Figure 4. This is
opposed to having PTTPA done on die in the center of the
wafer. An offset error incurred in the context of a PTTPA
done in the center may result in an incremental and continuing
error as testing moves across the wafer. With this method that
error may be averaged-out.
6.6.4 Probe system index time is device and probe
system dependent. Probe system index time is
determined by acceleration, maximum achievable
velocity, and distance traveled die to die by the chuck.
Thus, the device type chosen for use with this method
should be representative of typical die size if
meaningful index time and throughput data are to be
gathered.