semi合集-English.pdf - 第6612页
SEMI C10-0305 © SEMI 1998, 2005 9 7 Quality Assurance 7.1 Each laborat ory that uses this me thod should do so in accordance wi th the established quality assurance protocols in place. The MDL , of speci fied trace conta…
SEMI C10-0305 © SEMI 1998, 2005 8
6.3.5.2 In case (b), a multivariate calibration model can be used instead of the default linear model in performing a
regression analysis which quantifies the Upper Confidence Limit for individuals at X = 0 at a 3 sigma equivalent
probability level (and back-projects this result through the multivariate calibration model using the observed point of
maximum interference in terms of the other concentrations in the range of calibration to estimate the MDL). How to
accomplish this is the responsibility of those applying this alternative.
6.3.5.3 In case (c), other error distributions than the normal, can be used wherever appropriate. The same
philosophical approach should be applied; a regression analysis which quantifies the Upper Confidence Limit for
individuals at X = 0 at a 3 sigma equivalent probability level (and back-projects this result through the calibration
model to estimate the MDL). How to accomplish this is the responsibility of those applying this alternative.
6.3.5.4 In case (d), it is more likely that one will obtain a higher MDL than is truly the case. This phenomena is
more likely to occur when the blank is not usable in the regression analysis for any reason. The only fix for this is to
reapply the procedure with a set of standards which is not so distant from the MDL, but still otherwise meets the
requirements provided herein.
6.3.5.5 In cases (a), (b), and (c), or any combination thereof, the use of appropriate computer/statistical tools is the
responsibility of those applying these alternatives. Additional information on regression analysis methods can be
found in Applied Regression Analysis, 3rd Edition, Norman R. Draper and Harry Smith, John Wiley and Sons, ©
1998.
6.3.6 Example — Results of Applying (see ¶6.3.3 and ¶6.3.4)
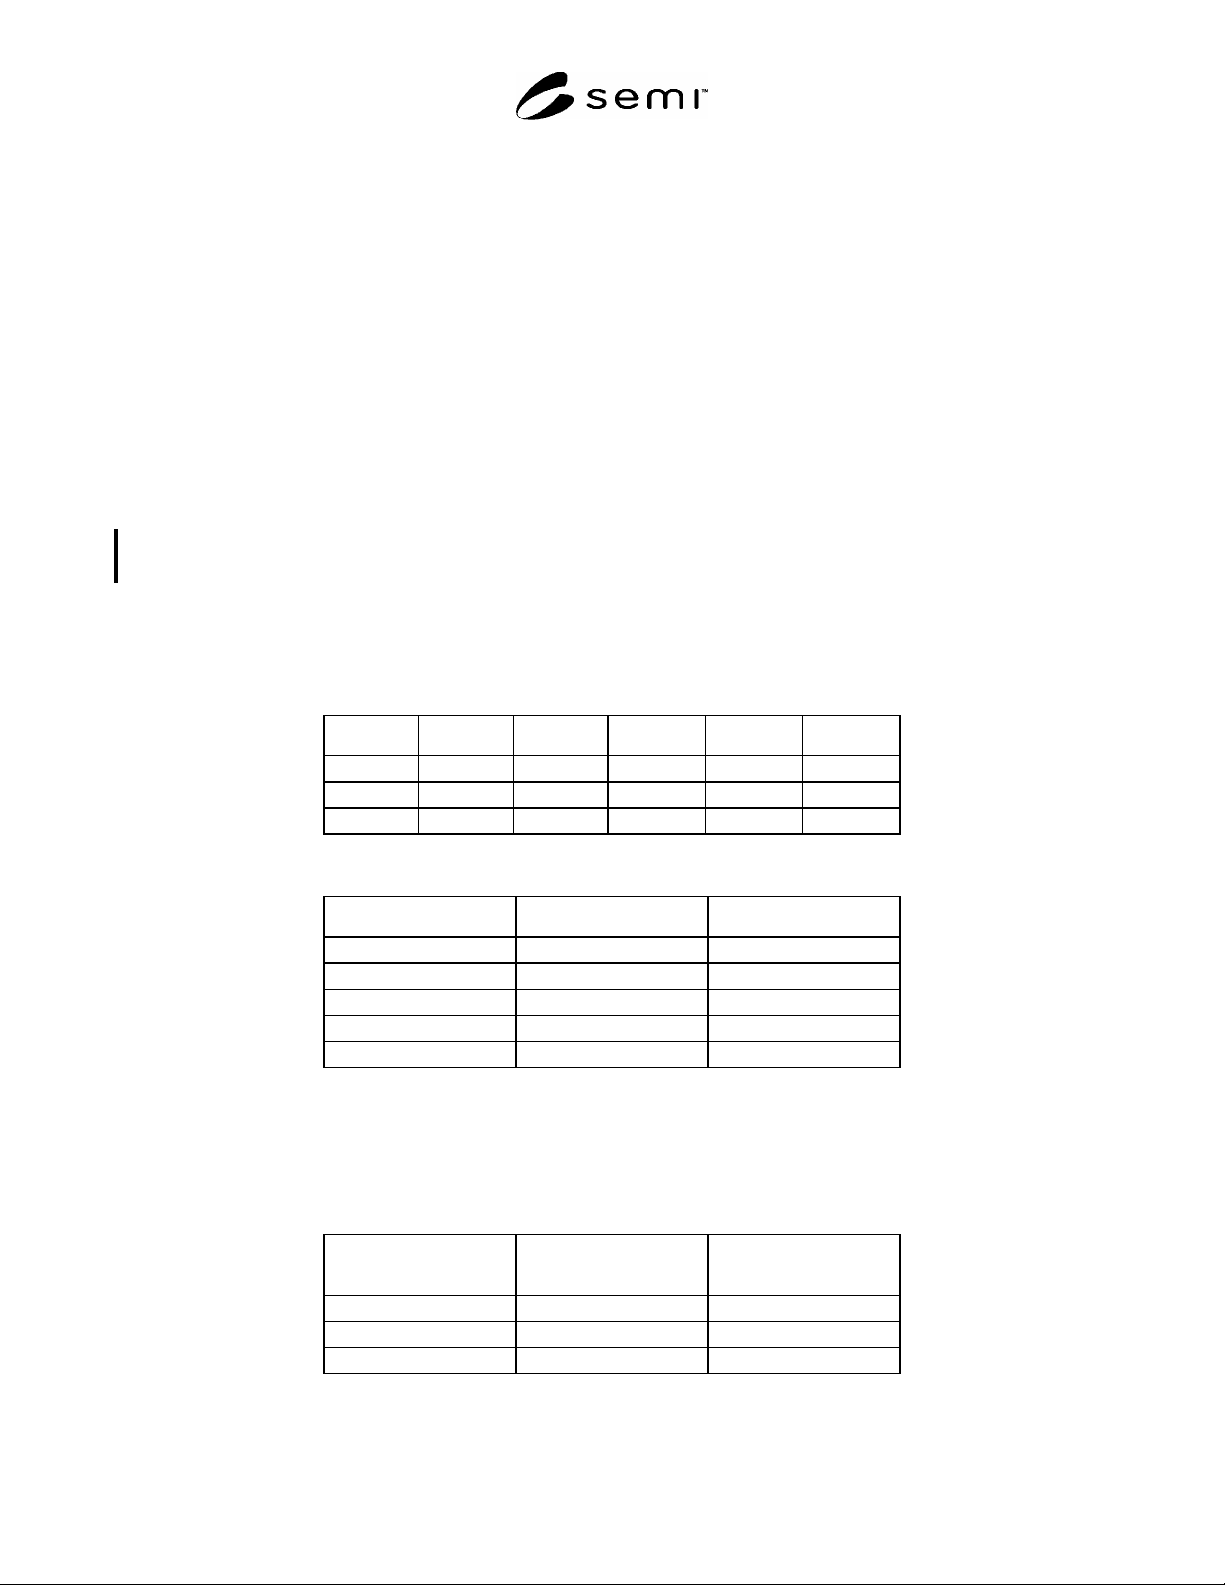
6.3.6.1 Limited result summaries for obtaining the MDL by OLS and WLS are provided for the calibration data in
Table 2. These results (Table 3) can be used to benchmark one's implementation of the computational methodology.
Table 2 Calibration Data
Ppb signal ppb signal ppb signal
1 5.03 5 19.87 10 39.90
1 5.00 5 21.20 10 38.28
1 4.91 5 20.45 10 40.93
Table 3 Result Summaries
Statistic OLS WLS
MDL 1.097 0.108
UCL 5.390 1.531
m 3.857 3.869
b 1.157 1.112
s 0.800 0.00997
6.3.6.2 Note the relatively large difference in the estimated MDL (1.10 vs. 0.11) resulting from passing the same
data through each of the OLS and WLS algorithms. This data has very different levels of variability, depending on
the concentration level of the standard (Table 4). Such data should be analyzed with the WLS rather than the OLS
algorithm.
Table 4 Signal Variation by Concentration Level
Concentration
Level
Standard
Deviation
Variance
1 0.062 0.0038
5 0.667 0.4449
10 1.336 1.7849

SEMI C10-0305 © SEMI 1998, 2005 9
7 Quality Assurance
7.1 Each laboratory that uses this method should do so in accordance with the established quality assurance
protocols in place. The MDL, of specified trace contaminants, should be determined whenever a major recalibration
of the method and/or instrument is required. The new values should then be used whenever results are reported. A
schedule of periodic verification of the MDL, for key trace contaminants, should be incorporated into the program.
NOTICE: SEMI makes no warranties or representations as to the suitability of the standards set forth herein for any
particular application. The determination of the suitability of the standard is solely the responsibility of the user.
Users are cautioned to refer to manufacturer's instructions, product labels, product data sheets, and other relevant
literature, respecting any materials or equipment mentioned herein. These standards are subject to change without
notice.
By publication of this standard, Semiconductor Equipment and Materials International (SEMI) takes no position
respecting the validity of any patent rights or copyrights asserted in connection with any items mentioned in this
standard. Users of this standard are expressly advised that determination of any such patent rights or copyrights, and
the risk of infringement of such rights are entirely their own responsibility.
Copyright by SEMI® (Semiconductor Equipment and Materials
International), 3081 Zanker Road, San Jose, CA 95134. Reproduction of
the contents in whole or in part is forbidden without express written
consent of SEMI.

SEMI C16-0299 © SEMI 1997, 2005 1
SEMI C16-0299 (Reapproved 0305)
GUIDE FOR PRECISION AND DATA REPORTING PRACTICES
This guide was technically approved by the Global Liquid Chemicals Committee and is the direct
responsibility of the North American Liquid Chemicals Committee. Current edition approved by the North
American Regional Standards Committee on November 4, 2004. Initially available at www.semi.org January
2005; to be published March 2005. Originally published in 1997; previously published February 1999.
1 Purpose
1.1 To provide a minimal set of guidelines for precision and data reporting practices for data supporting a Process
Chemicals or Gases SEMI specification.
2 Scope
2.1 This guide applies to data collected to support establishment of a SEMI Process Chemicals or Gases
specification or verification of performance to such a SEMI specification.
NOTICE: This standard does not purport to address safety issues, if any, associated with its use. It is the
responsibility of the users of this standard to establish appropriate safety and health practices and determine the
applicability of regulatory or other limitations prior to use.
3 Referenced Standards
3.1 SEMI Standard
SEMI C1 Specifications for Reagents
NOTICE: Unless otherwise indicated, all documents cited shall be the latest published versions.
4 Terminology
None.
5 Standards
5.1 For each standard used in the study, the following should be reported:
5.1.1 Preparation method before analysis (e.g., dilution, evaporation).
5.1.2 Sample matrix.
5.1.3 Concentration.
5.1.4 n = number of determinations made on the standard.
5.1.5 The average of the n determinations.
5.1.6 The standard deviation of the n measurements (if n > 1).
5.1.7 Range of values observed (if n > 1).
5.1.8 Traceability of the standard.
5.1.9 If standard was produced internally, how was it produced.
6 Samples
6.1 For all reported sample results, including recovery studies, use as many of the reporting requirements for
standards as are applicable.