semi合集-English.pdf - 第5319页
SEMI M50-1104 © SEMI 2001, 2004 5 5 4.5 4 3.5 3 2.5 2 1.5 1 0.5 0 70 80 90 10 0 11 0 120 130 1 40 Mean Si ze <S i > of LL S [nm LSE] Standard Deviatio n of Size < S i > [nm LSE ] NOTE 1: This figure is an exa…
SEMI M50-1104 © SEMI 2001, 2004 4
11.1.2 Date of test;
11.1.3 Manufacturer, model, serial number, and
software version of the SSIS being tested,
11.1.4 Description of the reference wafer used in the
test.
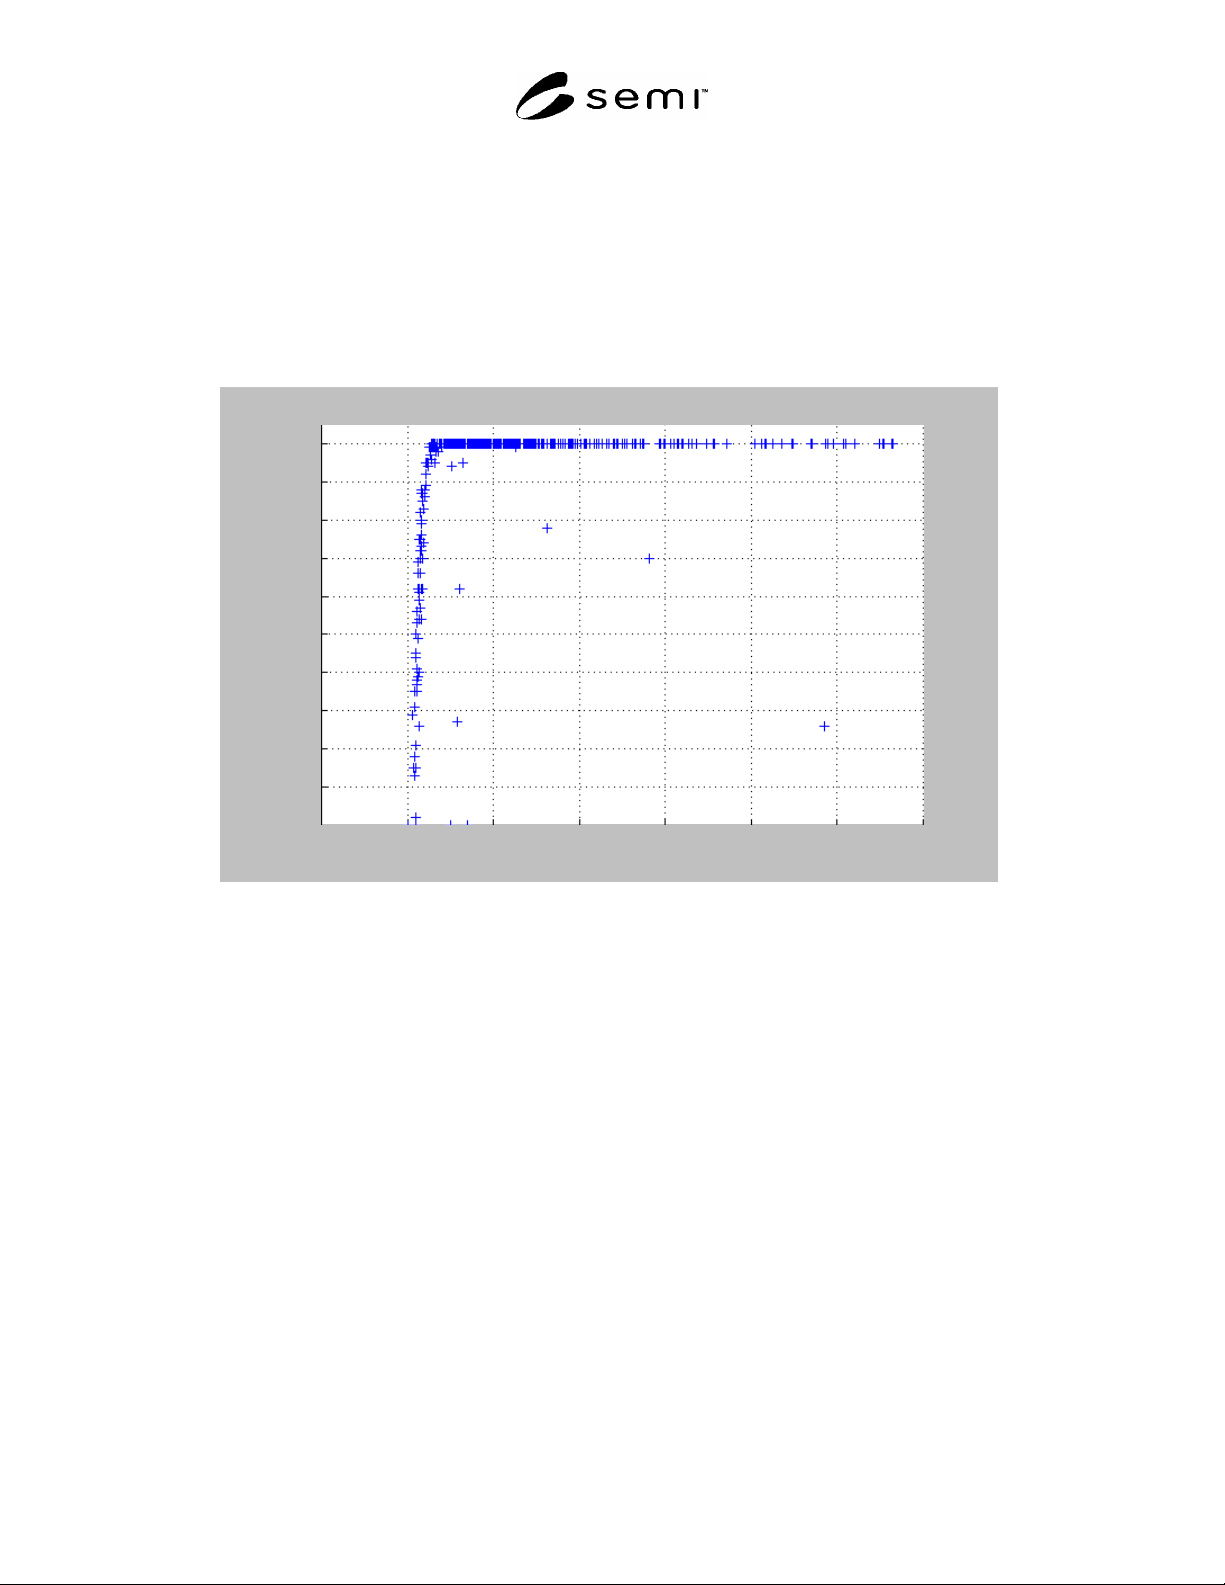
11.1.5 Plot of the capture rate, CR(<S
i
>), vs. the mean
size, <S
i
>, similar to the example in Figure 1.
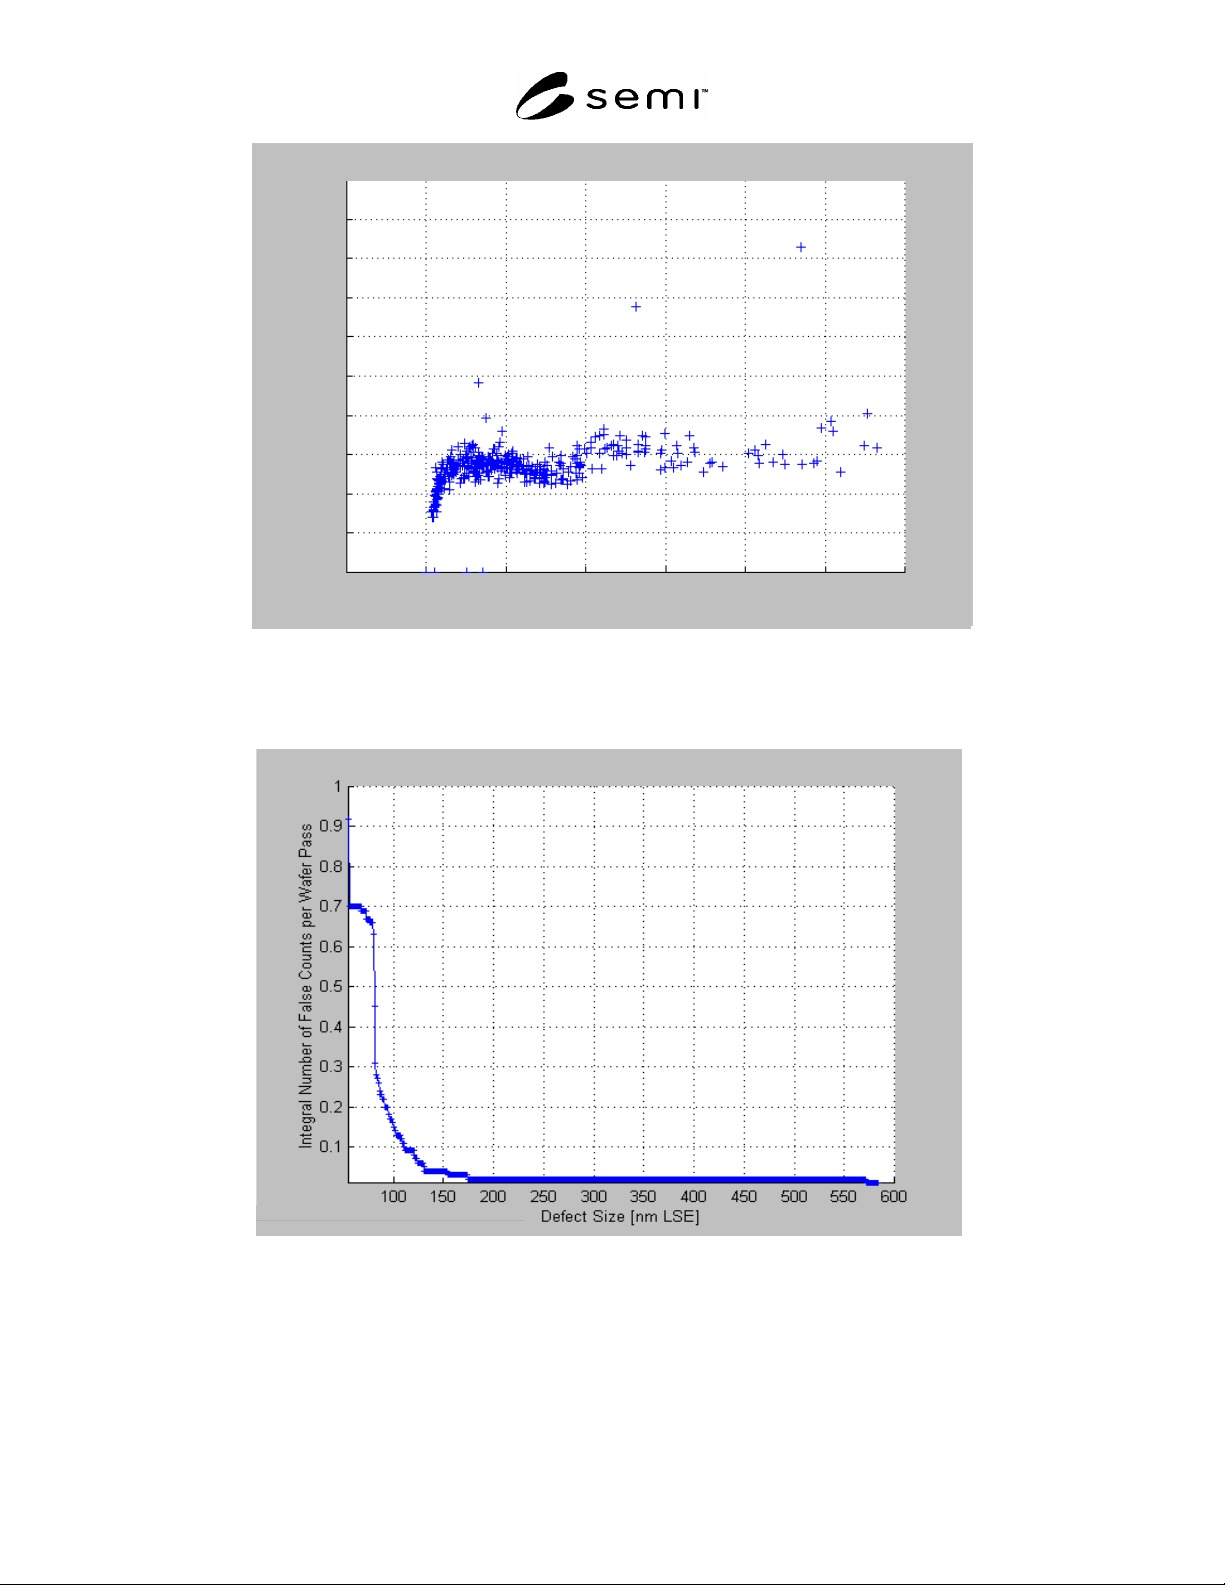
11.1.6 Plot of the standard deviation, (S
i
), of the LLS
mean size, <S
i
>, similar to the example in Figure 2.
11.1.7 Calculated false count rate, FCR, as described in
Section 10.3.2.
11.1.8 Plot of the cumulative false count rate,
CFCR(S
i
), similar to the example in Figure 3.
1
0.9
0.8
0.7
0.6
0.5
0.4
0.3
0.2
0.1
0
70 80 90 100 110 120 130 140
Mean Size <S
i
> of LLS [nm LSE]
Capture Rate CR (<S
i
>) [%/100]
NOTE 1: This figure is an example plot of capture rate as determined in Sections 10.2.1 through 10.2.3. The measurements in
this example are the result of 100 scans on a wafer with several natural LLS sites of different sizes. The SSIS noise floor was set
at 80 nm LSE.
Figure 1
Capture Rate
SEMI M50-1104 © SEMI 2001, 2004 5
5
4.5
4
3.5
3
2.5
2
1.5
1
0.5
0
70 80 90 100 110 120 130 140
Mean Size <S
i
> of LLS [nm LSE]
Standard Deviation of Size <S
i
> [nm LSE]
NOTE 1: This figure is an example plot of the standard deviation of true count size as determined in Sections 10.2.4 and 10.2.5.
Figure 2
Standard Size Deviation
0.0
50
NOTE 1: This figure is an example plot of cumulative false count rate as determined in Sections 10.3.1 through 10.3.3. This is
the same data set used for Figures 1 and 2; however, the horizontal scale has been expanded.
Figure 3
Cumulative False Count Rate (CFCR)

SEMI M50-1104 © SEMI 2001, 2004 6
APPENDIX 1
DEFAULT PROCEDURE FOR DETERMINATION OF SCANNER XY
UNCERTAINTY
NOTICE: The material in this appendix is an official part of SEMI M50 and was approved by full letter ballot
procedures on April 22, 2004 by the North American Regional Standards Committee.
A1-1 Purpose
A1-1.1 This procedure is intended to be used for determining the scanner XY uncertainty for the scanning surface
inspection system (SSIS) under test when this information is not otherwise available.
A1-2 Scope
A1-2.1 This appendix covers a procedure for determining ability of an SSIS to report the location of a localized
light scatterer (LLS) on a silicon wafer surface under repeatability conditions.
NOTICE: This appendix does not purport to address safety issues, if any, associated with its use. It is the
responsibility of the users of this procedure to establish appropriate safety health practices and determine the
applicability of regulatory or other limitations prior to use.
A1-3 Limitations
A1-3.1 If particles are used as the reference LLSs, care must be taken both to avoid contamination by interfering
particles and to avoid removal of the reference particles.
A1-4 Referenced Standards
A1-4.1 SEMI Standards
SEMI E89 — Guide for Measurement System Capability Analysis
SEMI M1 — Specification for Monocrystalline Polished Silicon Wafers
SEMI M20 — Specification for Establishing a Wafer Coordinate System
SEMI M53 — Practice for Calibrating Scanning Surface Inspection Systems Using Certified Depositions of
Monodisperse Polystyrene Latex Spheres on Unpatterned Semiconductor Wafer Surfaces
NOTICE: Unless otherwise indicated, all documents cited shall be the latest published versions.
A1-5 Terminology
A1-5.1 Terms related to SSIS operation are defined in Section 5 of this standard and in SEMI M53.
A1-5.2 Terms related to uncertainty and repeatability are defined in SEMI E89.
NOTE 1: The current edition of SEMI M89 defines the repeatability used in this procedure as “static repeatability.”
A1-6 Summary of Procedure
A1-6.1 A reference silicon wafer with at least ten identifiable and stable LLSs (relatively large, isolated particles or
pits) located on its polished surface is scanned ten times by the SSIS under test without removing it from the SSIS
between scans.
A1-6.2 For each scan, a map of the positions associated with the specified laser light scattering events arising from
scattering from the LLSs on the wafer surface is obtained and the coordinates of these events are recorded.
A1-6.3 The coordinate data set is filtered to remove coordinates not associated with the selected LLSs.
A1-6.4 The sample standard deviations (x and y) are used to estimate the repeatability of the reported locations, and
the scanner XY uncertainty is calculated as the quadrature sum of the x- and y-sample standard deviations.