semi合集-English.pdf - 第420页
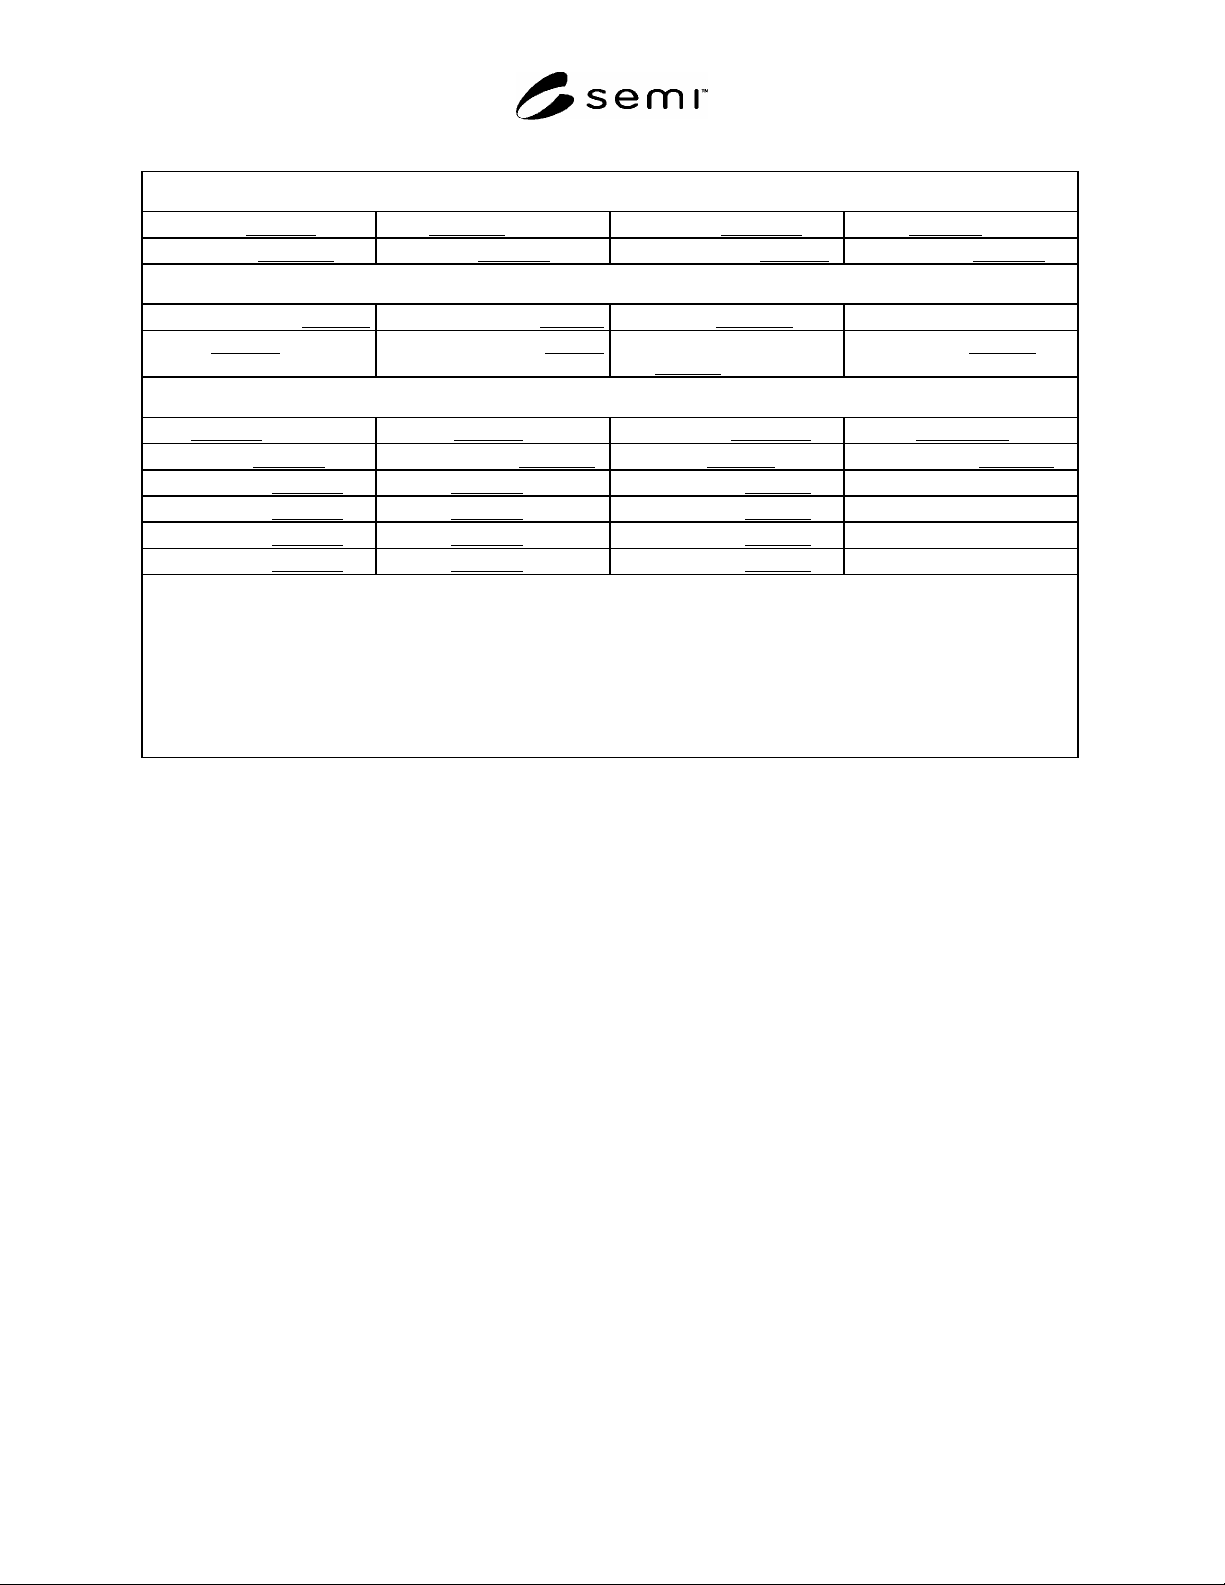
SEMI E56-1104 © SEMI 1996, 2004 9 Table 2 Test Data Cover Sheet MFC Manufacturer Model Serial Number Attitude Nameplate Gas Seal Material Valve Seat Material Full Scale Range Environment Ambient Temp. (°C) Ambie nt Press…

SEMI E56-1104 © SEMI 1996, 2004 8
Input % Set Point (sccm) Indicated Flow (sccm) Actual Flow (sccm)
70
80
90
100
90
80
70
60
50
40
30
20
10
5
Minimum
#1
5
10
20
30
40
50
60
70
80
90
100
90
80
70
60
50
40
30
20
10
5
Minimum
#1
5
10
20
30
40
50
#1
Per Section 13.5.4.1
#2
Test for accuracy, linearity, repeatability, short-term reproducibility, and hysteresis.
SEMI E56-1104 © SEMI 1996, 2004 9
Table 2 Test Data Cover Sheet
MFC
Manufacturer Model Serial Number Attitude
Nameplate Gas Seal Material Valve Seat Material Full Scale Range
Environment
Ambient Temp. (°C) Ambient Press. (kPa) Humidity (%)
Test Gas Inlet Gas Press. (Kpa) Outlet Gas Press.
(kPa)
Gas Temp. (°C)
Test Facility
Name City/State Telephone ( ) Fax ( )
Standard Used Standard Accuracy Facility Bias Certification Date
Other Equipment Accuracy Certification Date
Other Equipment Accuracy Certification Date
Other Equipment Accuracy Certification Date
Other Equipment Accuracy Certification Date
Comments or Special Instructions:_____________
_
_____________________________________________________________
_______________________________________________________________________________________________________
_______________________________________________________________________________________________________
_______________________________________________________________________________________________________
_______________________________________________________________________________________________________
_______________________________________________________________________________________________________
_____________________________________________________________________________ Technical:________________
_____________________________________________________________________________ Date:____________________
13.2 Use the cardinal setpoints and any other setpoints
of specific interest. These setpoints will be used to
determine the accuracy of the MFC. The setpoint
increments should exceed the expected deadband of the
DUT.
13.3 At each setpoint under test, maintain the input
signal until the output of the DUT becomes stabilized at
its apparent final value. Observe and record the output
values in Table 1 for each input value.
13.4 Record five readings at each setpoint during
testing. The time between readings shall be between 1
and 100 times the settling time of the DUT.
NOTE 2: If the data points show a trend in one direction,
either up or down, the DUT is not stable enough for the test to
proceed to the next setpoint. Record another five readings at
this setpoint. If the results continue to show a trend, repeat
the measurements at the previous setpoint. If the results are
not satisfactory at this setpoint, stop the test for this MFC. If
the results are not satisfactory, halt the test and verify the
performance of the testing apparatus.
13.5 Test for Accuracy, Linearity, Repeatability, Short-
Term Reproducibilty, and Hysteresis
NOTE 3: Record data in Table 1.
13.5.1 Provide a setpoint to the DUT of 40% and hold
it there for 5 minutes. Do not collect any data at this
point. Apply a 50% setpoint to the MFC and record
data.
13.5.2 Begin collecting data at the midpoint of the
span. Use data tabulation table in Table 1.
13.5.3 Step the MFC’s setpoint to the upper setpoint
limit in the increments previously chosen; record data at
each setpoint.
13.5.4 After data is recorded at the upper setpoint limit,
step the setpoint to the lowest setpoint chosen, again
taking data at each of the intermediate setpoints.
13.5.4.1 If the lowest setpoint chosen is greater than
the lower setpoint limit, apply the lower setpoint limit
to the device and wait for five minutes. This allows
hysteresis to be calculated at the lowest setpoint chosen.
13.5.5 Continue collecting data, increasing the setpoint
until the midpoint of the span is reached again.
13.5.6 Perform the cycle described in Sections 13.5.1–
13.5.4 a total of three times.
13.6 Test for Deadband
13.6.1 Begin collecting data at the lowest setpoint
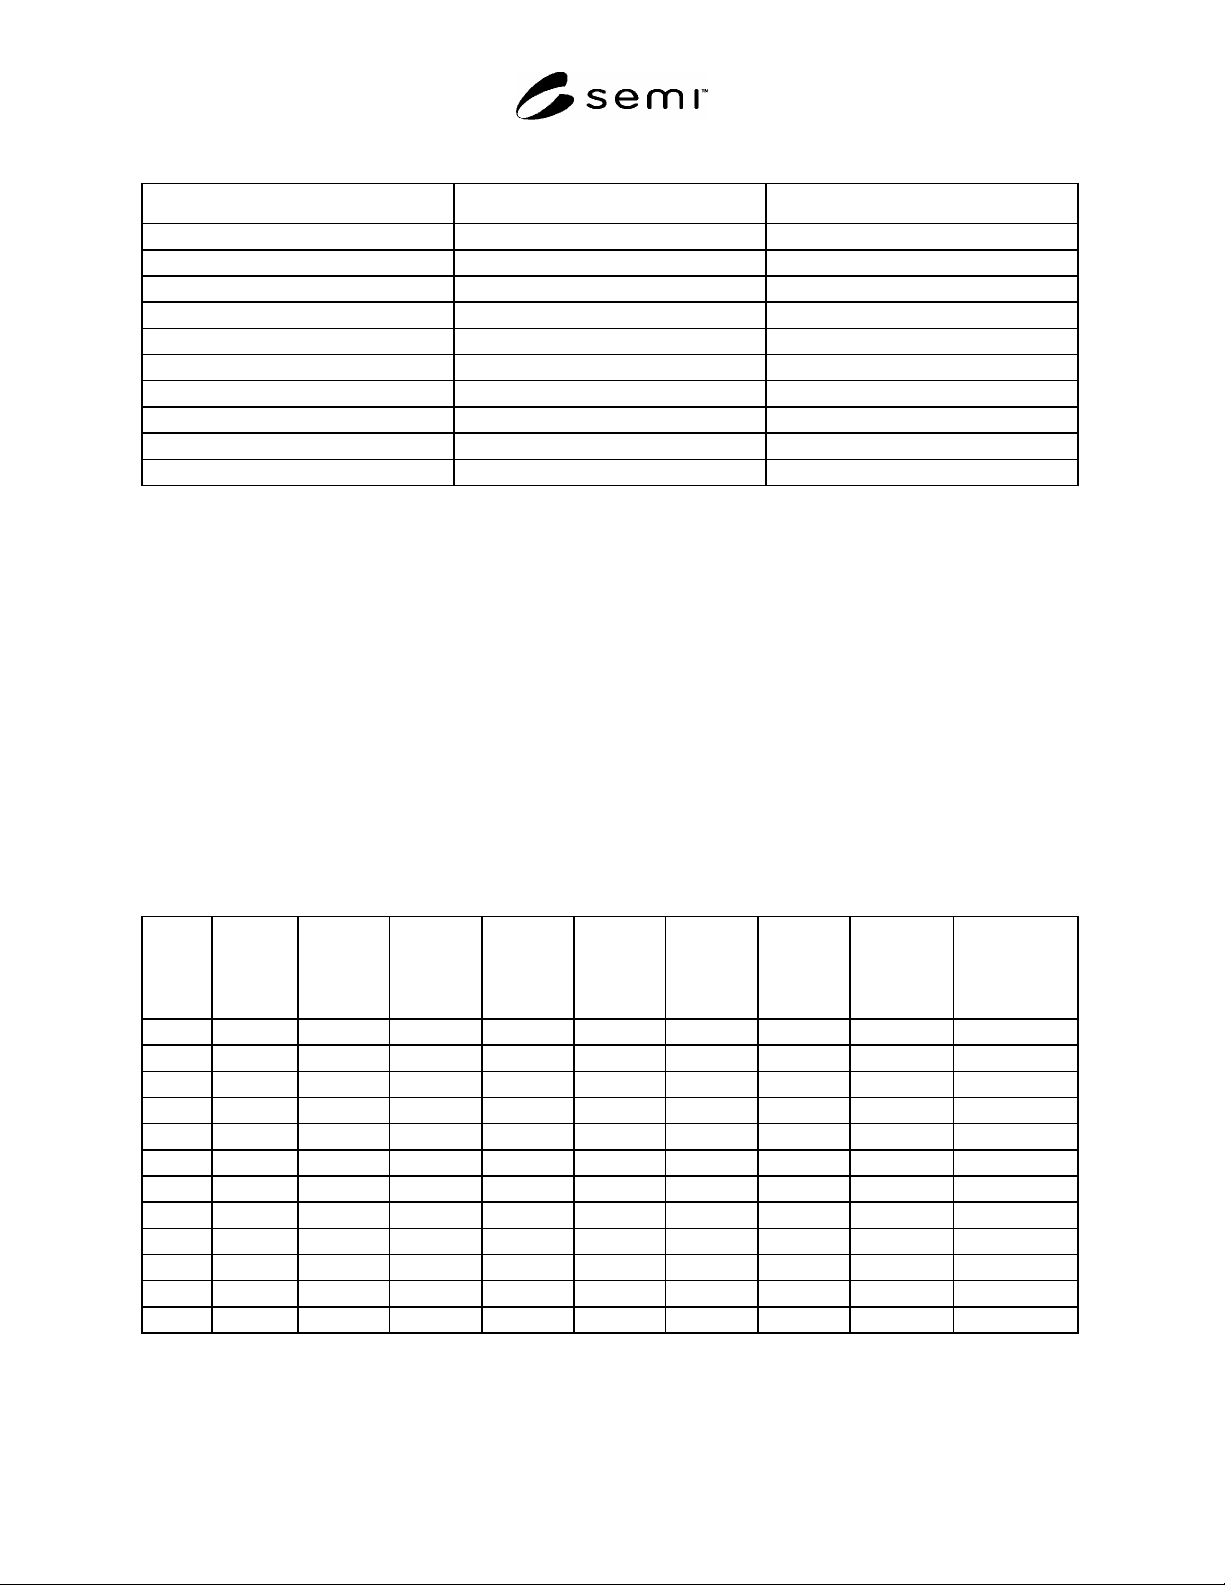
chosen. Record on Table 3.
SEMI E56-1104 © SEMI 1996, 2004 10
Table 3 Data Tabulation
Setpoint Lower Deadband (sccm) Upper Deadband (sccm)
10%
20%
30%
40%
50%
60%
70%
80%
90%
100%
13.6.2 Step the MFC’s setpoint to the highest setpoint chosen that is less than the upper setpoint limit in the
increments previously chosen; record data at each setpoint.
13.6.3 At each setpoint, slowly increase the setpoint signal to the DUT until a detectable flow output change is
observed in the flow standard.
13.6.4 Record the setpoint signal when the flow output changes and call this the upper deadband value.
13.6.5 Return to the setpoint selected in Section 13.6.3.
13.6.6 Slowly decrease the setpoint signal until a detectable flow output change is observed.
13.6.7 Record the setpoint signal and call it the lower deadband value. Use Table 3.
14 Data Analysis
14.1 Calculations
NOTE 4: NOTE: Record calculations on Table 4.
Table 4 Worksheet for Table 1
Setpoint
Up Ave.
Flow
(sccm)
Down Ave.
Flow
(sccm)
Up/Down
Ave. Flow
(sccm)
Precision
(sccm)
Bias
(sccm)
Accuracy
(%)
Linearity
(%)
Repeatability
Reproducibility
0
10
20
30
40
50
60
70
80
90
100
Over-all