semi合集-English.pdf - 第5332页
SEMI M51-0303 © SEMI 2002, 2003 10 12.4.1 Histogram and Weibul l plot of breakdown electric field 12.4.2 A verage of br eakdown voltage, br eakdown electric field 12.4.3 Breakdown mode yiel d (A-mode, B-mode and C-mode) …

SEMI M51-0303 © SEMI 2002, 2003 9
11 Calculations
11.1 Current and Current Density
11.1.1 To calculate the oxide leakage current (I) from
an oxide leakage current density (J), multiply the
current density by the area of gate contact (S) as
follows:
Symbolically:
I = J × S (1)
Example: Given a current density (J) of 1 µA/cm
2
and a
gate area (S) of 10 mm
2
, the current would be 100 nA.
Similarly, compute current density (J, [A/cm
2
]) from
measured current (I, [A]) and area (S, [cm
2
]) using.
J = I / S [A/cm
2
] (2)
11.2 Voltage and Electric Field Strength
11.2.1 To calculate voltage (V) from an electric field
(E), multiply the electric field strength by the gate oxide
thickness (T
ox
) as follows:
Symbolically:
V = E × T
ox
(3)
where:
T
ox
= Gate oxide thickness, cm
Example: Given an electric field (E) of 15 MV/cm and
a gate oxide thickness (T
ox)
of 25 nm, the voltage would
be 37.5 V.
Similarly, compute electric field (E, [MV/cm]) from
measured voltage (V, [V]) and gate oxide thickness
(T
ox
, [cm]) using.
E = V / T
ox
[MV/cm] (4)
11.3 Oxide Voltage
11.3.1 Neglect the flatband voltage shift. The flatband
voltage shift is due to gate-substrate work function
difference [Φ
ms
] and oxide fixed charge [Q
f
]. Although
it is better to consider this flatband voltage shift, its
influence on the oxide film thickness in the range
recommended is small.
11.4 Calculation of Defect Density
11.4.1 Calculate the defect density using the following
equation based on the Poisson distribution assumption
of the dielectric breakdown defects (see Standard
EIA/JEDEC 35):
ρ
ox
= -ln(1-F)/S (5)
where:
ρ
ox
= Defect density (defects/cm
2
)
F = Failure fraction for each oxide breakdown mode
S = Capacitor gate area (cm
2
)
Example: Given a total of 100 MOS capacitors tested,
with 30 B-mode-failed capacitors and a gate area of 10
mm
2
, the defect density would be as follows:
ρ
ox
= -ln(1-(30/100))/0.1 = 3.6 defects/cm
2
(6)
11.5 Weibull Distribution
11.5.1 To convert cumulative percent to Weibull
format (sometimes referred to as “smallest extreme
value probability distribution III”), use the following
equation:
ln(-ln(1-F)) (7)
where ln is the natural log operator and F is a percent of
the cumulative failures. Care shall be taken so that F is
never exactly 1 since this will be in an undefined
situation.
12 Report
12.1 Report the following for each wafer, as
appropriate for the test conditions and as agreed upon
by the parties to the test.
12.2 Test Description
12.2.1 Date
12.2.2 Time
12.2.3 Operator
12.2.4 Measurement system ID
12.2.5 Sample lot ID
12.2.6 Wafer ID
12.2.7 Average oxide thickness
12.2.8 Gate area (cm
2
)
12.2.9 Gate material
12.2.10 Oxidation parameters
12.2.11 Type of wafer (Ex: n or p)
12.2.12 Applied stress parameters
12.2.13 Test temperature
12.2.14 Process comment
12.3 Report the following for each capacitor.
12.3.1 Capacitor ID such as address
12.3.2 I–V character data
12.3.3 Breakdown voltage or Breakdown electric field
12.4 Report the following for each wafer.

SEMI M51-0303 © SEMI 2002, 2003 10
12.4.1 Histogram and Weibull plot of breakdown
electric field
12.4.2 Average of breakdown voltage, breakdown
electric field
12.4.3 Breakdown mode yield (A-mode, B-mode and
C-mode)
12.4.4 Breakdown mode map or E
bd
map
12.4.5 Result of calculated defect density
NOTICE: SEMI makes no warranties or
representations as to the suitability of the standards set
forth herein for any particular application. The
determination of the suitability of the standard is solely
the responsibility of the user. Users are cautioned to
refer to manufacturer's instructions, product labels,
product data sheets, and other relevant literature,
respecting any materials or equipment mentioned
herein. These standards are subject to change without
notice.
By publication of this standard, Semiconductor
Equipment and Materials International (SEMI) takes no
position respecting the validity of any patent rights or
copyrights asserted in connection with any items
mentioned in this standard. Users of this standard are
expressly advised that determination of any such patent
rights or copyrights, and the risk of infringement of
such rights are entirely their own responsibility.
SEMI M51-0303 © SEMI 2002, 2003 11
RELATED INFORMATION 1
OUTLINE OF ROUND ROBIN
NOTICE: This related information is not an official part of SEMI M51 and is not intended to modify or supersede
the proposed standard. It is provided for information purposes.
R1-1 MOS Structure
R1-1.1 Gate Oxide Thickness
R1-1.1.1 In this round robin, we evaluated the GOI of
MOS capacitors with a gate oxide film thickness of 25
nm on mirror-polished, p-type, CZ silicon wafers. In
the TZDB evaluation, a negative electric field was
applied step by step from 0 to 15 MV/cm, and an oxide
leakage current value was measured. When the oxide
leakage current first exceeded the dielectric breakdown
judgment value, we judged that the gate oxide film
dielectrically broke down.
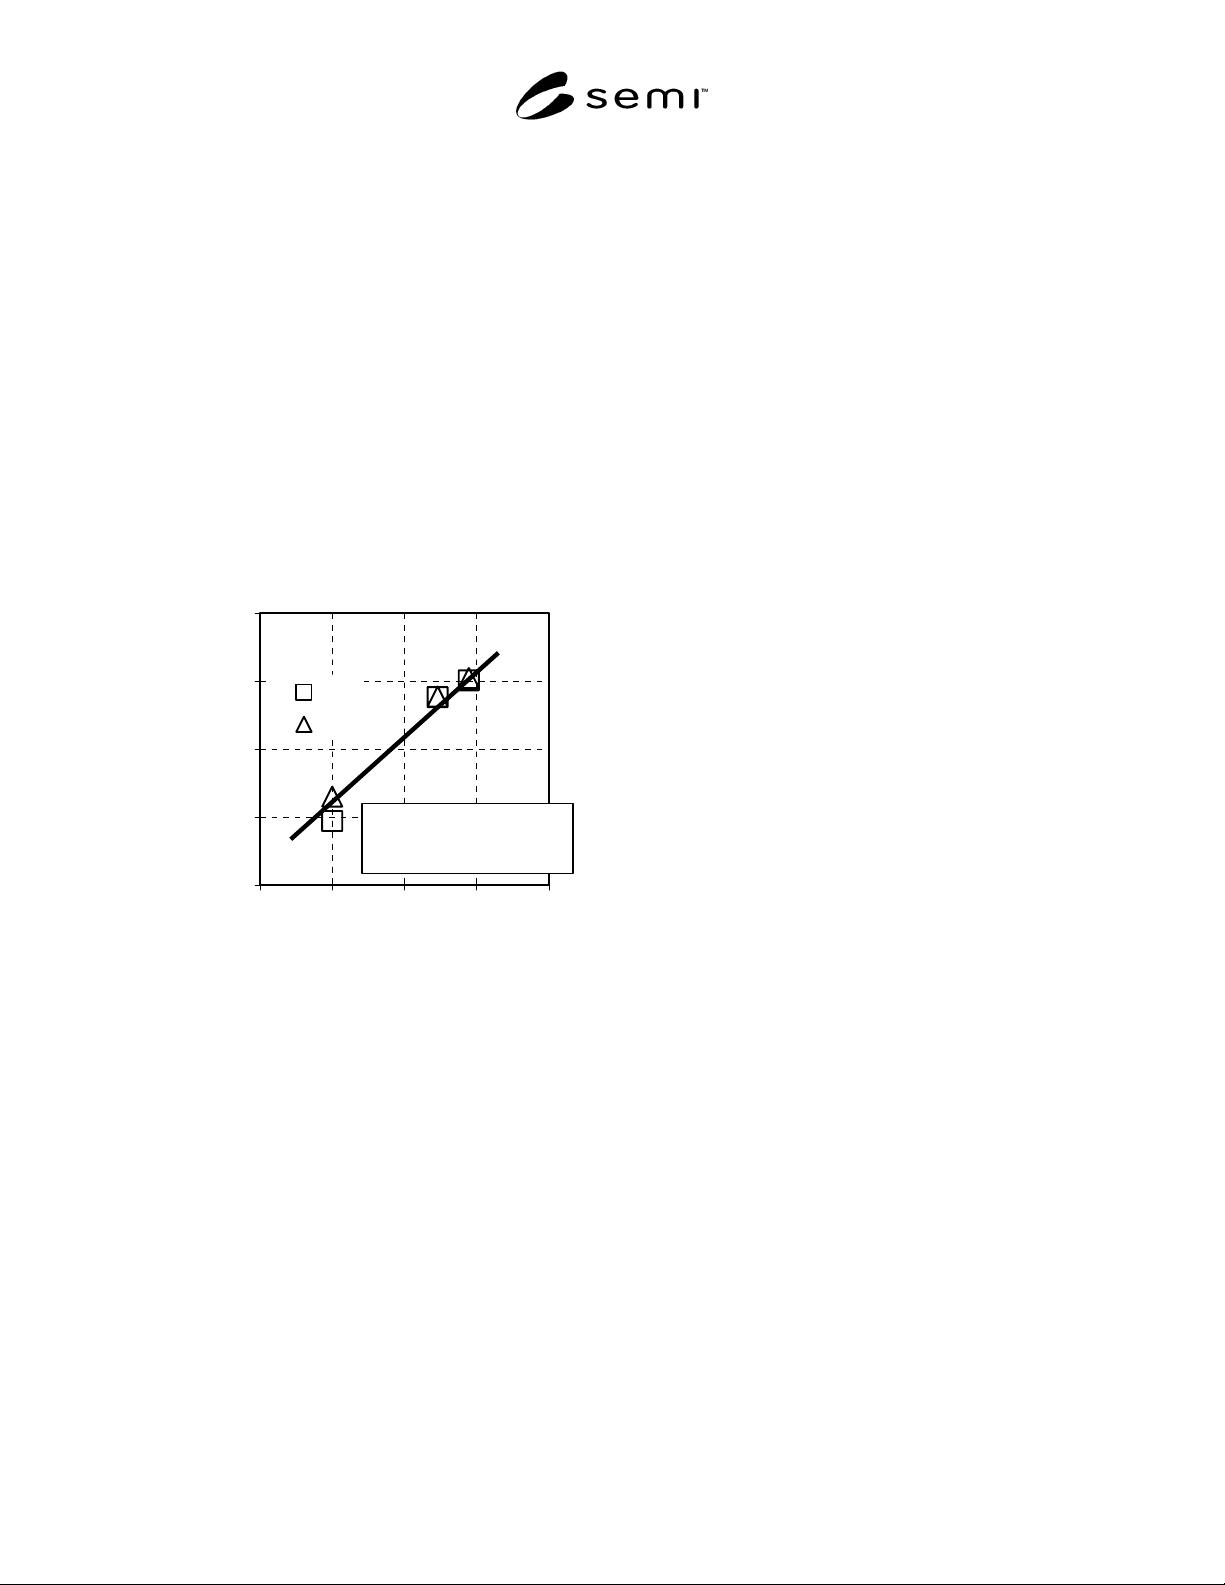
0.01
0.10
1.00
10.00
100.00
0.01 0.10 1.00 10.00 100.00
Defect Density by OPP [cm
-2
]
Defect Density by TZDB [cm
-2
]
C
G
OPP Defect Density (cm
-2
) =
OPP-data x 10
-5
cm
T
ox
= 25 nm
S
=
10 mm
2
Figure R1-1
The Relationship between B-Mode Defect Density by
TZDB and OPP
R1-1.1.2 The above graph shows the relationship
between the B-mode defect density of 25 nm thick
oxide by TZDB and the particles by optical precipitate
profiler (OPP). Here, based on an assumption that the
dielectric breakdown defect is in conformance with the
Poisson distribution, the defect density by TZDB of 25
nm thick oxide, ρ, was calculated from the dielectric
breakdown failure fraction of TZDB, F, as follows.
ρ
ox
= -ln(1 – F)/S (8)
Here, S is a gate electrode area of the evaluated MOS
capacitors.
R1-1.1.3 The defect density was obtained by the B-
mode failure percent, F, of TZDB. On the other hand,
estimation of the defect density by OPP was carried out
as follows. The OPP defects were measured in the
wafers at the same position (ingot) of the same Si
crystal as the sample wafers. The density of COPs
which appeared on the silicon wafer surface was
estimated from the volume defect density, n(cm
-3
), and
the COP diameter, L(cm). The area density of the
defects which appear at the silicon surface can be
estimated with n × L, assuming that the COP diameter,
L, is almost uniform and the volume defect density, n,
is uniformly distributed. Here, 0.1 µm was used as the
L value
7
and the measurement results of the OPP
technique as the n value. The resulting OPP defect
densities, by which each of the three kinds of silicon
wafers, H, M, and L, was characterized, were as
follows.
H: n = 7.83 × 10
5
(cm
-3
) ⇒ ρ
ox
= 7.8(cm
-2
)
M: n = 2.89 × 10
5
(cm
-3
) ⇒ ρ
ox
= 2.9(cm
-2
)
L: n ≤ 1 × 10
4
(cm
-3
) ⇒ ρ
ox
≤ 0.1(cm
-2
)
In the above graph, C and G are the measurement
results for MOS capacitors made by two different wafer
vendors. The defect density by TZDB and the defect
density by OPP can be seen to be in a relation of almost
1:1 in this figure. These facts mean that the B mode
failure of the 25 nm thick gate oxide is mainly
attributable to the COPs that appear at the silicon wafer
surface. Moreover, these results indicate that this
standard test method can give us an evaluation of the
oxide defect densities over the wide range of COP
defect density with excellent reproducibility.
R1-1.2 Total Number and Electrode Area of Measured
MOS Capacitors
R1-1.2.1 To measure the defect density with a high
degree of accuracy, a large number of MOS capacitors
with a large electrode area shall be measured.
However, measurement of too large an area or too
many MOS capacitors leads to unnecessary evaluation
load. The appropriate area size and the total number of
MOS capacitors needed to evaluate the defect density at
the silicon wafer surface shall be selected according to
the foreseen defect density and the purpose of the
evaluation. For instance, if the purpose is to evaluate a
conventional, mirror-polished, CZ silicon wafer with a
defect density of 1–10/cm
2
, about 100 MOS capacitors
with an electrode area of 10–20 mm
2
must be measured.
R1-1.2.2 When the Poisson's distribution is assumed as
a defect distribution, as mentioned above, the yield, Y,