semi合集-English.pdf - 第3974页
SEMI F42-0600 © SEMI 199 9, 2000 6 the pow er supply output begins t o decay 3 cy cles (60/50 ms) i nto the 5 5% o f no minal sa g event , ca using t he DUT to interrupt. -2 0 0 -1 0 0 0 100 200 Sec ond s Generator Out p…

SEMI F42-0600 © SEMI 1999, 20005
duration regardless of the voltage magnitude, or, the
test is conducted at the defined minimum voltage
magnitude without equipment interrupt.
10.1.4 Based on the knowledge gained in the study of
the DUT and the purpose of the test, the test engineer
should prepare a specific Test Plan that references this
test method with date of issue and includes, at a
minimum:
• identify the most sensitive process mode and the
process mode(s) to be used during tests
• minimum sag voltage to be applied (e.g. 0%, 50%,
etc.)
• sag voltage incremental change not greater than 5%
(e.g. 5%)
• maximum sag duration at each sag voltage (e.g.
determined by voltage sag ride-through
specification, potential for DUT damage, etc.)
• sag test durations (e.g. 0.05, 0.2, 0.5, 1.0 seconds)
• phase modes required (e.g. phase-to-neutral, phase-
to-phase)
• point-on-wave of the sags (location on the sine
wave where voltage sag begins): if controllable,
set at 0°. If not controllable, noted as such.
• data acquisition measurement points (e.g. Table 3).
10.2 The following test procedure should be
conducted in both the DUT idle state and the DUT’s
most sensitive process mode (see Section 8.2).
10.3 The following test procedure should be
conducted with the sags applied in each phase mode
identified in the Test Plan (see Section 10.1.4).
10.3.1 For single-phase loads, the sags should be
applied from phase-to-neutral, for a total of one mode.
10.3.2 For three-phase loads without a neutral con-
ductor, the sags should be applied from phase-to-phase
between each pair of phases, for a total of three modes.
10.3.3 For three-phase loads with a neutral conductor,
the sags should be applied from phase-to-neutral for
each phase, and from phase-to-phase between each pair
of phases, for a total of six modes.
10.4 Using a DVM, measure and record the actual test
site voltages at the line side of the sag generator, phase-
to-neutral (if available) and phase-to-phase (if
available).
10.5 Verify that the test setup is complete (see Section
9).
10.6 Set the sag generator to 100% of the DUT
nameplate nominal voltage. Cycle through the
following test procedure.
10.6.1 Set the sag generator to the next lower sag volt-
age based on the sag voltage increment determined in
the Test Plan, not greater than 5% (see Section 10.1.4).
10.6.2 Set the sag generator to the minimum sag
duration for this sag voltage in the Test Plan (see
Section 10.1.4).
10.6.3 Trigger the sag event. Record the results,
including the magnitude (sag depth) and duration.
NOTE 6: It is advantageous to record additional detail, such
as DAS waveforms, if a DUT interruption occurs.
10.6.4 Set the sag generator to the next longer sag
duration for this sag voltage in the Test Plan (see
Section 10.1.4)
10.6.5 Trigger the sag event. Record the results,
including the magnitude (sag depth) and duration.
10.6.6 Repeat Sections 10.6.4 thru 10.6.5 until all
durations are complete for this sag voltage magnitude
per the Test Plan, then, continue to Section 10.6.7.
10.6.7 Repeat Sections 10.6.1 thru 10.6.6 until all sag
voltage magnitudes are complete for this phase mode
per the Test Plan, then, continue to Section 10.6.8.
10.6.8 If required, reconfigure the test setup for the
next phase mode and repeat Sections 10.6.1 thru 10.6.7
until the test is complete for all phase modes, then,
continue to Section 10.6.9.
10.6.9 If required, return the test setup to the original
phase mode and repeat Sections 10.6.1 thru 10.6.8 until
the test is complete for all process modes (e.g. idle
state, most sensitive process mode).
11 Interpretation of Test Res ults
11.1 The injection of voltage sags into semiconductor
equipment can lead to numerous shutdown mechan-
isms. Typical semiconductor equipment voltage sag
shutdown mechanisms include EMO circuitry, instru-
ment and controller power supplies, motion control
drives, and voltage monitoring relays.
11.2 The shutdown or dropout of equipment
components is best identified when monitored by a
DAS that is tightly coupled to the control of the sag
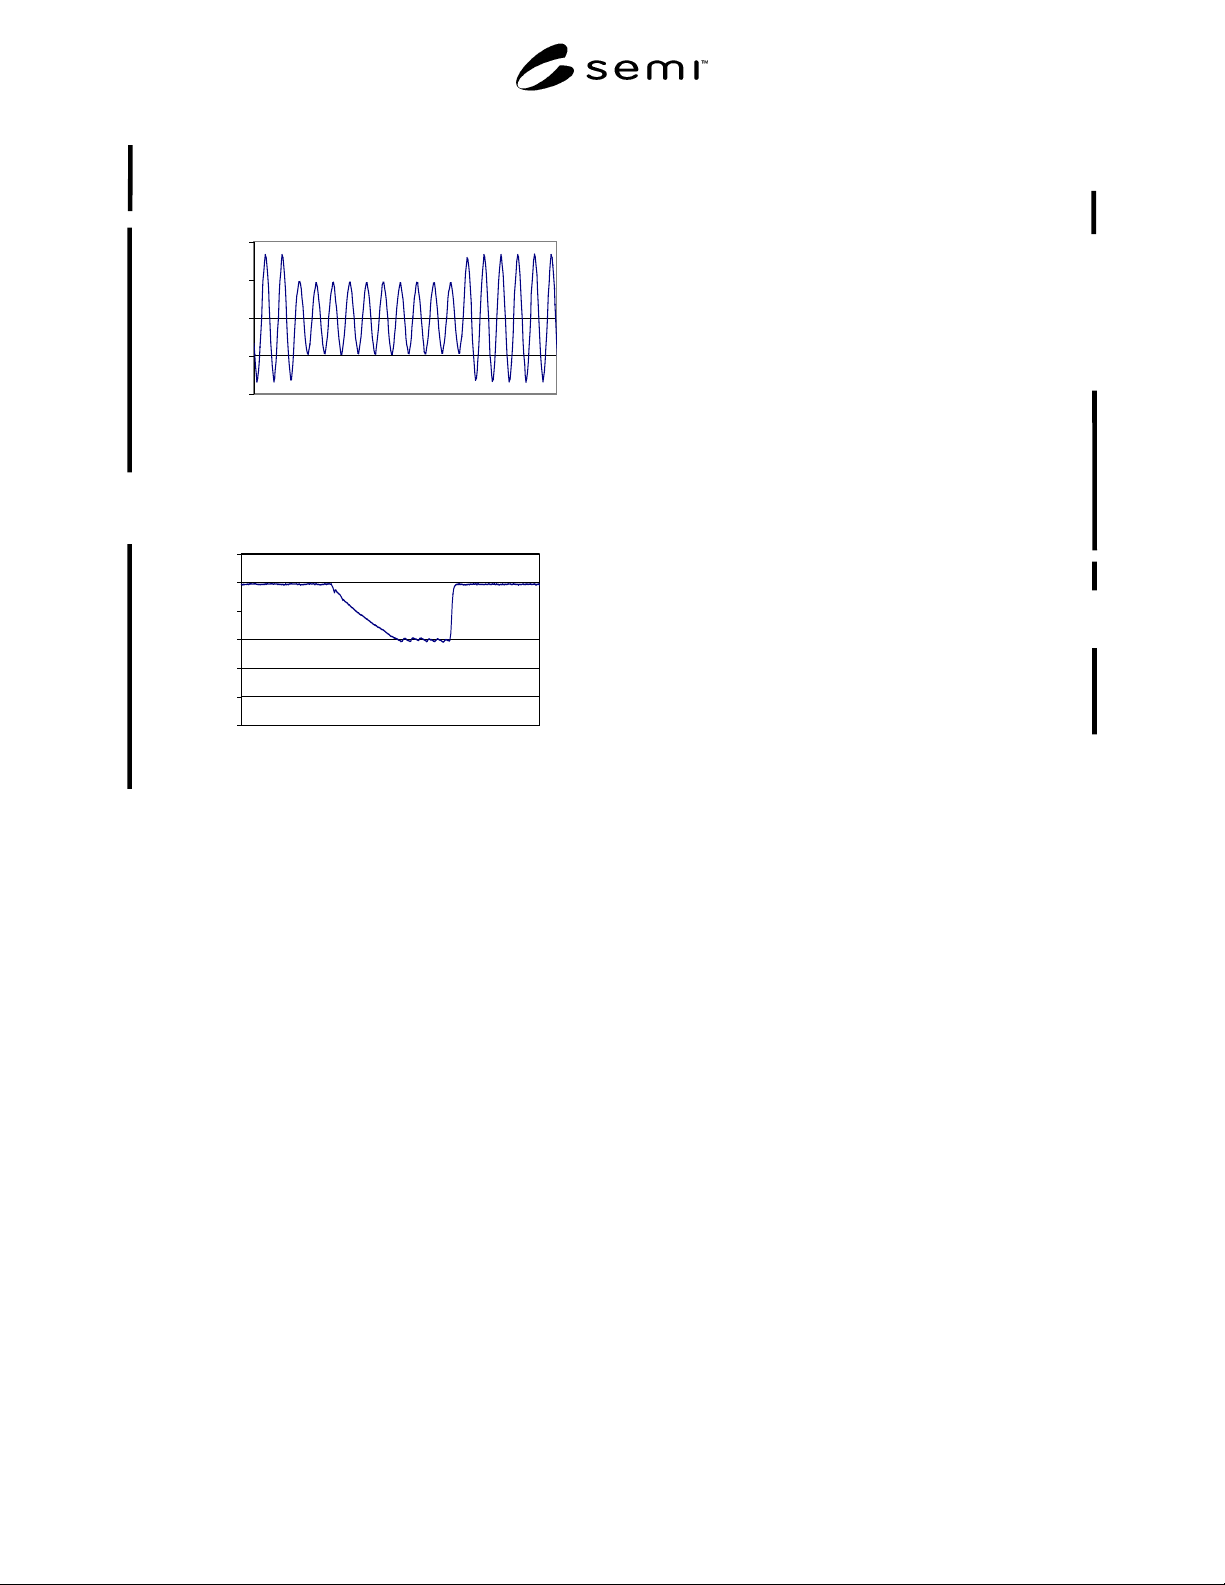
generator. Figures 2 and 3 display the shutdown of a
power supply during a 55% of nominal 10-cycle
(200/167 ms) voltage sag.
11.3 Figure 2 displays the actual voltage sag output
from the sag generator and Figure 3 displays the output
of the power supply. With the DAS it can be seen that
SEMI F42-0600 © SEMI 1999, 2000 6
the power supply output begins to decay 3 cycles (60/50
ms) into the 55% of nominal sag event, causing the
DUT to interrupt.
-200
-100
0
100
200
Second
s
Generator Out
p
ut
Figure 2
Sag Generator Output
0
1
2
3
4
5
6
Second
s
P/S Out
p
ut
Figure 3
Power Supply Voltage Sag Shut Down Example
12 Reporting Test Results
12.1 Report the specific test plan used and, if used, the
voltage sag ride-through specification.
12.2 Report the manufacturer, model number, revision
(if known) and process application for the DUT.
12.3 Report the type of sag generator and the accuracy
of the test apparatus.
12.4 Report the outcome of the voltage sag testing in
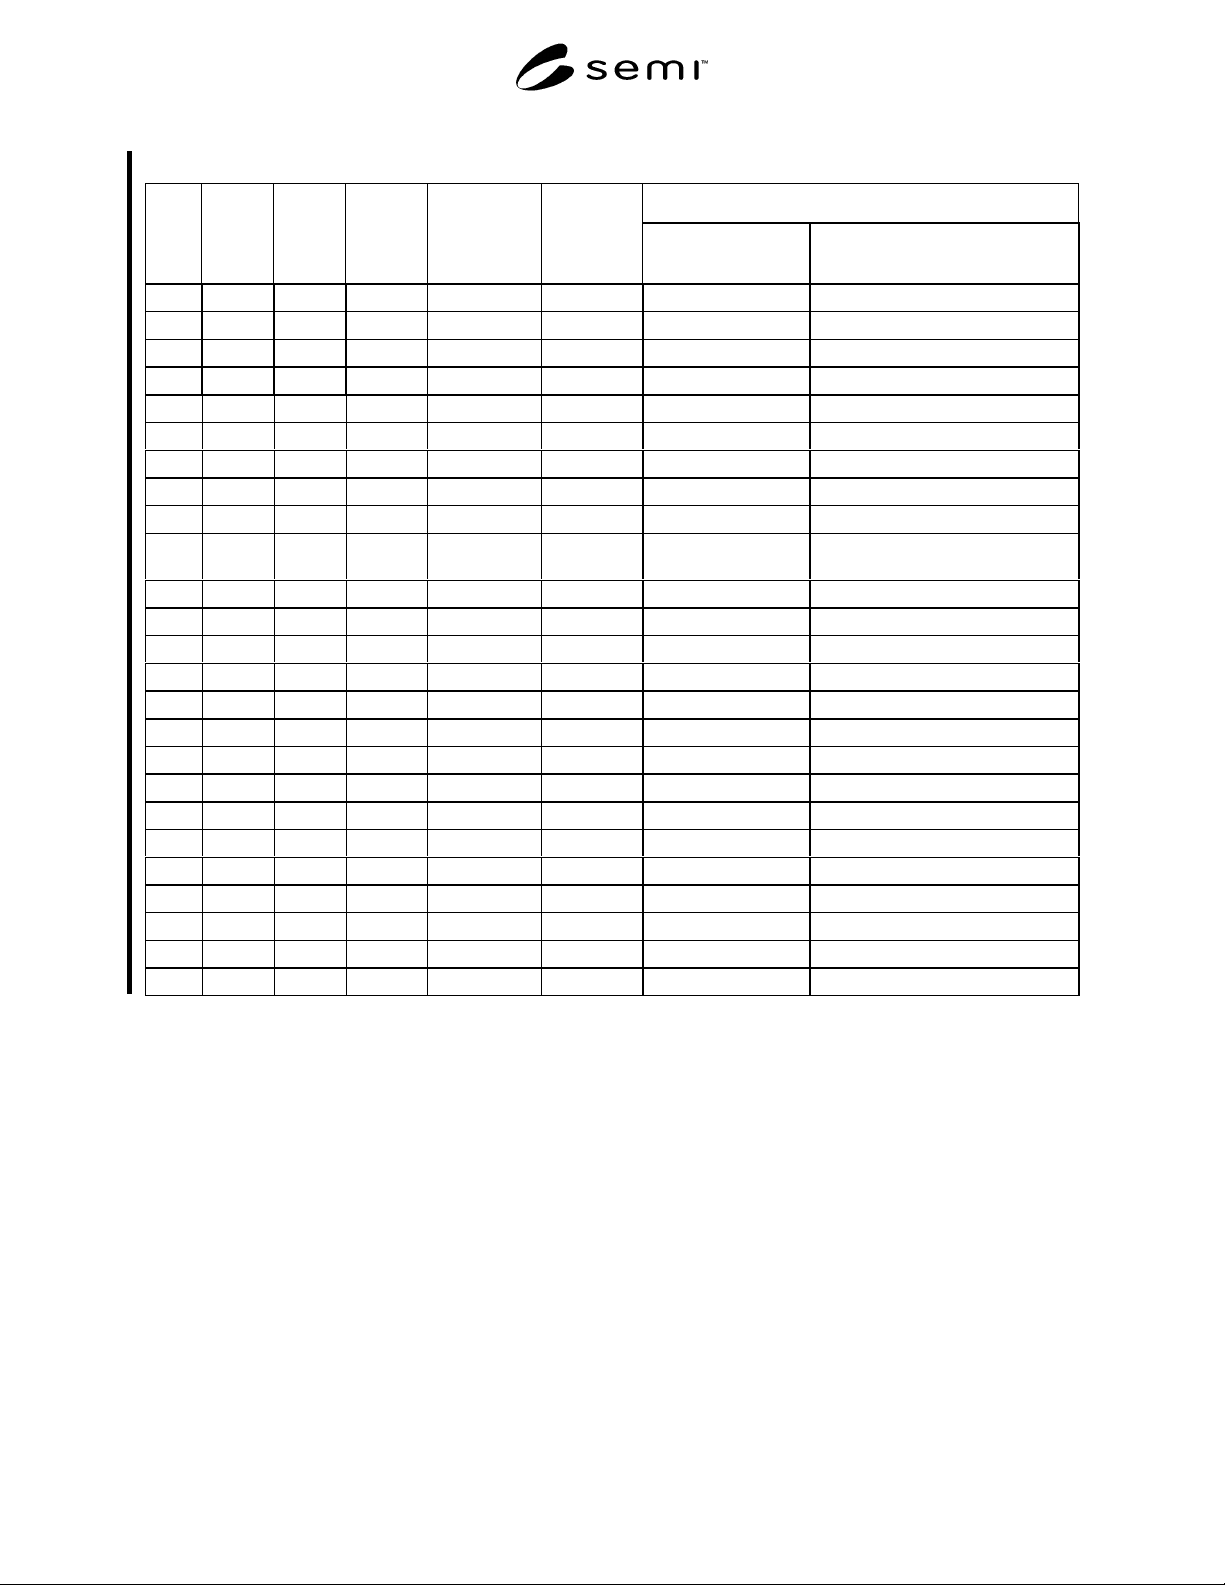
both a tabular form (see Tables 4 and 5) and plotted on
a graph(s), voltage magnitude (Y axis) and duration (X
axis). Separate graphs should be plotted in order to
represent the results of the single-phase testing and the
phase-to-phase testing. If used, overlay a plot of the
voltage sag ride-through specification onto the voltage
sag testing outcome graph(s) (see Figures 4 and 5).
12.5 Report the outcome of the sag event including the
cause of the DUT interrupt (e.g., EMO relay dropped
out, power supply shutdown, etc.).
12.6 Report conclusions of voltage sag immunity
testing of the DUT (e.g., Key immunity data points,
compliance/non-compliance with voltage sag ride-
through specification, corrective actions taken, etc.).
SEMI F42-0600 © SEMI 1999, 20007
Table 4 Example of Test Data Sheet for Characterizing to Voltage Sag Ride-Through Specification Limits
Result
Event % Va-n % Vb-n % Vc-n DUT Mode
(Idle or
Processing)
Voltage Sag
Duration
Actual Time to
Interrupt (Seconds)
Comments
1 95 100 100 Processing 0.05 OK Equipment OK.
2 95 100 100 Processing 0.20 OK Equipment OK.
3 95 100 100 Processing 0.50 OK Equipment OK.
4 95 100 100 Processing 1.00 OK Equipment OK.
5 90 100 100 Processing 0.05 OK Equipment OK.
6 90 100 100 Processing 0.20 OK Equipment OK.
7 90 100 100 Processing 0.50 OK Equipment OK.
8 90 100 100 Processing 1.00 OK Equipment OK.
↓↓ ↓ ↓ ↓ ↓ ↓ ↓
34 55 100 100 Processing 0.20 0.16 Equipment Shutdown: EMO Relay
CR1 dropout
35 55 100 100 Processing 0.50 INT No Test - Beyond Interrupt
36 55 100 100 Processing 1.00 INT No Test - Beyond Interrupt
37 50 100 100 Processing 0.05 OK Equipment OK.
38 50 100 100 Processing 0.20 0.16 Same result as event 34.
↓↓ ↓ ↓ ↓ ↓ ↓ ↓
77 100 50 100 Processing 0.05 OK Equipment OK.
78 100 50 100 Processing 0.20 OK Equipment OK.
79 100 50 100 Processing 0.50 OK Equipment OK.
80 100 50 100 Processing 1.00 OK Equipment OK.
↓↓ ↓ ↓ ↓ ↓ ↓ ↓
117 100 100 50 Processing 0.05 OK Equipment OK.
118 100 100 50 Processing 0.20 OK Equipment OK.
119 100 100 50 Processing 0.50 OK Equipment OK.
120 100 100 50 Processing 1.00 OK Equipment OK.