semi合集-English.pdf - 第7323页
SEMI MF1239-0305 © SEMI 2003, 2005 5 A Apply only to interpretation by Method 2 (see ¶12.2. 2). B Average and standard deviation of initial O i and O i reduction apply only to interpre tation by Method 1 (see ¶ 12.2.1). …

SEMI MF1239-0305 © SEMI 2003, 2005 4
7.5 Facilities for cleaning and drying wafers by a standard process as customarily used in the laboratory performing
the test.
7.6 Scribe or Laser Marker — For marking the wafers with unique identification (unless premarked wafers are
available).
8 Reagents and Materials
8.1 Hydrofluoric Acid — In accordance with SEMI C28, Grade 1.
8.2 Oxygen — In accordance with grade 2.5 of SEMI C54.
8.3 Nitrogen — In accordance with grade 5.2 of SEMI C59.
8.4 Deionized Water — With purity equal to or greater than that specified for Type E-1 in ASTM Guide D 5127.
9 Hazards
9.1 The acids used in these test methods are hazardous. All precautions normally used with these chemicals should
be strictly observed. Obtain and read the material safety data sheet prior to use of any chemical.
10 Selection and Preparation of Test Specimens
10.1 Choose test wafers from each group being tested in such a way as to cover the entire range of oxygen
concentration found in the group. Choose at least two wafers with oxygen concentration in each 0.5 ppm (IOC-88)
4
interval in the range. For example, if the oxygen concentration range of a group is 3 ppma, at least 12 wafers from
that group should be tested.
10.2 Select or prepare test wafers with thickness, resistivity, and surface finish as required by the oxygen test
method being used.
10.3 Identify each test wafer individually with an alphanumeric laser marking or a hand scribed code unless pre–
marked wafers are used.
10.4 Prepare the wafers in accordance with SEMI MF1188, SEMI MF1619, DIN 50 438/1, or JEITA EM-3504, as
applicable.
11 Procedure
11.1 Determine the initial interstitial oxygen concentration of each wafer to be tested at the center in accordance
with SEMI MF1188, SEMI MF1619, DIN 50 438/1, or JEITA EM-3504. If desired, measure the interstitial oxygen
concentration at other locations on each wafer as specified by an appropriate pattern in SEMI MF951. Record the
oxygen value(s), the wafer identification, and measurement locations. Record the date of the test and the instrument
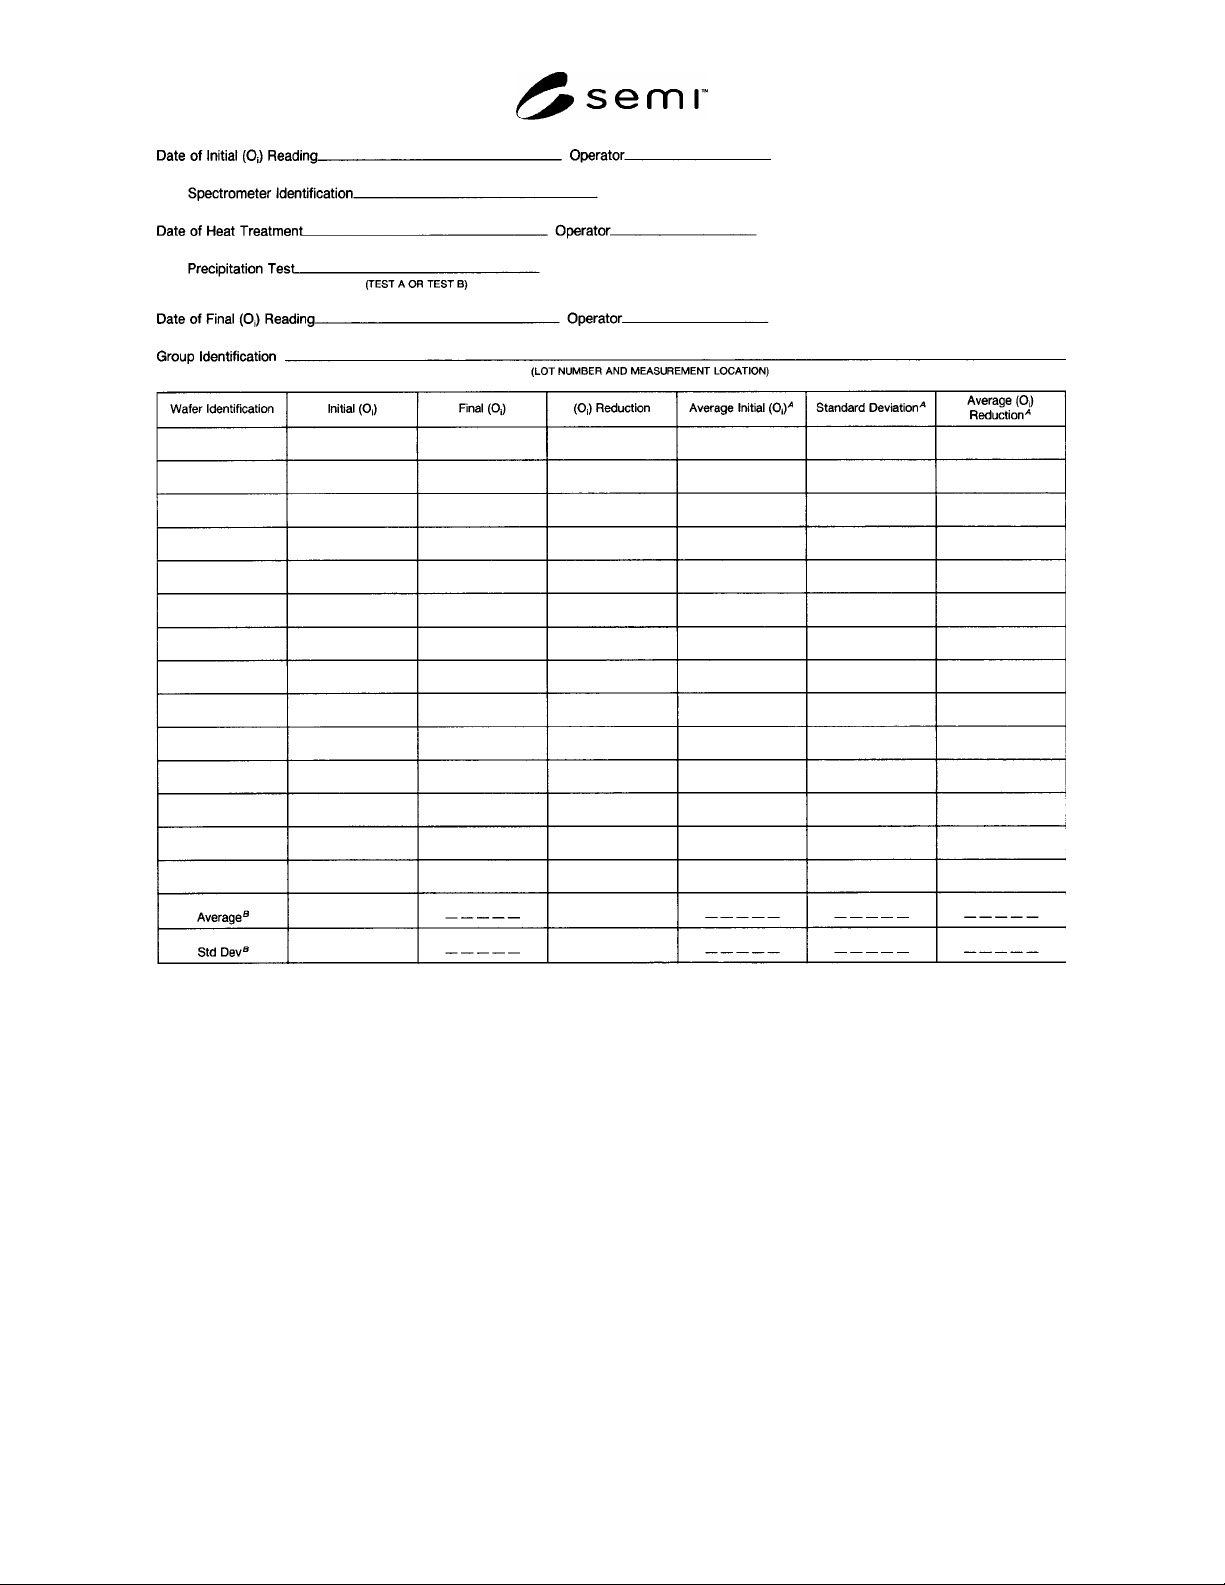
used in measuring the oxygen concentration. See Figure 1 for a suggested data sheet format.
11.2 Clean and dry the wafers in accordance with the usual wafer cleaning procedure employed by the laboratory
performing the test.
11.3 Process the samples as soon after cleaning as possible. If the samples must be stored between cleaning and
processing, store in clean covered cassettes.
11.4 Heat-treat in accordance with Cycle A or Cycle B, (see Table 1). Record the date of the heat treatment and the
cycle used.
11.5 Strip the surface oxide from the wafers with hydrofluoric acid (HF), and thoroughly clean and dry them with
the usual wafer cleaning procedure employed by the laboratory performing the test.
11.6 Measure the post-heat treatment interstitial oxygen concentration at each point measured before heat treatment.
Use the same instrument, test method, and set up for this measurement as was used for the initial measurement.
Record each final oxygen concentration on the same data sheet as was used to record initial oxygen concentration.
4 As defined in SEMI MF1188, SEMI MF1619, DIN 50 438/1, or JEITA EM-3504.
SEMI MF1239-0305 © SEMI 2003, 2005 5
A
Apply only to interpretation by Method 2 (see ¶12.2.2).
B
Average and standard deviation of initial O
i
and O
i
reduction apply only to interpretation by Method 1 (see ¶12.2.1).
Figure 1
Suggested Data Sheet Format
12 Calculations and Interpretation of Results
12.1 Subtract each final oxygen concentration value from the corresponding initial oxygen concentration value to
determine the oxygen reduction. Record the oxygen reduction.
12.2 Interpret the results by Method 1 or Method 2 as follows:
12.2.1 Method 1
12.2.1.1 Use this method when the desired target oxygen concentration is already known, when each group tested
has the same target oxygen concentration, and when the range of oxygen concentration values measured in each
group has a range less than 4 ppma (IOC-88). This method cannot be used if the average initial oxygen
concentrations of the groups tested differ by more than 0.5 ppma (IOC-88).
4
12.2.1.2 Determine the averages and standard deviations of the initial oxygen concentration and oxygen reduction
for each group of wafers tested.
SEMI MF1239-0305 © SEMI 2003, 2005 6
12.2.1.3 If the average oxygen reduction values of the groups tested agree to within a desired amount, consider the
groups equivalent.
12.2.2 Method 2
12.2.2.1 Use this method to de-couple oxygen content and precipitation behavior to obtain (1) a qualitative
overview of the precipitation characteristics of the groups tested and (2) the important features of the characteristic
precipitation curve.
12.2.2.2 Bin the oxygen reduction data for each group so that all wafers with oxygen concentration within each 0.5
ppma interval are included in the same bin.
12.2.2.3 Calculate the average of the initial oxygen concentration and the oxygen reduction for each bin in each
group.
12.2.2.4 Plot the average oxygen reductions against average initial oxygen concentrations for each group tested.
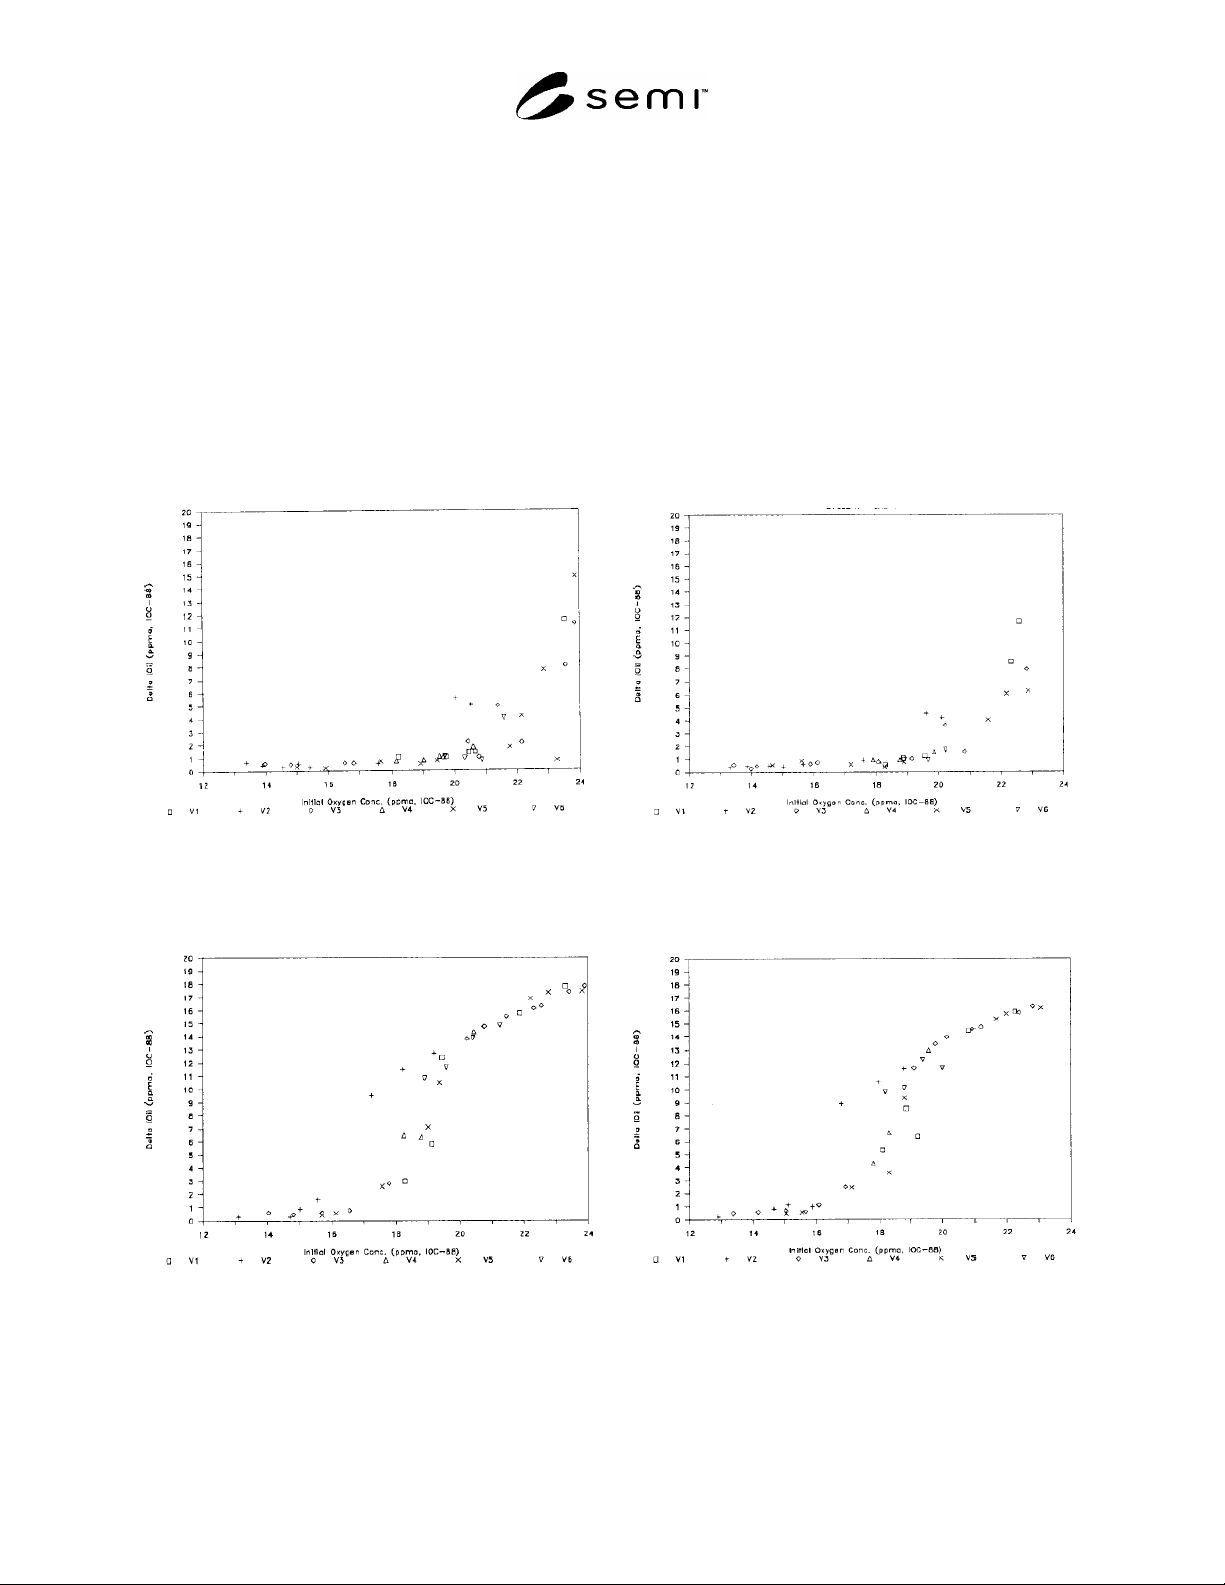
Use a different symbol to distinguish the data for each group. See Figures 2 through 5 for examples of such plots.
Figure 2
Oxygen Reduction in Wafers from Six Groups (V1
to V6) Following Exposure to One-Step Cycle A as
Measured by Laboratory 3
Figure 3
Oxygen Reduction in Wafers from Six Groups (V1
to V6) Following Exposure to One-Step Cycle A as
Measured by Laboratory 4
Figure 4
Oxygen Reduction in Wafers from Six Groups (V1
to V6) Following Exposure to Two-Step Cycle B as
Measured by Laboratory 3
Figure 5
Oxygen Reduction in Wafers from Six Groups (V1
to V6) Following Exposure to Two-Step Cycle B as
Measured by Laboratory 4
12.2.2.5 Note that the curves have three characteristic regions, as illustrated by distinct slope change in Figure 4 and
Figure 5. At low initial oxygen concentration, there is essentially no oxygen reduction; at some value of initial