semi合集-English.pdf - 第4025页
SEMI F50-0200 © SEMI 2000 3 3 Limitations 3.1 This gui de addr esse s ele ctric u t i lity p o w er qu ality monito ri ng and enhanc eme nt tec hniq ues p ri maril y related to semiconductor factor y energy utilit y prov…
SEMI F50-0200 © SEMI 2000 2
Utility Supplied
Power
Facilities
Electrical
Distribution
System
Infrastructure
Equipment
Process
Equipment
Support
Equipment
Utilit
y
Services
Facilities
Systems
Wafer
Processing
Systems
Power Monitoring
and Conditioning
Power Monitoring
and Conditioning
Ride-Through
Techniques
Covered in this
guide
for electric utility
voltage sag
performance
See industry guide for
semiconductor factory systems
voltage sag immunity.
See industry specification and
test method for semiconductor
processing equipment voltage
sag immunity.
Ride-Through
Techniques
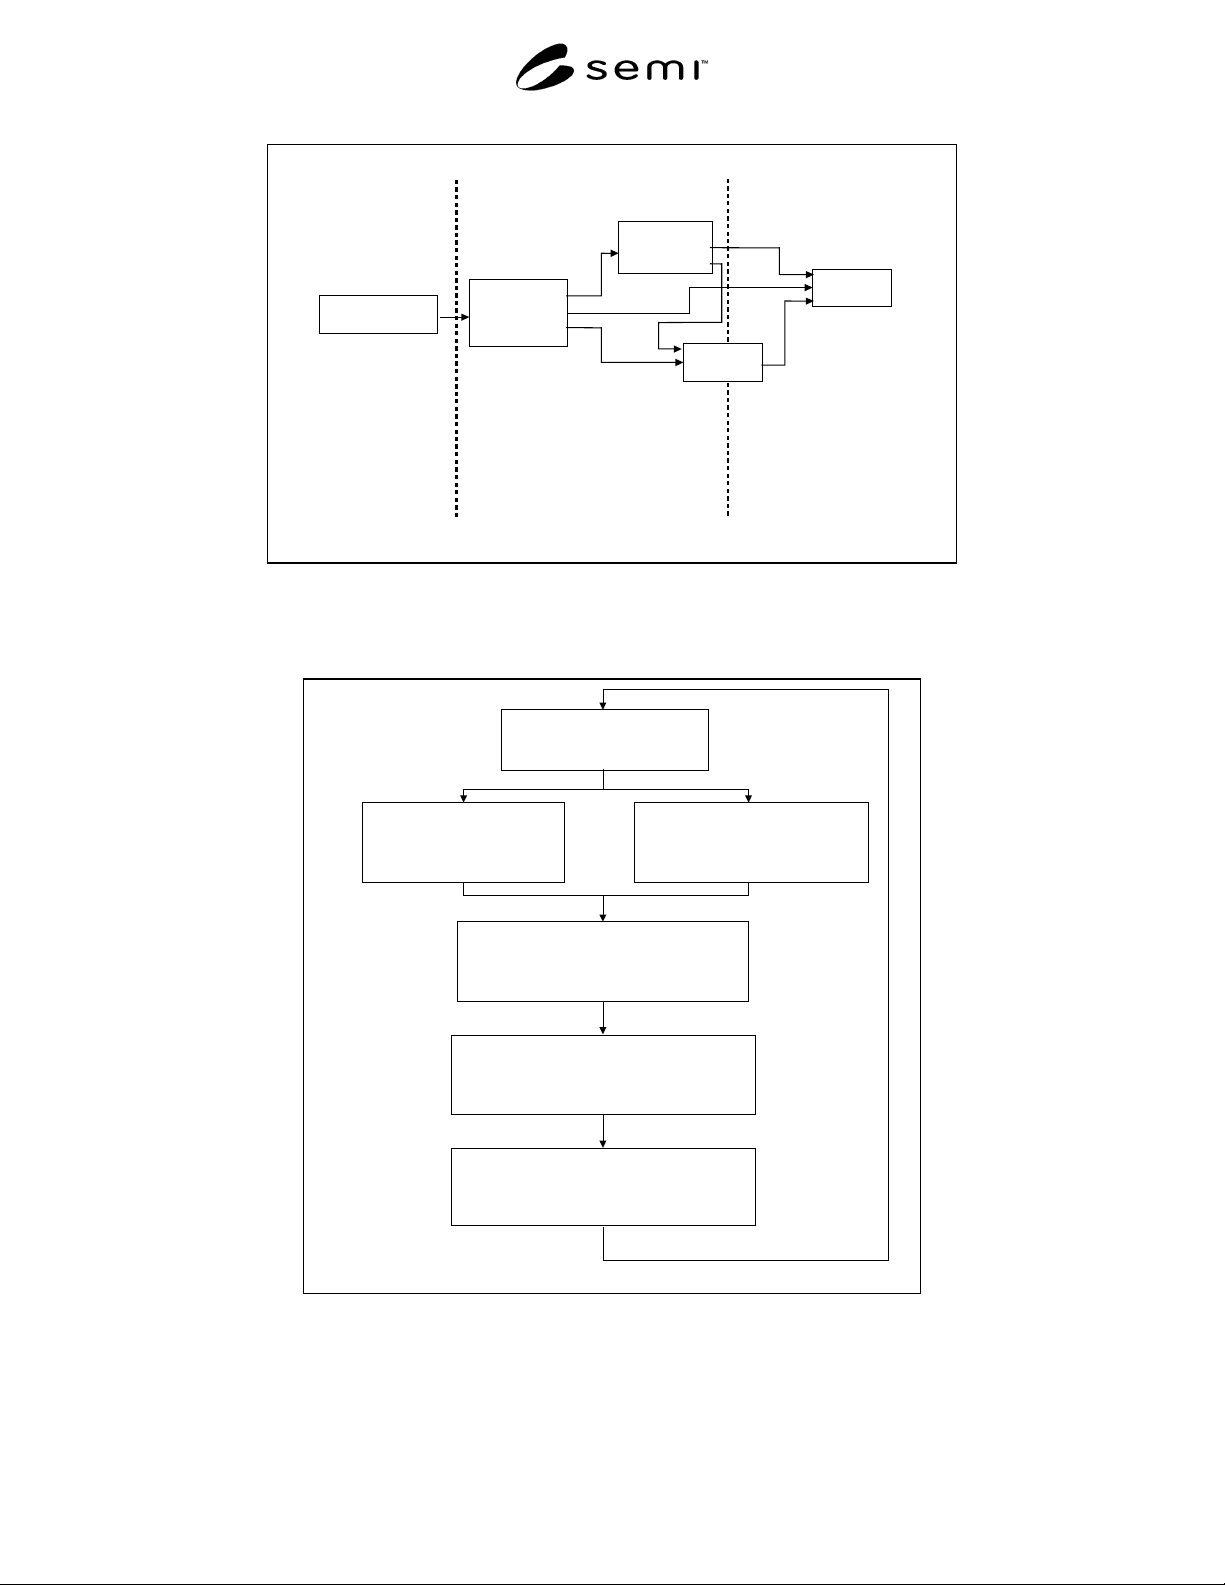
Figure 1
Power Quality Interfaces
(See Related Documents section.)
Define Desired Performance
- Voltage Sag Magnitude/Duration
- Maximum Deviations per Year
Existing Sites
-
Define Monitor Protocol
- Monitor Performance
- Track and Report Events
Proposed Sites
- Define Site Selection Factor
- Monitor near Proposed Site
- Model Events
Summarize and Evaluate Dat
a
- Chart Data
- Correlate Events to Impact on Factory
- Categorize Events within Bins
Recommend Improvements
- Corrective Actions for System Faults
- Identify Service Configurations
- Review Enhancement Technologies
Select and Implement Improvements
-
Prioritize System Improvements
- Identify Action Plan and Define Expectations
- Implement Solutions
Figure 2
Continuous Improvement Process

SEMI F50-0200 © SEMI 20003
3 Limitations
3.1 This guide addresses electric utility power quality
monitoring and enhancement techniques primarily
related to semiconductor factory energy utility
providers. Process equipment and factory systems are
covered in other related standards.
3.2 This standard is not intended to address design or
materials issues related to safety which are addressed
elsewhere in the SEMI guidelines (see SEMI S2).
3.3 This document is not intended to supersede
international, national or local codes, regulations and
laws. Each should be consulted to ensure that the
equipment meets regulatory requirements in each
location.
4 Referenced Standards
4.1 SEMI Standards
SEMI S2 — Environmental, Health, and Safety
Guideline for Semiconductor Manufacturing Equipment
4.2 IEEE Standards
1
IEEE 1159 — IEEE Recommended Practice for
Monitoring Electric Power Quality
IEEE 1250 — IEEE Guide for Service to Equipment
Sensitive to Momentary Voltage Disturbances
IEEE 1346 — IEEE Recommended Practice for
Evaluating Electric Power System Compatibility with
Electronic Process Equipment
NOTE 1: As listed or revised, all documents cited shall be the
latest publications of adopted standards.
5 Terminology
5.1 electric utility — the company identified as the
contractual provider of electrical power and energy to
the customer point of delivery. Also known as the
electric service provider.
5.2 voltage sag — an rms reduction in the ac voltage
at power frequency for durations from half-cycle to a
few seconds (see IEEE 1250). Also known as voltage
dip.
6 Electric Utility Voltage Sag Performance
Recommendations
6.1 Define Voltage Sag Performance
6.1.1 Defining a goal for acceptable voltage sag
duration and magnitude is useful in establishing a
benchmark or reference point for monitoring
1 The Institute of Electrical and Electronic Engineers, Inc., 345 East
47th Street, New York, NY 10017-2394, USA
improvement. Events can be identified and categorized
within the realm of the electric utility or the
semiconductor manufacturer. Industry specifications
for semiconductor processing equipment voltage sag
immunity (which define the level of voltage sag
immunity required for semiconductor processing
equipment) are recommended as a performance goal.
Using this goal for the performance of electric utility
services will provide consistency with semiconductor
processing equipment capabilities. (See Related
Documents section.)
6.1.2 The goal for the maximum number of deviations
from specified performance per year is zero. However,
it is useful to recognize that utility generation,
transmission, and distribution systems are subject to
environmental and regulatory conditions that may
negatively influence the ability to provide zero
deviations on a continuous basis.
6.1.2.1 Document regulatory and environmental
requirements that will limit the electric utility’s choices
when implementing improvements, such as rate
structures or rights-of-way.
6.2 Measure Performance
6.2.1 Measuring Performance at Proposed Semi-
conductor Factory Sites
6.2.1.1 Factory site selection teams should consider
the importance of power and power quality when
evaluating potential sites. To insure that power quality
considerations are properly factored into the site
selection process, a selection factor should be assigned
to power quality and reliability criteria.
6.2.1.2 Utility electrical service configurations should
be considered when measuring and comparing
reliability and power quality performance at different
locations. The load profile for the proposed factory is
used to determine the standard utility electrical service
configuration. Usually, larger factories (> 10 MW)
exceed allowable loading for lower voltage distribution
systems (< 69 kV), therefore a high voltage service is
the typical configuration for larger semiconductor
factories. Selection of the highest available service
voltage is preferred for reliability due to two factors.
First, the area of exposure is greater for lower voltages
since they include both higher and lower voltage system
distribution lines and equipment. Second, higher
voltage systems can provide energy to lower voltage
system faults with little or no impact to high voltage
system voltages, whereas, lower voltage systems are
greatly impacted by faults not buffered by transformers.
6.2.1.3 The preferred method for comparing power
quality and reliability from different locations involves
creating a summary of the number of voltage sag events

SEMI F50-0200 © SEMI 2000 4
that fall into different magnitude-duration categories.
Data from different categories should be adjusted by
weighting factors to enable valid comparison. See
IEEE 1346 for suggested voltage sag event category
and weighting factors.
6.2.1.4 Model events.
6.2.1.4.1 If actual disturbance data is not available,
modeling results based on simulation of actual
electrical faults should be calculated and reviewed.
These studies called area of vulnerability analysis
determine transmission lines and equipment where
faults can adversely impact a semiconductor factory.
NOTE 2: As monitoring data is later collected, the modeling
results should be validated.
6.2.1.5 Monitor events near proposed site(s).
6.2.1.5.1 Define monitoring protocol per the method
outlined in Section 6.2.2.2.
6.2.1.5.2 Upon establishing an appropriate electrical
service configuration, reliability and power quality
information relative to that service configuration should
be requested from the electric utility. Depending upon
utility rate structures, semiconductor manufacturers
may be required to pay separately for this analysis.
Where available, the information provided should
include actual disturbance data from other selected sites
collected in accordance with IEEE 1159. Strive for
data on sites that have similar electrical service
configurations and are located electrically close to the
proposed site (e.g., ideally, from the same transmission
or distribution line).
6.2.2 Measuring Performance at Existing Semi-
conductor Factory Sites
6.2.2.1 Preparation for monitoring.
6.2.2.1.1 Review existing industry typical voltage sag
performance data for utility point-of-service.
6.2.2.1.2 Review existing site voltage sag performance
data, usually taken at a variety of locations within the
factory.
6.2.2.1.3 Review existing utility voltage sag
performance data for the area around the factory site,
usually a 20−30 mile radius of the service area is
sufficient.
6.2.2.1.4 Review existing utility area of vulnerability
modeling studies for power flow and system power
quality.
6.2.2.1.5 Document the existing utility and
manufacturing site electrical design and operating
procedures.
6.2.2.2 Define the monitoring protocol.
6.2.2.2.1 Define where measurement devices will be
located, how many to be installed, who will operate and
maintain them, and what are the standards for
calibration.
6.2.2.2.2 Define sensitivity settings. Usually
magnitude triggers are set as tightly as possible (95% of
nominal voltage). This will generate a large amount of
data that will verify trends and maximize comparison
opportunities between cause and effect. After several
evaluation cycles magnitude triggers can be moved
closer to the criteria (90% of nominal voltage), in order
to focus improvement efforts on the more significant
sags.
6.2.2.3 Monitor the voltage sag performance.
6.2.2.3.1 Location of monitor(s) should be such that
the utility point-of-service to the factory is represented
by the recorded data. Data recorded remote from the
utility point-of-service will be effected by other utility
or factory system components. Remote data should be
adjusted to represent a utility point-of-service
equivalent.
6.2.2.4 Track and report events.
6.2.2.4.1 Define the reporting format for all events and
who will receive the reports. (Example: Reports to
contain magnitude, duration, time/date stamp and
impact on process, if known. All events are
summarized and reported monthly. All out-of-
specification events only are reported same day as
event. All reports distributed to both factory and utility
representatives.)
6.3 Summarize Data and Evaluate Impact
6.3.1 Summarizing monitoring data.
6.3.1.1 Figure 3 shows how monitoring data can be
graphically reported using charts representing
magnitude and duration.
6.3.1.2 Monitored and measuring power quality
performance provides the semiconductor manufacturer
and their electric utility with empirical data on which to
base voltage sag performance and improvement
decisions.