semi合集-English.pdf - 第462页
SEMI E66-1103 © SEMI 1997, 2003 11 APPENDIX 1 STATISTICAL PROCESS CONTROL CHARTING NOTE: This appendix was approved as an official pa rt of SEMI E66 by full letter ballot procedure. A1-1 A1-1.1 The following rules should…

SEMI E66-1103 © SEMI 1997, 2003 10
14.1.7 MFC location in test bed if multiple station test
set-up used.
14.1.8 Cleanroom or environment classification
14.1.9 MFC type, manufacturer, serial number, sample
flow rate (sccm), model number, calibration date, and
particle range
14.1.10 Test gas type and dew point (°C)
14.1.11 A schematic of the test apparatus, including
manufacturers and model numbers of all test apparatus
components
14.1.12 Calibration dates for the flow meters
14.2 Refer to Figure A1-2 as an example of a typical
cleanup curve. Graph the static, dynamic, and impact
portions of the test separately as counts/minute
(measured by the counter) versus time. Include the
appropriate background (measured with the spool piece
in place) for each. Also graph the entire data set as
counts per minute versus time. If different MFCs are to
be compared, graph their entire data sets together.
14.3 Present the entire raw data set in tabular form
(see Table A2-1).
15 Precision and Bias
15.1 The precision and bias of the data generated by
this test method is limited to the precision and bias of
the particle measuring instruments used.
16 Related Documents
16.1 SEMI Standards
SEMI F78 — Practice For Gas Tungsten Arc (GTA)
Welding Of Fluid Distribution Systems In
Semiconductor Manufacturing Applications
SEMI F81 — Specification For Visual Inspection And
Acceptance Of Gas Tungsten Arc (GTA) Welds In
Fluid Distribution Systems In Semiconductor
Manufacturing Applications
16.2 Manufacturer’s Document
16.2.1 Manufacturers Operating Manual — The
appropriate particle counters manufacturer operating
and maintenance manuals should be consulted when
using this test method.
NOTICE: Unless otherwise indicated, all documents
cited shall be the latest published versions.
SEMI E66-1103 © SEMI 1997, 2003 11
APPENDIX 1
STATISTICAL PROCESS CONTROL CHARTING
NOTE: This appendix was approved as an official part of SEMI E66 by full letter ballot procedure.
A1-1
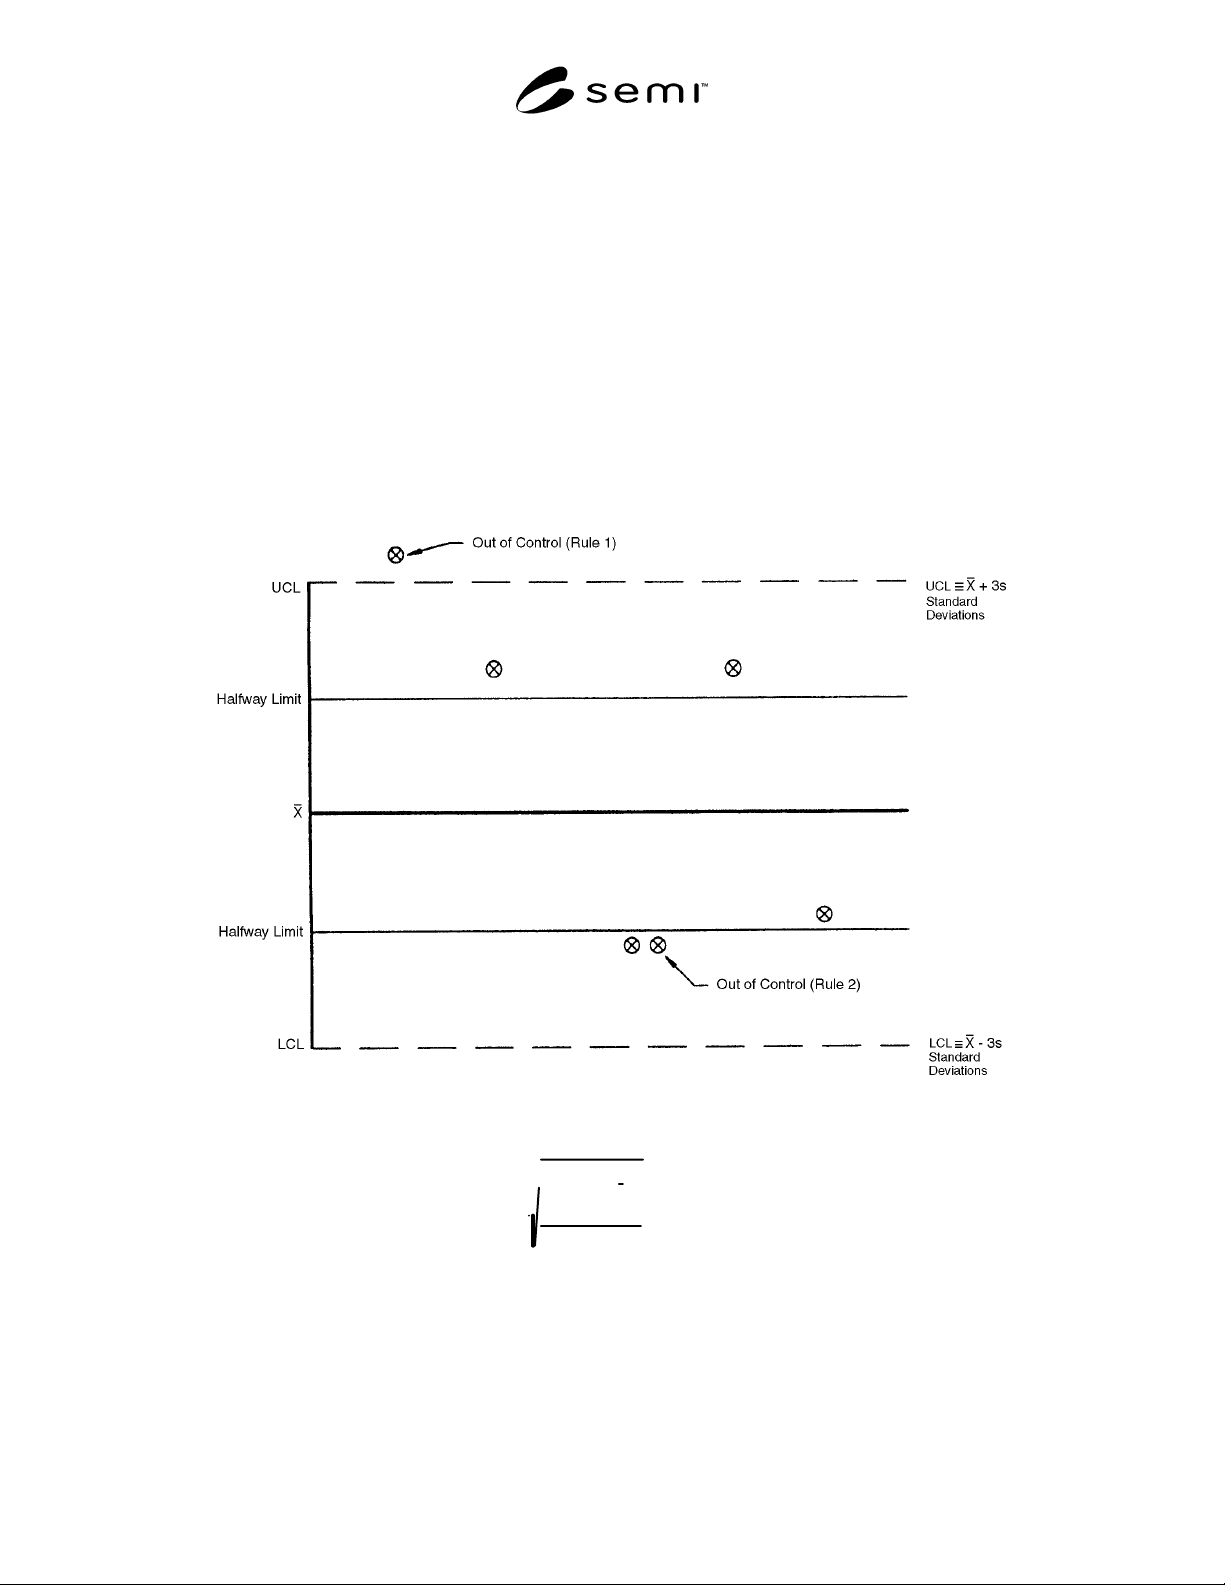
A1-1.1 The following rules should be used to interpret the statistical process control chart, Figure A1-1:
1. If one observation is outside UCL/LCL, the process is out of control.
2. If two consecutive observations are > halfway, the process is out of control.
3. If at least eight successive points are in control, the process is stable.
A1-1.2 It has been assumed that the data is approximately normal under log transform and that samples are
independent.
Figure A1-1
Statistical Process Control Chart
S =
(x
i
−
x )
2
1
n
∑
n − 1
where n = # of observations
SEMI E66-1103 © SEMI 1997, 2003 12
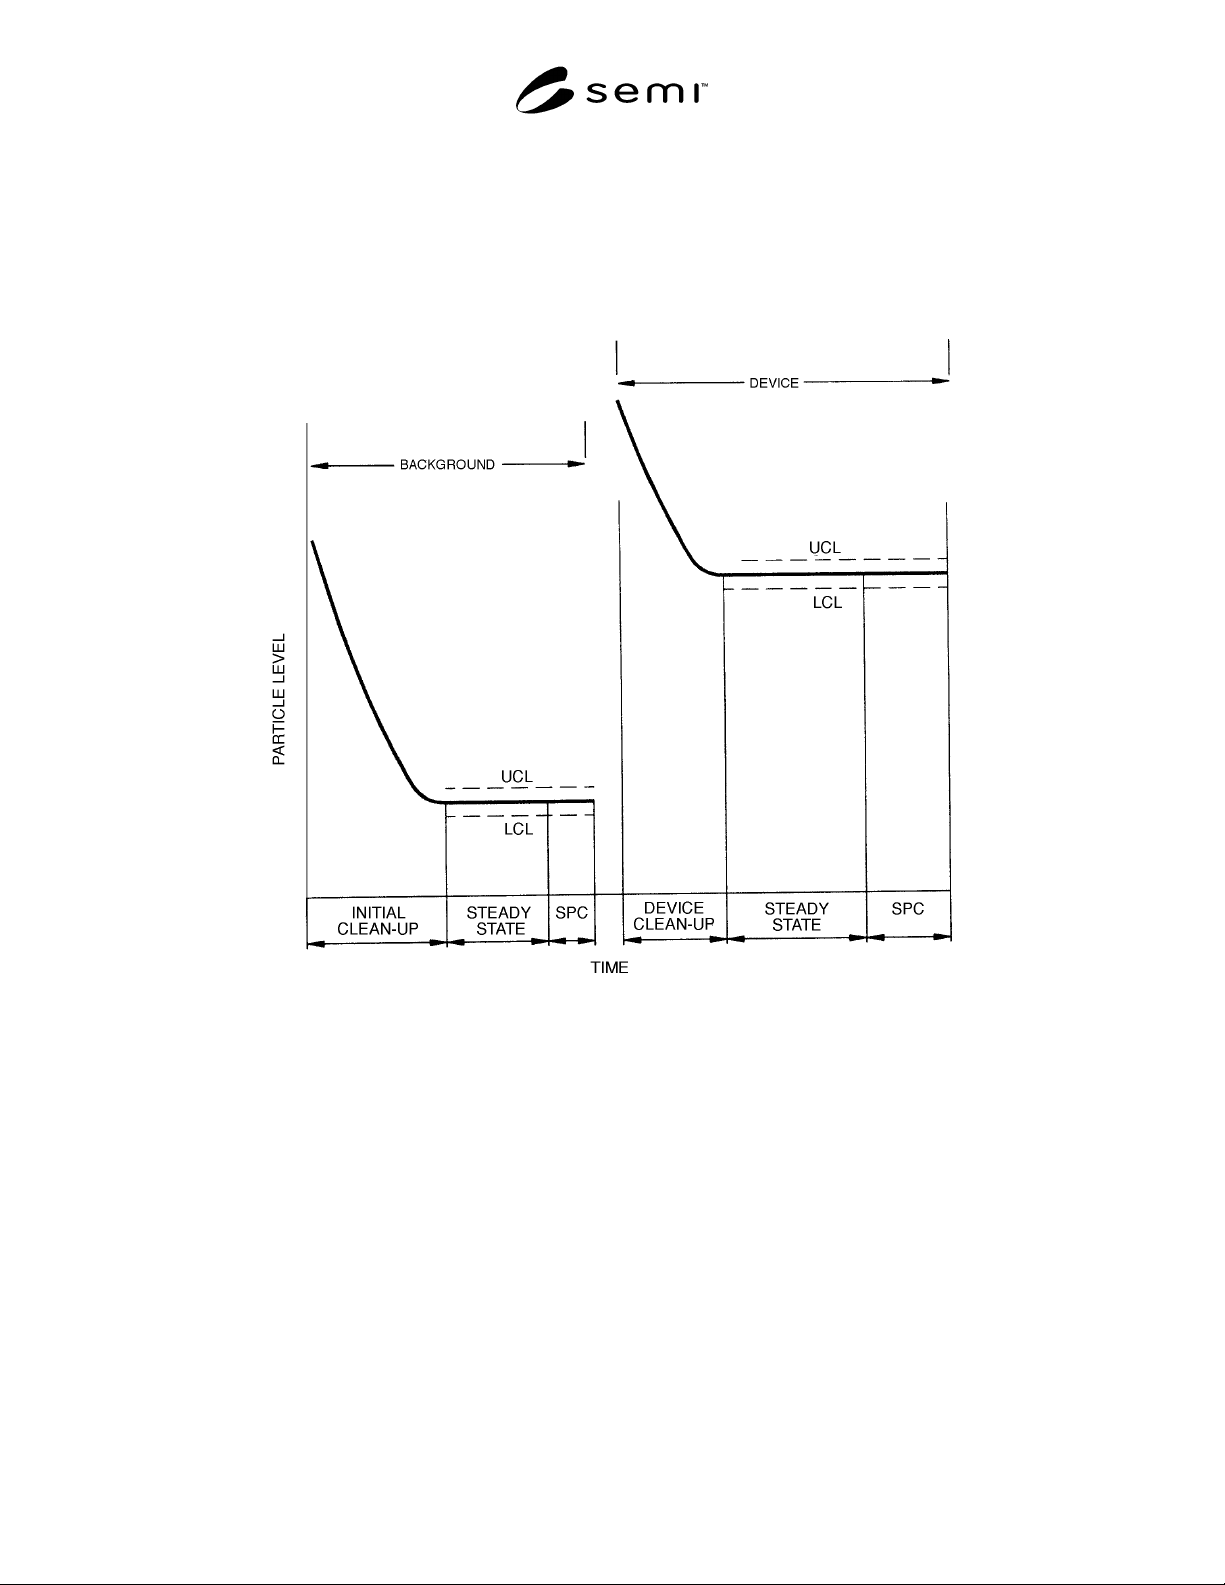
A1-1.3 Figure A1-2 gives an overall picture of the data collection specified by Table A2-1 for both
“BACKGROUND” and “DEVICE”. There are three phases of data collection:
1. Cleanup
2. Steady-state performance
3. Statistical process control (SPC)
Figure A1-2
Graphical Representation of Data Collection