semi合集-English.pdf - 第7451页
SEMI MF1535-1104 © SEMI 2004 9 13.3 If a wafe r map was made, report the following information in addition to a density p lot of the carrier recombination lifetime: 13.3.1 Point spacing and pattern, and 13.3.2 Radius of …
SEMI MF1535-1104 © SEMI 2004 8
automatically by the apparatus, set the injection level as
follows:
12.5.1 If the test specimen is oxidized and the
thickness of the oxide layer is not known, measure or
estimate it, using a method acceptable to the parties to
the test. Record the thickness.
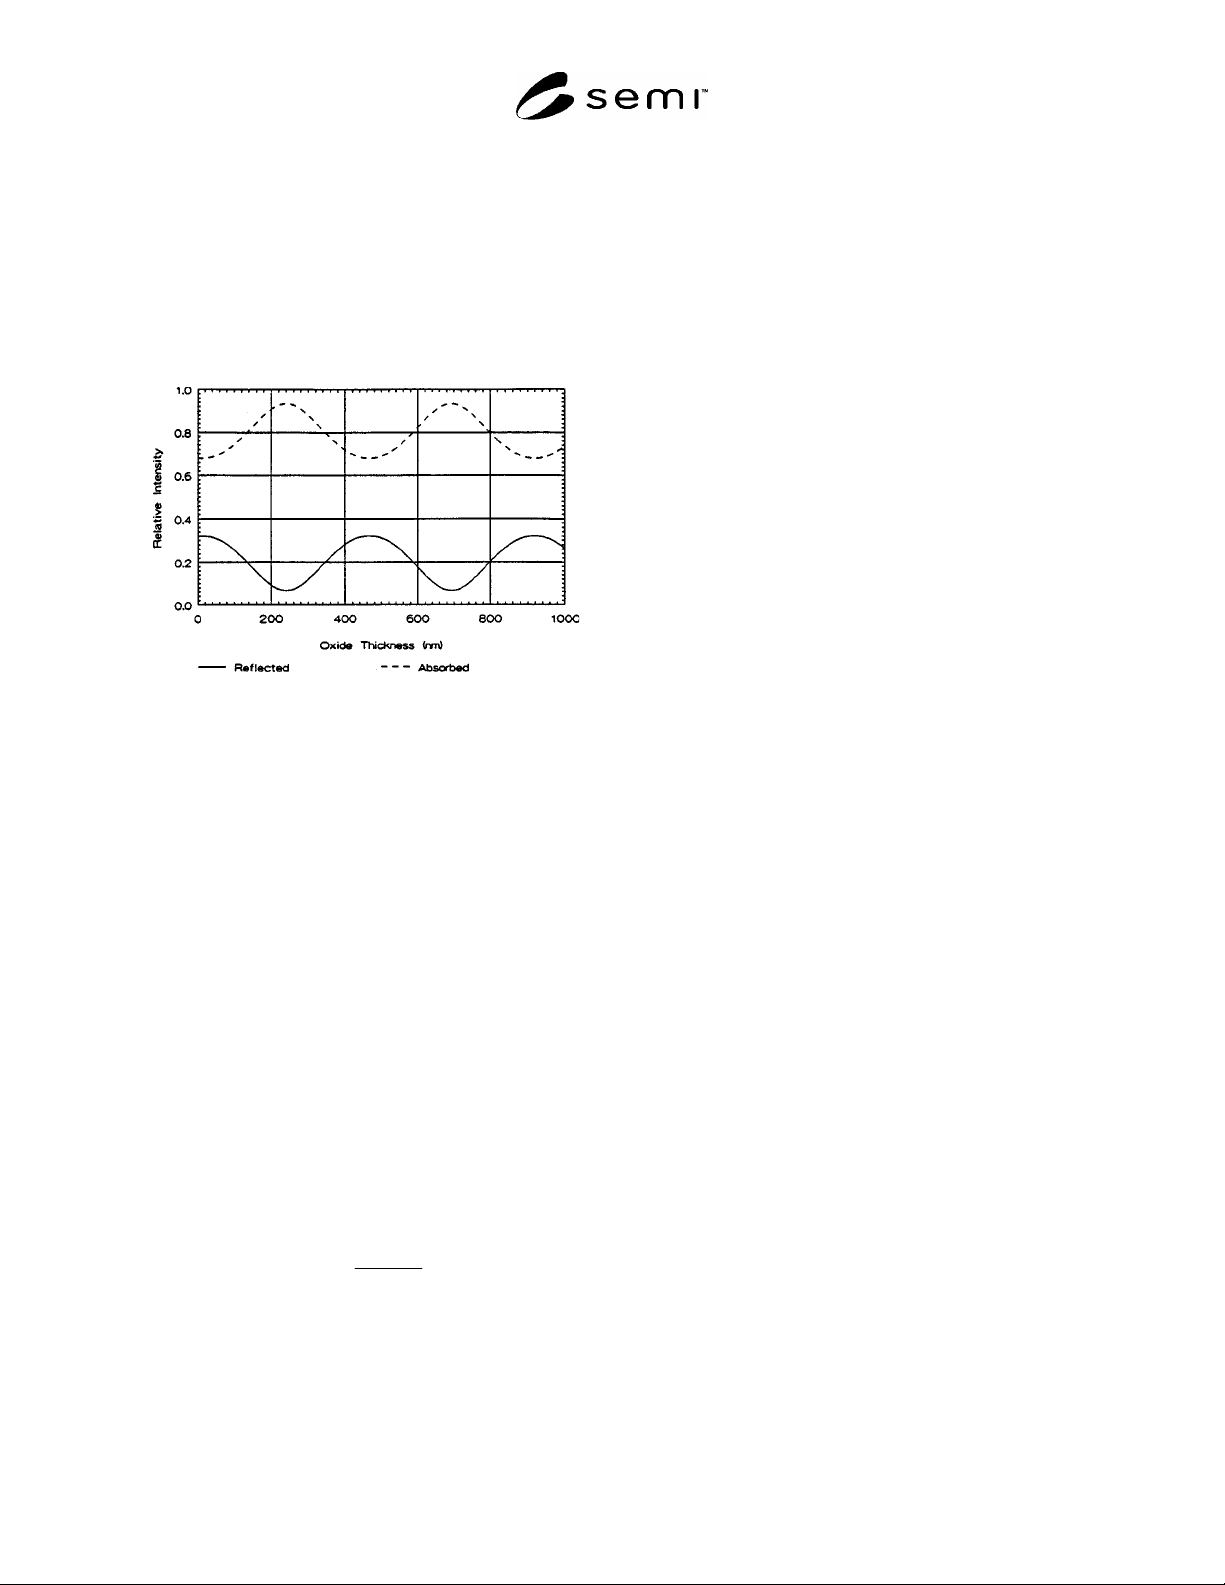
12.5.2 Determine and record the fraction of the
incident light that penetrates the oxide and is absorbed
by the specimen from the dashed curve in Figure 3.
Note: For these calculations the wavelength of the incident
radiation, , is assumed to be 905 nm, the index of refraction
of silicon is taken as 3.610, and the index of refraction of SiO
2
is taken as 1.462. Maximum absorption occurs at an oxide
thickness d = (2n + 1)/4 while minimum absorption occurs
at an oxide thickness d = n/2, when n = 0, 1, 2, etc.
Therefore, if the wavelength of the incident radiation,
1
,
differs from 905 nm, these curves can be used by determining
the relative intensity for an effective oxide thickness d
0
= 905
d
1
/
1
where d
1
is the actual thickness of the oxide.
Figure 3
Fraction of Incident Radiation Reflected from (solid
line) or Absorbed in (dashed line) a Silicon Wafer
Covered with a Silicon Dioxide (SiO
2
) Layer
between 0 and 1
m Thick
12.5.3 Adjust the light source intensity so that the
photon density absorbed in the silicon during the pulse,
, is equal to
n
maj
, where
is the desired injection
level and n
maj
is the density of majority carriers in the
wafer as determined in Section 12.1. The photon
density,
, in photons/cm
3
, is given by:
L
tf
p
t
I
0
d
(2)
where:
f
=
the fraction absorbed found from Figure 3 (see
Section 12.5.2),
I
=
the intensity of the incident light, in photons/cm
2
·s,
t
p
=
the length of the light pulse, in s, and
L
=
wafer thickness, in cm.
12.6 Turn on the microwave power source and view
the photoconductivity decay on the display unit. Adjust
the time and voltage scales so as to display the desired
portion of the decay signal. In the absence of
indications to the contrary, observe the decay signal
from 45 to 5% of the peak voltage.
12.7 Determine that the decay is exponential over the
desired range. Determine the time constant by fitting
an exponential curve to the voltage, V, as a function of
time, t, or (for manual data collection) a straight line to
the curve of lnV as a function of t.
12.8 Record this time constant as the recombination
lifetime.
12.9 If desired, move the wafer position and repeat
Sections 12.6 through 12.8 as required to obtain a wafer
map, noting the point spacing and pattern together with
the radius of the mapped area.
12.10 Alternatively, if desired, repeat Sections 12.2
and 12.6 through 12.8 at the same location for different
temperatures or repeat Sections 12.5 through 12.8 at the
same location for different values of injection level.
13 Report
13.1 Report the following information:
13.1.1 Date and location of the test,
13.1.2 Operator,
13.1.3 Instrument type, model number, and, if
computer controlled, software version,
13.1.4 Wafer description including any identification
markings, center-point resistivity, center-point
thickness, conductivity type, surface condition (front
and back), and nominal diameter,
13.1.5 Portion of the decay signal from which the time
constant was determined,
13.1.6 Injection level,
, as established in Section 12.5,
13.1.7 Surface passivation procedure used (see Section
11), and
13.1.8 Carrier recombination lifetime,
, in s.
13.2 If measurements were made at several injection
levels, report
for each value of
.

SEMI MF1535-1104 © SEMI 2004 9
13.3 If a wafer map was made, report the following
information in addition to a density plot of the carrier
recombination lifetime:
13.3.1 Point spacing and pattern, and
13.3.2 Radius of the mapped area.
13.4 If measurements were made at a specific or
several temperatures, report the temperature of each
measurement.
14 Precision and Bias
14.1 Precision — Neither the intralaboratory nor the
interlaboratory precision of this test method has yet
been established. In spite of this limitation, the
technique is widely utilized in the industry without the
benefit of standardization of the test conditions.
Because of the lack of a precision determination, this
test method should be used for materials specification
and acceptance only after the parties to the test have
established reproducibility and correlation.
14.2 Bias — No information can be presented on the
bias of this test method because no material having an
accepted reference value of carrier recombination
lifetime is available.
15 Keywords
15.1 contactless measurement; microwave reflection;
photoconductivity decay; recombination lifetime;
silicon wafers

SEMI MF1535-1104 © SEMI 2004 10
RELATED INFORMATION 1
INJECTION LEVEL CONSIDERATIONS
NOTICE: This related information is not an official part of SEMI MF1535. It was derived from
information developed during the original preparation of the standard in ASTM Committee F-1 in 1994.
This related information was approved for publication by full letter ballot procedures.
R1-1 The carrier recombination lifetime is frequently
associated with the minority carrier lifetime. This
association is correct only if the lifetime is determined
for low injection level when
(the ratio of density of
excess photogenerated carriers to the equilibrium
density of majority carriers) is much less than 1, and
then only if certain other conditions are also met (see
Related Information 2 and Related Information 3).
Nevertheless, the low-injection (small-signal) value of
the carrier recombination lifetime is independent of the
exact value of
provided that
<< 1. However, in this
test method, it is often neither possible nor convenient
to make measurements in the low-injection regime.
When this is the case, the measured recombination
lifetime is a function of the injection level.
R1-2 The basic model for carrier recombination
through defect centers in semiconductors was
developed independently by Hall
14
and by Shockley
and Read.
15
This model has been thoroughly discussed
by Blakemore.
16
In the Shockley-Read-Hall (S-R-H)
model, it is assumed (1) that the doping level of the
semiconductor is not so high that the semiconductor
becomes degenerate, and (2) that the density of defect
centers is small compared with the majority carrier
density.
NOTE 1: The reader should refer to Blakemore’s text for a
more complete treatment than is presented here, including the
derivation of the S-R-H expression (Equation R1-1) for
carrier lifetime and discussion of the effect of Fermi energy
on the small-signal recombination lifetime. In addition,
Blakemore goes on to discuss other complexities that result
when the density of defect centers is not small compared with
the majority carrier density,
17
and when carrier trapping
occurs.
18
R1-3 Both the assumptions underlying the S-R-H
model are generally appropriate for the specimens to be
measured by this test method. With these assumptions,
the density of excess electrons (n
e
) is equal to the
density of excess holes (p
e
), and the electron (
n
) and
hole (
p
) lifetimes for recombination through a defect
14 Hall, R. N., “Electron-Hole Recombination in Germanium,”
Phys. Rev. 87, 387 (1952).
15 Shockley, W., and Read, W. T., “Statistics of the Recombination
of Holes and Electrons,” Phys. Rev. 87, 835–842 (1952).
16 Blakemore, J. S., op. cit., Section 8.3.
17 Blakemore, J. S., op. cit., Sections 8.4 and 8.5.
18 Blakemore, J. S., op. cit., Section 8.2.
center located at an energy
T
within the forbidden
energy gap are equal. This carrier recombination
lifetime, , in s, is given as follows:
)(
)()(
00
100100
e
epen
pn
npn
nnnnpp
(R1-1)
where:
n0
= time constant for ca
p
ture of an electron in an
empty center, in s,
p0
= time constant for capture of a hole in a filled
center, in s,
n
0
= equilibrium density of electrons in a
nondegenerate semiconductor, in electrons/cm
3
,
p
0
= equilibrium density of holes in a nondegenerate
semiconductor, in holes/cm
3
,
n
1
= density of electrons in a nondegenerate
semiconductor when the Fermi energy,
F
, =
T
, in
electrons/cm
3
, and
p
1
= density of holes in a nondegenerate semiconductor
when the Fermi energy,
F
, =
T
, in holes/cm
3
.
R1-4 In the low-injection limit, n
e
can be neglected
and Equation R1-1 reduces to the small-signal
recombination lifetime,
0
.
)(
)(
)(
)(
00
10
0
00
10
00
pn
nn
np
pp
pn
(R1-2)
On the other hand, in the high-injection limit, n
e
is the
dominant term and the recombination lifetime becomes:
00 pn
(R1-3)
At intermediate injection levels the recombination
lifetime can be expressed as a combination of
0
and
:
1
)(
0
00
000
e
e
npn
npn
(R1-4)
Therefore, a straight line is obtained when the quantity
(1+
) is plotted against
. The zero intercept of this
line is
0
and its slope is
. The linearity of this
function provides a test for the validity of the S-R-H
model and also for the presence of multiple defect
centers in the test specimen.