semi合集-English.pdf - 第3953页
SEMI F38-1104 © SEMI 1999, 2004 5 C N C A C N C B Ex p ansion S y stem Differential Pressure Diffusion Dr y e r Gas Inlet FM2 FM1 F1 R1 Gas Inlet Radioactive Neutralizer Radioactive Neutralizer Mixin g Chamber Differenti…
SEMI F38-1104 © SEMI 1999, 2004 4
determine the mean, standard deviation, and the
standard error for each particle size range.
8.5.3 The sample mean, X, or average of the data for
each state is given by:
X
X
i
n
i 1
n
where X
i
is the observed counts for the state and n is the number
of samples.
8.5.4 The sample standard deviation is a measure of
the variability of the data about the mean. The standard
deviation, s, for each state is expressed as:
s
(Xi X
)
2
i1
n
n 1
8.5.5 The standard error, Se or standard deviation of
the sampling distribution of the mean for each state is
given below:
Se
s
n
8.5.6 The average particle count for the total number of
particles generated, or the sample mean, is an
estimation of the population mean. For a 95%
confidence level, the population mean, µ
p
, will be
within two standard errors of the sample mean, or:
p
X 2 Se
8.5.7 In order to determine if there is statistical
evidence of the component having an effect on the
observed particle count, a test must be conducted to see
if the actual difference between the average background
count, X
B
, and the average test count, X
t
, exceeds two
standard errors in a distribution of differences between
means. The average particle count generated by the test
component, X
c
, is given by:
X
c
X
t
X
B
8.5.8 The standard error in a distribution of differences
between means is expressed as:
S
ec
S
et
2
S
eB
2
8.5.9 The 95% confidence interval of the test
component itself is then determined by:
X
c 2 S
ec
8.5.10 If this confidence interval includes 0, then this
implies that there is not strong statistical evidence of
the component having an effect on the observed particle
count. If this interval does not include 0, then this
implies there is strong statistical evidence that the
component does have an effect on the observed particle
count.
8.5.11 Present in tabular form the average particle
count and the associated 95% confidence limits (as
calculated in Section 8.5.9) for each test state. In
addition, present the background test data separately as
a distinct element.
8.5.12 Calculation of the Efficiency Class
8.5.12.1 The efficiency class shall be calculated in
such a fashion that that:
LRV = Log [Input Concentration / X
B
+ 2S
eB
].
SEMI F38-1104 © SEMI 1999, 2004 5
C
N
C
A
C
N
C
B
Ex
p
ansion
S
y
stem
Differential
Pressure
Diffusion
Dr
y
e
r
Gas
Inlet
FM2
FM1
F1
R1
Gas
Inlet
Radioactive
Neutralizer
Radioactive
Neutralizer
Mixin
g
Chamber
Differential
Pressure
#1
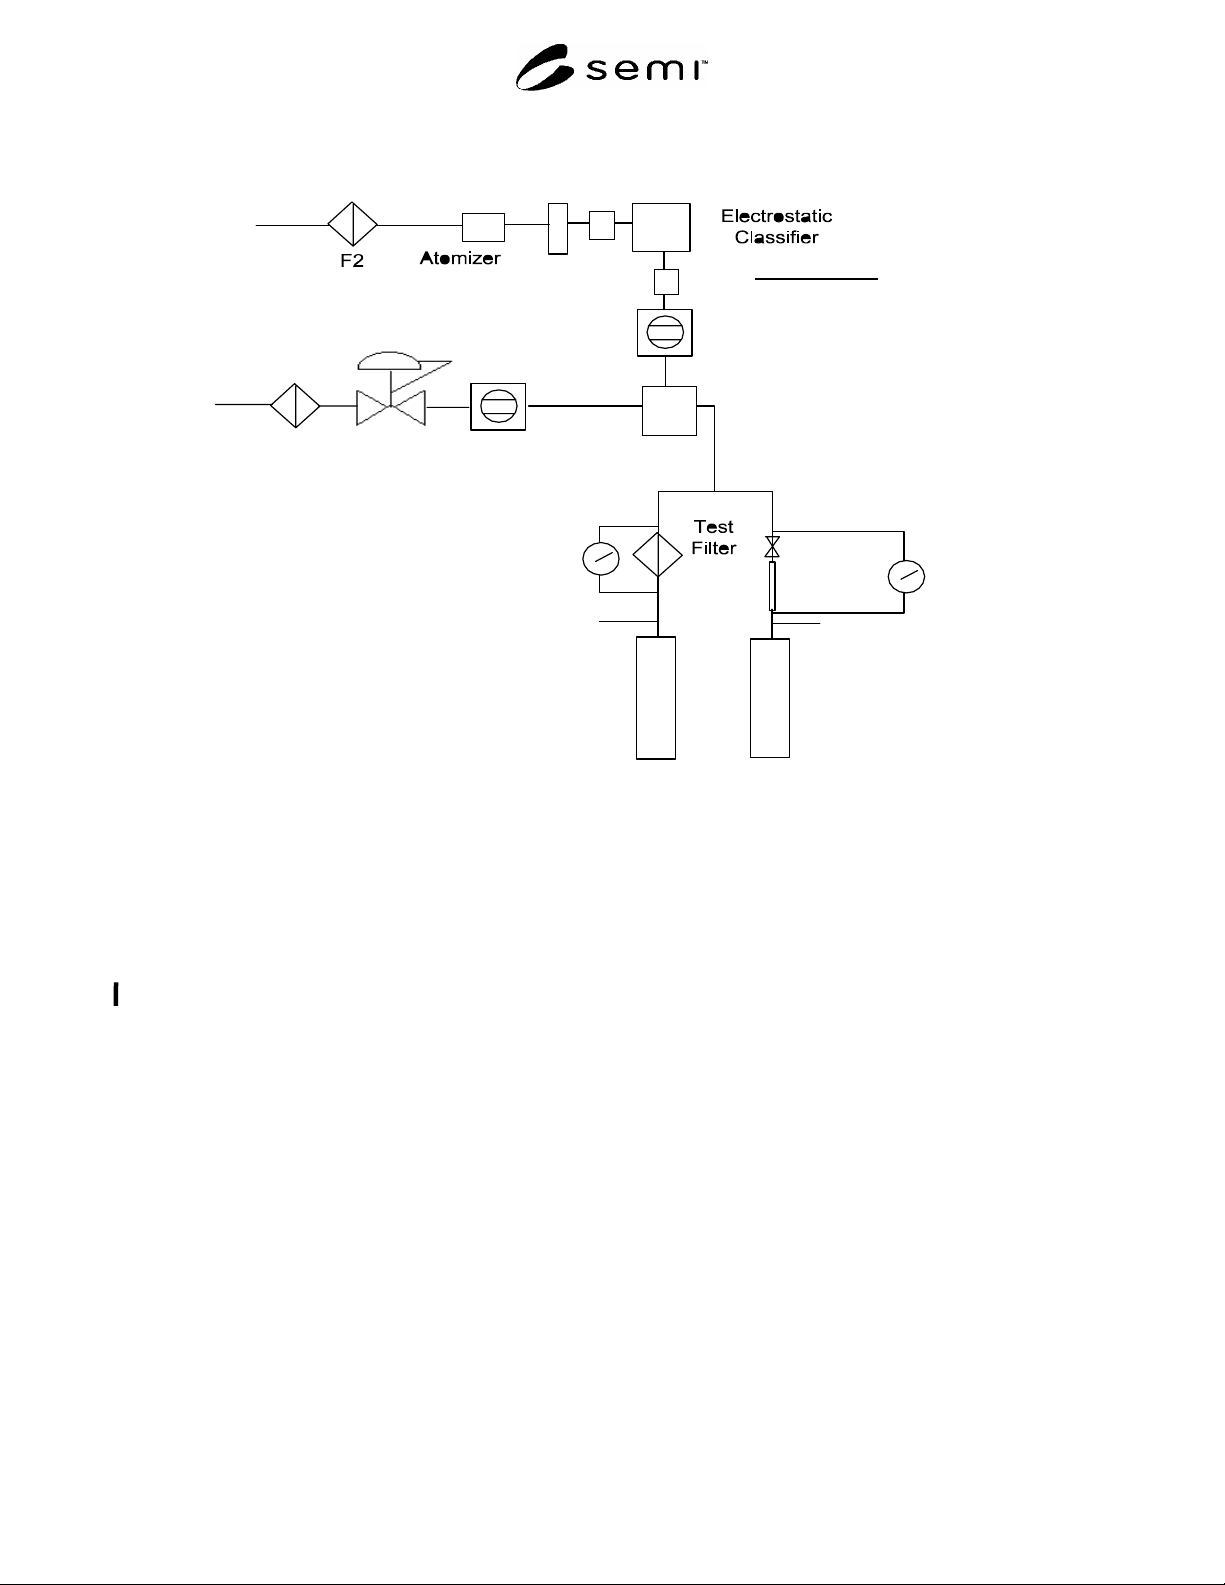
F1, F2 = 10” PTFE Membrane Filter or Equivalent Filter with Sufficient Flow Capacity (LRV 9)
#2
R1 = @ 0 - 100 psig Outlet Regulator
#3
FM1, FM2 = Low Flow ( 0 - 50 slm) Flowmeter
Figure 1
Schematic Diagram of Filter Test System
NOTICE: SEMI makes no warranties or representations as to the suitability of the standards set forth herein for any
particular application. The determination of the suitability of the standard is solely the responsibility of the user.
Users are cautioned to refer to manufacturer's instructions, product labels, product data sheets, and other relevant
literature, respecting any materials or equipment mentioned herein. These standards are subject to change without
notice.
By publication of this standard, Semiconductor Equipment and Materials International (SEMI) takes no position
respecting the validity of any patent rights or copyrights asserted in connection with any items mentioned in this
standard. Users of this standard are expressly advised that determination of any such patent rights or copyrights, and
the risk of infringement of such rights are entirely their own responsibility.
Copyright by SEMI® (Semiconductor Equipment and Materials
International), 3081 Zanker Road, San Jose, CA 95134. Reproduction of
the contents in whole or in part is forbidden without express written
consent of SEMI.

SEMI F39-0699 © SEMI 19991
SEMI F39-0699
GUIDELINE FOR CHEMICAL BLENDING SYSTEMS
This guideline was technically approved by the Global Facilities Committee and is the direct responsibility of
the North American Facilities Committee. Current edition approved by the North American Regional
Standards Committee on December 18, 1998. Initially available on www.semi.org January 1999; to be
published June 1999.
1 Purpose
1.1 This guideline establishes terminology,
classification, performance characterization, and
qualification methods for chemical blending equipment.
2 Scope
2.1 This guideline applies to chemical blending
equipment interfaced with Bulk Chemical Distribution
Systems (BCDS).
3 Limitations
3.1 This guideline does not cover subject matter
concerning chemical distribution capability of some
chemical blending equipment, chemical blending
methodology, or materials of construction used in this
equipment.
4 Referenced Documents
4.1 SEMI F31 — Guide for Bulk Chemical
Distribution Systems
5 Terminology
5.1 accuracy A quantity describing the deviation of
the mean blend ratio produced by the chemical blending
equipment from the desired constituent ratio.
5.2 assay A term used to determine the amount of a
chemical constituent in a blend.
5.3 baseline contamination level The level of
impurity measured in the source fluids, including UPW
and chemical.
5.4 batch The end quantity of chemical resulting
from the blending of the chemical constituents.
5.5 blending Combination of two or more
chemicals to create a mixture which contains a desired
ratio of constituents. A dilution process by this
definition is also a blending process. However,
blending is a more general case where UPW is not
always one of the constituents. Therefore, the term
blending will be used in the remainder of the document.
5.6 Central Limit Theorem (CLT) The CLT is a
probability theorem which allows the approximation of
normality for any distribution. The CLT applied to
chemical blending states that if a sufficient number of
random samples are taken from the distribution of all
chemical produced by chemical blending equipment,
then the average measurement of these samples can be
approximated to follow a normal distribution. A rule of
thumb for the “sufficient number of batches” is thirty or
greater.
5.7 dilution Combination of a concentrated
chemical and UPW to create a lower concentration of
the aqueous chemical.
5.8 duty cycle The normal percentage of time that
the chemical blending equipment is operating.
5.9 mixing Mechanical energy imparted to a
combination of two or more chemical constituents used
to create a homogenous solution.
5.10 on-site blending Chemical blending
equipment used for blending chemical on location of
the semiconductor manufacturing facility
5.11 precision or repeatability A quantity
describing the degree of achieving the same ratio of
chemical constituents in the blend over time.
5.12 production rate The volume of chemical able
to be blended and provided to the BCDS per day.
6 Classification
6.1 Batch Blending The process of chemical
blending where the chemical constituents are combined
and mixed in a tank before being made available for
use.
6.2 Feed-forward Controlled Blending Blending
process which uses information (i.e. incoming chemical
assay) of the chemical constituents as the basis for
combining these constituents. Examples of feed-
forward blending processes include, but are not limited
to, those processes that use weight or volume for
control.
6.3 Feedback Controlled Blending Blending
process which combines constituents based on
measurements of the blended chemical. Examples of
feedback controlled blending process include, but are
not limited to, those processes controlled by
measurements of density, conductivity, and chemical
assay (by titration).