semi合集-English.pdf - 第4068页
SEMI F55-0600 © SEMI 2000 6 Start Install D UT Exit Condition Basline Data 1 Hour Flow Dr y N 2 Collect Data 10 Minutes Flow Dry HCl 7 Minutes Flow Dr y N 2 Collect Data 10 Minutes Flow W et N 2 3 Minutes Purge DUT Remov…
SEMI F55-0600 © SEMI 20005
replaced with a spool piece. The system can then be
continuously purged with dry N
2
.
NOTE 9: The DUT will be contaminated with corrosive
material. See Precautions in Section 10. Preserve the DUT
for failure analysis, if desired.
14 Calculations or Interpretation of Results
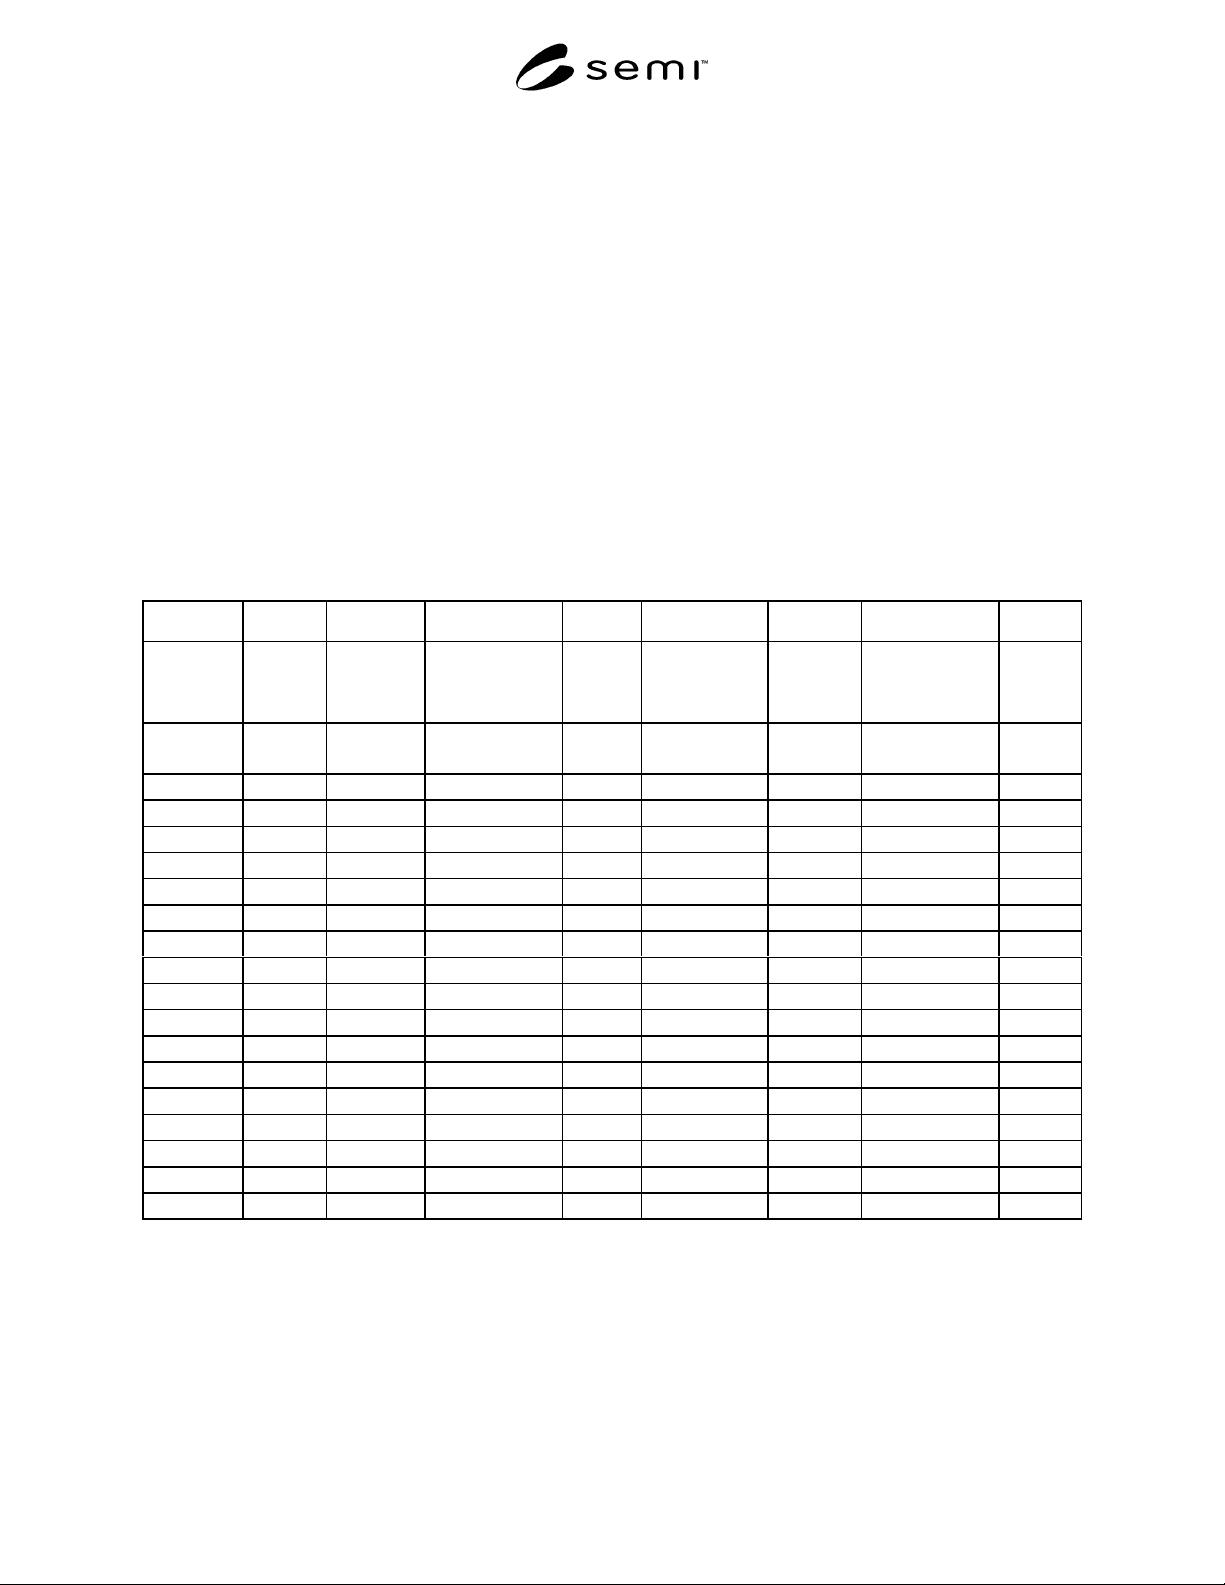
14.1 Report data in a tabular format and graph per
Appendix 1. Any parameter which changes more than
1% from its baseline should also be graphed. Note the
reason the test was terminated. Test results may be
summarized in a single parameter by reporting the
number of test cycles to reach a 2% shift in actual flow
or to reach DUT failure, whichever occurs first. In this
test, more data is reported than is required to calculate
the gross test result. The extra data is used when
analyzing test results to determine the cause of failure.
Further explanation of the significance of the data is
beyond the scope of this test method.
15 Data Analysis.
15.1 Calculate any parameter-shift in percent as
follows:
(baseline value - current value) × 100
baseline value
16 Reporting Results
16.1 Report the number of test cycles to reach a 2%
shift in actual flow or to reach DUT failure, whichever
occurs first.
17 Precision and Accuracy
17.1 This method is limited in its precision by the
calibration of the measurement devices, the temperature
of the apparatus, and the concentration of water vapor
in N
2
. Sources of bias are unknown at this time, but
they probably include peculiarities in the construction
of the apparatus.
18 Related Documents
18.1 Material safety data sheet (MSDS) for hydrogen
chloride, which can be obtained from a supplier of the
gas.
19 Illustrations
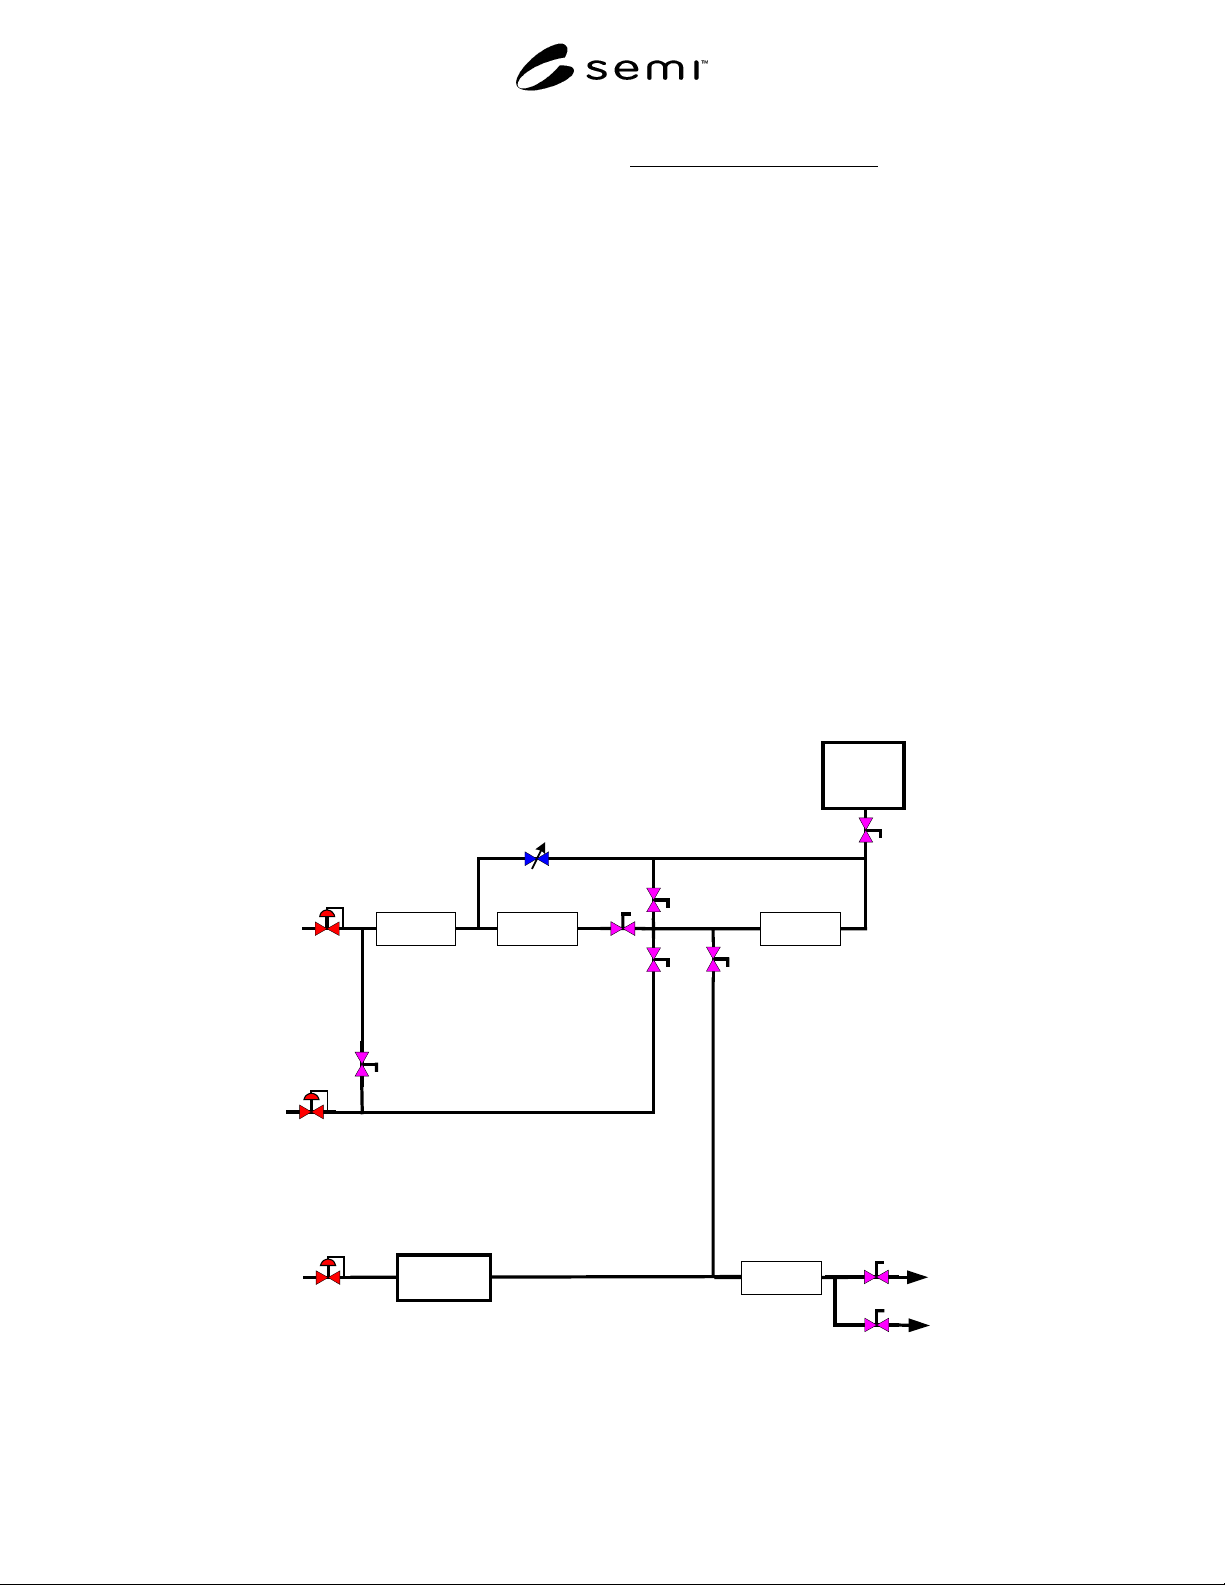
Purge Rate
Flow Meter
MFM
Reference
Meter
DUT
Exhaust
System
Moisture
Generator
MFC
or Control
Valve
Vent
Moisture Level
Test Port
V8
V3
V2
V7
V1
V6
V4
V5
Purge Flow
Dry HCl in
Dry N
2
in
Dry N
2
in
Figure 1
Schematic of Apparatus
SEMI F55-0600 © SEMI 2000 6
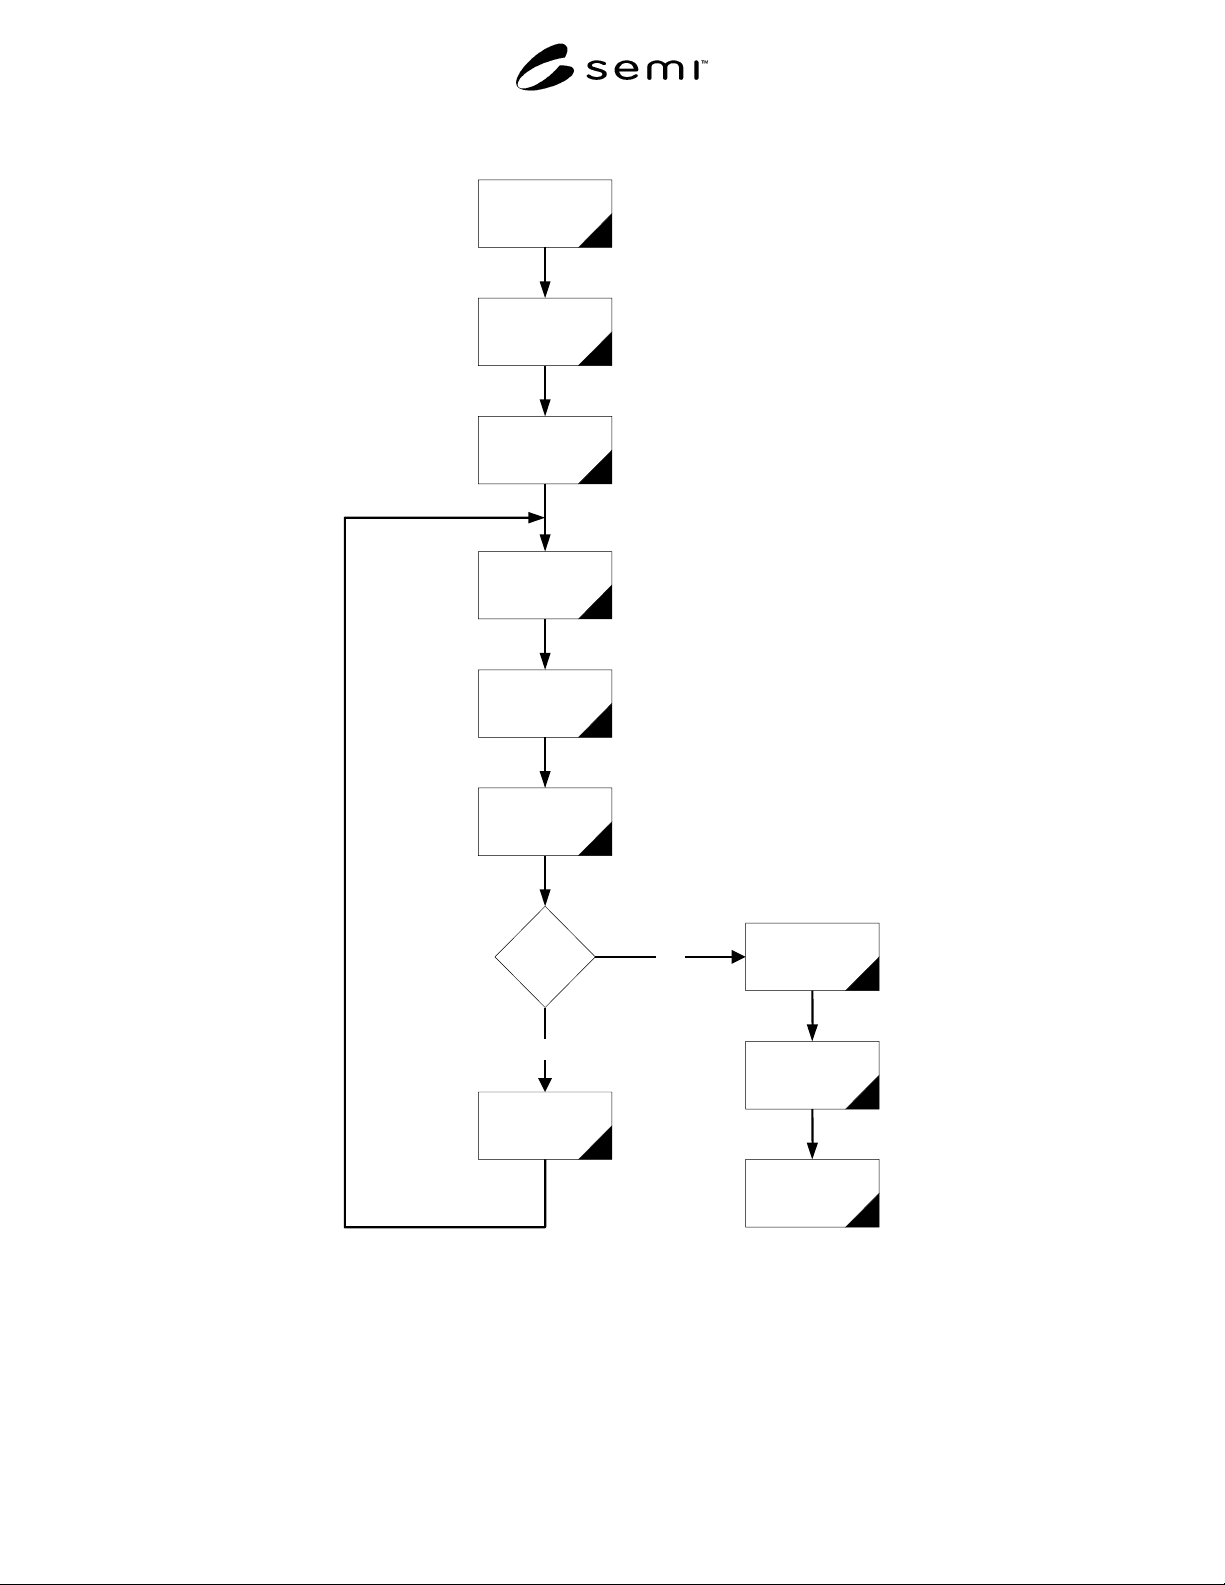
Start
Install DUT
Exit
Condition
Basline Data
1 Hour
Flow Dry N
2
Collect Data
10 Minutes
Flow Dry HCl
7 Minutes
Flow Dry N
2
Collect Data
10 Minutes
Flow Wet N
2
3 Minutes
Purge DUT
Remove DUT
Exit
Yes
No
Figure 2
Test Flowchart
SEMI F55-0600 © SEMI 20007
APPENDIX 1
TEST REPORT CORROSION TEST
NOTE: The material in this appendix is an official part of SEMI F55 and was approved by full letter ballot procedures on April
10, 2000 by the North American Regional Standards Committee.
MFC Identification: Wxyz Instruments, Model 123, Serial 230967
Calibrated for: 100 scm
3
HCl
Reference Flowmeter: Mnop Company, Model 1023, Serial 37863, 100 sccm N
2
Test dates: March 28 to May 5, 1993
Test Laboratory: Flow Test and S.D. Associates, Inc.
Test supervised by: George Smith
Table A1-1 Data in tabular format
ABC D E F G H J
TEST
CYCLE #
TEST
CYCLE
HOURS
DUT
SET-
POINT %
DUT
INDICATED %
DUT
ZERO
%
REFERENCE
FLOW ZERO
%
ACTUAL
FLOW %
CALIBRATION
SHIFT %
CHANGE
VALVE
DRIVE
VOLTS
base
line
base
line
75.04 75.05 -0.13 0.03 71.12 0.0 -7.062
100 50 75.01 74.8 0.14 0.04 71.56 0.6 -7.066
200 100 75.00 74.82 0.13 -0.04 71.38 0.4 -7
300 150 74.99 75.1 -0.01 -0.03 71.26 0.2 -7.056
400 200 75.02 75.01 0.02 0.01 71.3 0.3 -7.049
500 250 74.98 74.96 -0.01 -0.03 71.36 0.3 -7.009
600 300 75.02 74.96 0.00 0.03 71.18 0.1 -6.997
700 350 74.99 74.92 0.11 -0.04 71.32 0.3 -7.042
800 400 75.00 75.15 -0.06 -0.04 71.37 0.4 -7.010
900 450 75.02 74.9 0.04 0.01 71.69 0.8 -6.997
1000 500 74.99 75.01 -0.09 0.04 71.96 1.2 -7.056
1100 550 75.01 74.82 0.13 0.04 72.55 2.0 -7.136
1200 600 75.03 75.1 -0.13 -0.02 72.92 2.5 -7.100
1300 650 75.05 75.19 -0.15 -0.03 74.17 4.3 -7.277
1400 700 74.96 75.09 -0.12 -0.01 76.15 7.1 -7.348
1500 750 75.04 75.05 -0.09 -0.01 79.86 12.3 -7.666
1600 800 74.96 75.15 -0.13 0.05 88.36 24.2 -8.278
1700 850 74.96 74.99 0.03 -0.02 110.53 55.4 -9.732