semi合集-English.pdf - 第4570页
SEMI D31-1102 © SEMI 2002 3 RELATED INFORMATION 1 EXPERIMENT OUTLINE FOR CA LCULATION OF MEASUREMENT INDEX FOR LUMINANCE MURA IN FP D IMAG E QUALITY INSPECTION NOTE: This related information is not an official part of SE…

SEMI D31-1102 © SEMI 2002 2
6 Semu Definition
6.1 Under specific conditions, the below regressive
relationship can be seen between area and contrast for
Human Mura JND. (Refer to Related Information.)
Cjnd = F(Sjnd)
= 1.97/Sjnd
0.33
+ 0.72
Cjnd: Contrast of mura at JND (Unit: % relative to
background = 100%)
Sjnd: Area of mura at above contrast (Units: mm
2
)
6.1.1 In the above equation, contrast at JND is
inversely proportional to area raised to the 0.33 power.
In short, it indicates that as mura area gets smaller, only
darker muras can be sensed.
6.2 For the subject mura, the mura level, Semu, can be
calculated using the below formula.
Semu = | Cx| / Cjnd
= | Cx| / F(Sx)
= | Cx| /(1.97/Sx
0.33
+ 0.72)
Cx: Average contrast of mura being measured
(Unit: % relative to background = 100%)
Sx: Surface area of mura being measured (Units:
mm
2
)
7 Notation
7.1 Semu is a comparison ratio between contrast of the
measurement target and contrast in a JND, and thus has
no unit.
7.2 It is recommended that significant digits be
displayed to one decimal place.
NOTE 1: Notation uses this following methodology.Notation
Example 1: The level of JND mura in this study is Semu =
1.0. Notation Example 2: The level of this mura is Semu 2.5.
8 Test Methods
8.1 Comparative Measurement and Direct
Measurement — The two methods for determining
Semu levels on panels are comparative measurement
and direct measurement.
8.1.1 Comparative Measurement
8.1.1.1 The comparative measurement method involves
a panel and software which can simulate Semu level, to
which a person compares a mura on an actual panel,
making adjustments, until a level which appears similar
is determined. This is a method that can be used in the
actual production site easily using the Semu simulation
panel as the variable level limit sample.
8.1.2 Direct Measurement
8.1.2.1 The direct measurement method captures the
actual panel with a CCD camera, or the like, and is a
method of measuring the Semu level of the mura
section, making it possible to directly determine the
Semu from the area and contrast of the mura section
that is captured.
8.2 Measurement Equipment
8.2.1 Semu measurement consists of measurement of
the area of mura on the display surface and contrast
measurement, and needs to be appropriately calibrated.
8.3 Measurement Environment
8.3.1 Semu measurement will be conducted in a
darkroom environment.
8.4 Display Conditions
8.4.1 Background luminance for Semu measurement
shall be 50 ± 10 cd/m
2
.
8.5 Contrast Measurement
8.5.1 The average contrast of the mura section shall be
measured, and the contrast ratio of the mura section will
expressed as a percentage, for when the background =
100%.
9 Related Documents
9.1 Experiment Overview for Calculation of
Measurement Index for Mura in FPD Image Quality
Inspection. R. Yositake IBM Japan, T.Tamura Tokyo
Institute of Polytechnics Oct. 23/2001
NOTICE: SEMI makes no warranties or
representations as to the suitability of the standards set
forth herein for any particular application. The
determination of the suitability of the standard is solely
the responsibility of the user. Users are cautioned to
refer to manufacturer' s instructions, product labels,
product data sheets, and other relevant literature
respecting any materials or equipment mentioned
herein. These standards are subject to change without
notice.
The user' s attention is called to the possibility that
compliance with this standard may require use of
copyrighted material or of an invention covered by
patent rights. By publication of this standard, SEMI
takes no position respecting the validity of any patent
rights or copyrights asserted in connection with any
item mentioned in this standard. Users of this standard
are expressly advised that determination of any such
patent rights or copyrights and the risk of infringement
of such rights are entirely their own responsibility
SEMI D31-1102 © SEMI 2002 3
RELATED INFORMATION 1
EXPERIMENT OUTLINE FOR CALCULATION OF MEASUREMENT
INDEX FOR LUMINANCE MURA IN FPD IMAGE QUALITY INSPECTION
NOTE: This related information is not an official part of SEMI D31. This related information was approved for
publication by full letter ballot procedures on July 19, 2002.
R1-1 Purpose
R1-1.1 It has been reported that under the range of
certain conditions, a basic expression of FPD mura
quality level can be made, using their size and
contrast
[1]
. Here, recreating those experiments, we
verified their reproducibility, conducting the
experiment with a goal of calculating a measurement
index for luminance mura for standardization.
R1-2 Experiment Method
R1-2.1 Experiment Equipment
R1-2.1.1 The experiment utilized a 14.1 inch, 1024 X
768 pixel backlit TFT/LCD. As there was a need to
display low contrast luminance muras, it was reworked
to display 256 gradations in a 43 cd/m
2
~ 54 cd/m
2
range. A program capable of displaying rectangular
and round muras as desired was created, and the muras
were displayed in the center of the prepared LCD. The
subjects could freely adjust the luminance of the
displayed luminance muras using a handheld ten-key
pad.
R1-2.2 Experiment Conditions
R1-2.2.1 21 types of muras were used. These were
four round types (diameter:7, 25, 55, 305 pixels) and 17
rectangular types (31×1, 153×1, 240×1, 480×1, 31×2,
153×2, 240×2, 31×3, 153×3, 240×3, 31×16, 69×35,
140×17, 240×10, 1×31, 1×153, 1×240). Observation
conditions were a viewing distance of 500 mm, and
view angle normal to the center of the LCD. The
experiment room was a darkroom, and the background
luminance of the luminance mura was 48 cd/m
2
.
R1-2.3 Subjects/Experiment Procedure
R1-2.3.1 The subjects for the experiment were 16
adults, with no eye disease and with near vision
strength (50 cm) of 1.2 or greater for both eyes. Of the
16 subjects, there was an Expert group of 8 (7 male, 1
female, average age 40 years), consisting of engineers
from LCD makers, who regularly conduct mura
inspections and analysis. The remaining 8 subjects (6
males, 2 females, average age 21) were college
students, a Novice group who were conducting
luminance mura evaluation for the first time. Using the
ten-key pad, the subjects adjusted the luminance of
mura, to a point “where mura can just no longer be
detected” (referred to as “jnd”: just noticeable
difference below) and to a “point where mura can
clearly be detected” (referred to as “distinct” below),
recording the contrasts at these times. Muras brighter
than the background and lighter than the background
were both targeted.
R1-3 Experiment Results
R1-3.1 The following matters became clear from the
experiment.
• The larger the area of the mura, the smaller jnd
contrast (C jnd) became. (Muras are more visible
as area becomes larger)
• Muras with a width of one pixel, compared to other
muras, require nearly 1.5 to 2 times the contrast.
(Muras with a width of one pixel are difficult to
detect)
• Comparing the distribution between the subjects,
there was no difference between the Expert and
Novice groups for jnd contrast (C jnd)
• Compared to the Expert group, the Novice group
had a larger distribution for distinct contrast.
R1-3.2 The relation between mura area and jnd
contrast showed the same trend as in past experience
[1]
,
and the quality of reproducibility was confirmed.
Therefore at this point, for the sake of standardization,
we examined the function for mura area, and tried
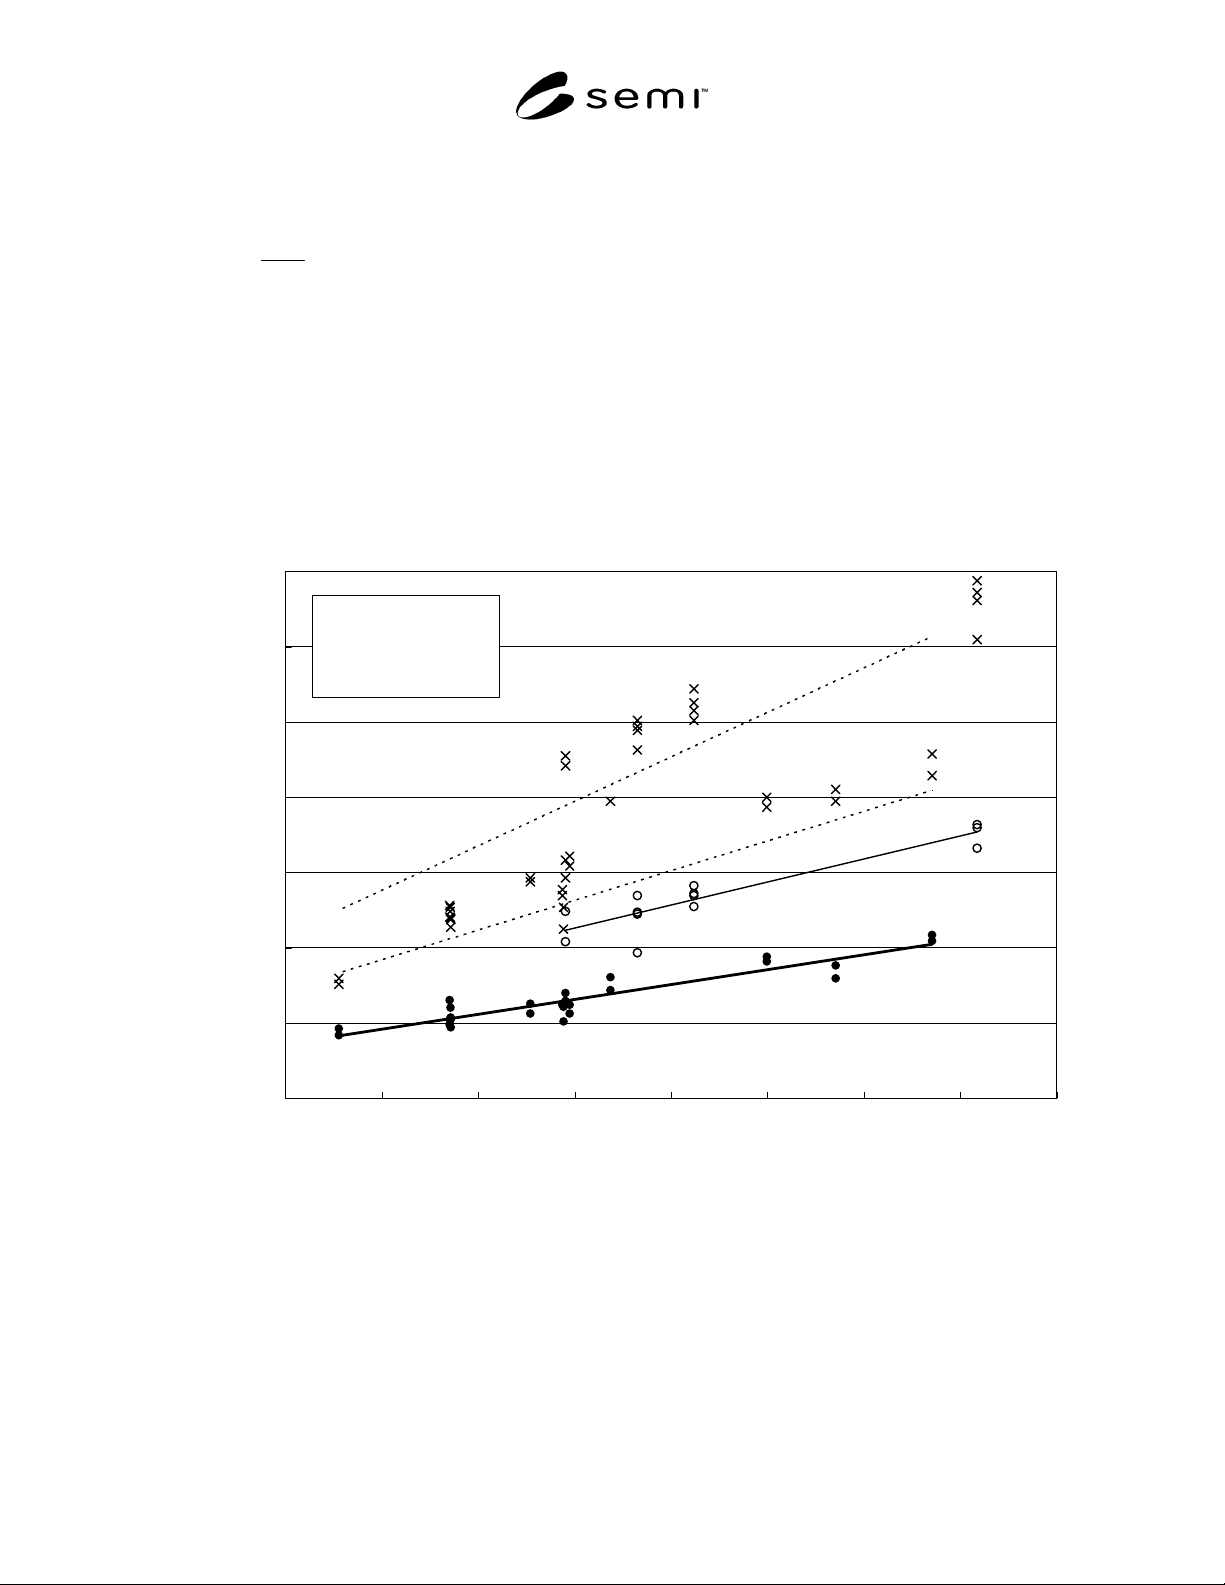
linear regression for it with jnd contrast. Figure 1
shows the results. When the horizontal axis is
33.0
1
S
(S is mura area in mm
2
units), and the vertical axis is at
contrast, the bold line shows a strong correlation
coefficient, understood through linear regression.
R1-3.3 This bold line shows the relation between mura
area and contrast at the point where the mura becomes
just not detectable (jnd), and if area is determined, then
jnd contrast (C jnd) can be figured out. In Figure 1, ○
is a mura with a width of one pixel, and ● represents
other muras (not one pixel wide) respectively
representing the averages of the 16 subjects. As noted
above in 2), a mura with a width of one pixel tends to
be slightly different, which is why they were handled
separately. Also considering past experiment results,
when viewing distance is 500mm, the 0.3mm level
SEMI D31-1102 © SEMI 2002 4
seems to be the boundary. Here we propose Equation 1
which regressively analyzes the ● in Figure 1 as
criteria for standardization.
72.0
1
97.1
33.0
+
=
S
Cjnd
….. Equation 1
R1-3.4 The criteria for standardization, jnd, is
determined by the C jnd straight line, but we also
propose, based on this criteria, quality levels for other
visible muras. Figure 1 shows straight lines made up of
2.0 jnd and 3.0 jnd. × is distinct contrast for the
Expert group, but in cases besides 1-pixel wide muras,
it can be understood to be distributed slightly above the
2.0 jnd straight line.
R1-3.5 This indicates that the straight-line relationship
of Figure 1 is not only jnd level, but also consists of
visible contrast level. Accordingly, with the bold line
jnd as a standard, mura quality level can be expressed
by n in n x jnd. From the experiment results this time,
from 3.0 being a level slightly above distinct, it can be
thought that it is desirable to operate using a range of
levels 1.0 to 3.0.
R1-4 Summary
R1-4.1 A proposal was made regarding the
quantization of FPD luminance mura. The quality level
of a mura can be expressed as a function between mura
area and contrast, using the contrast at the jnd point as
criteria. By using this method, even if mura area,
shape, or contrast is different, we can now calculate
similar quality level jnd.
C jnd = 1.97 (1/f(S) ) + 0.72
R
2
= 0.87
0
1
2
3
4
5
6
7
0.0 0.1 0.2 0.3 0.4 0.5 0.6 0.7 0.8
1/f(S)
Contrast (%)
3.0 jnd
2.0 jnd
1 pixel-width Mura
f(S) = S
0.33
S :unit (mm
2
)
Figure R1-1
Relation between luminance mura area and jnd contrast (C jnd)
(●: jnd contrast of mura not 1 pixel wide, ○:jnd contrast of mura 1 pixel wide,
×: Distinct contrast of all muras (Average of Expert group only))
Prepared by R. Yoshitake and T. Tamura