semi合集-English.pdf - 第4114页
SEMI F60-0301 © SEMI 2001 10 Theor eti cal 0 10 20 30 40 50 60 70 80 90 100 0 5 10 15 20 25 30 35 40 45 Angst r om s Atomic Concent ration Cr Fe Ni Mo O C Figure A1-9 Composition versus depth of a carbon layer over a Cr …
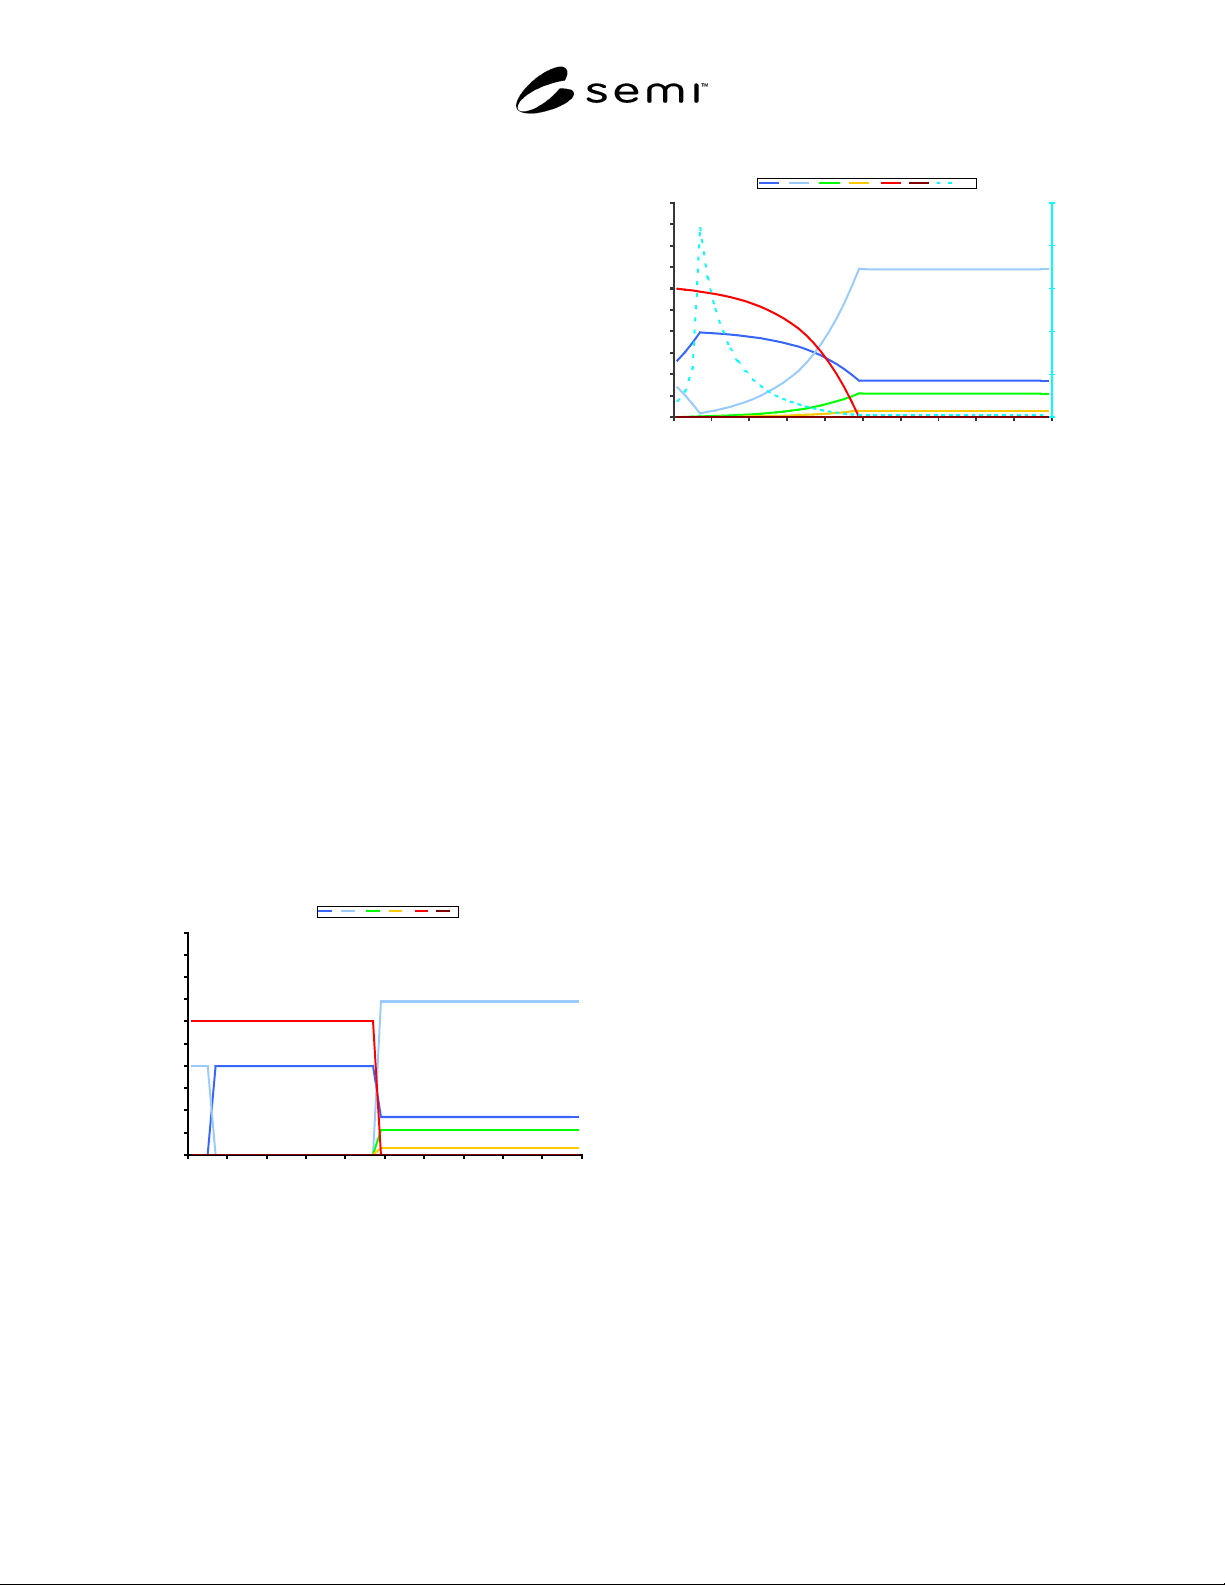
SEMI F60-0301 © SEMI 20019
It is apparent in Figures A1-5 and A1-6 that this
underestimates the oxide thickness by 15 to 20%.
A1-1.8.1 It should also be noted that the Cr:Fe ratio
measured from Figures A1-5 and A1-6 has its
maximum value at the initial surface, decreasing as the
depth profile progresses, whereas the actual Cr:Fe ratio
in Figure A1-5 is infinite down to 25 Å. Most actual
depth profiles exhibit a maximum of the Cr:Fe ratio at
some depth below the initial surface, referred to as the
depth of maximum enrichment. This is a consequence
of variation in the actual composition of the oxide,
possibly having a higher concentration of Fe near the
surface, a phenomenon commonly termed a “detached
iron oxide layer”, or of contamination on the surface,
generally hydrocarbons. These are discussed in the
next section.
A1-1.9 Effects of Detached Iron Oxide Layer and
Surface Contamination — The model composition
profile of Figure A1-7 shows 3 Å of pure Fe
2
O
3
over 22
Å of pure Cr
2
O
3
on 316L stainless steel. This is a
model of a detached iron oxide layer. Figure A1-8 is
the theoretical depth profile of this model derived
assuming a depth of analysis of 5 lambda. Note that the
initial Cr value in the profile is higher than the Fe value,
even though the surface is pure Fe
2
O
3
. This is a
consequence of the depth of analysis detecting the Cr
from levels beneath the surface. The Cr:Fe ratio for
this model has its maximum value at 3 Å below the
initial surface. The theoretical depth profile using a
depth of analysis of 3λ is very similar.
Theoretical
0
10
20
30
40
50
60
70
80
90
100
0 5 10 15 20 25 30 35 40 45
Angstroms
Atomic Concentration
Cr Fe Ni Mo O C
Figure A1-7
Composition versus depth of a Fe
2
O
3
layer over a
Cr
2
O
3
layer on stainless steel.
Convoluted 5 Lambda
0
10
20
30
40
50
60
70
80
90
100
0 5 10 15 20 25 30 35 40 45
Angstroms
Atomic Concentration
0
5
10
15
20
25
Cr Fe Ni Mo O C Cr:Fe
Figure A1-8
Theoretical depth profile of Figure A1-7 assuming
5λ
λλ
λ depth of analysis.
A1-1.10 The model composition profile of Figure A1-9
shows 3 Å of pure carbon over 22 Å of pure Cr
2
O
3
on
316L stainless steel, representing an idealized model of
the adsorbed hydrocarbon contamination generally
found on stainless steel surfaces exposed to the
atmosphere. Figure A1-10 is the theoretical depth
profile of this model assuming a depth of analysis of
5λ. In this case the O, Cr and Fe atomic concentration
values are reduced by the presence of the carbon until
the depth profiling proceeds past the carbon, but they
have the same relative values (ie: same Cr:Fe ratio)
versus depth as derived in the uncontaminated model.
The maximum of the Cr:Fe ratio is seen to be at the
initial surface. Although the actual oxide thickness is
less in this model, the FWHM measure of the oxide
thickness from the depth profile is the same due to the
presence of the carbon layer. Note that the Oxygen
concentration profile initially increases to a maximum,
then decreases. This is typical of Oxygen concentration
profiles seen on actual samples, which will generally
have some adsorbed hydrocarbon contamination on the
surface.
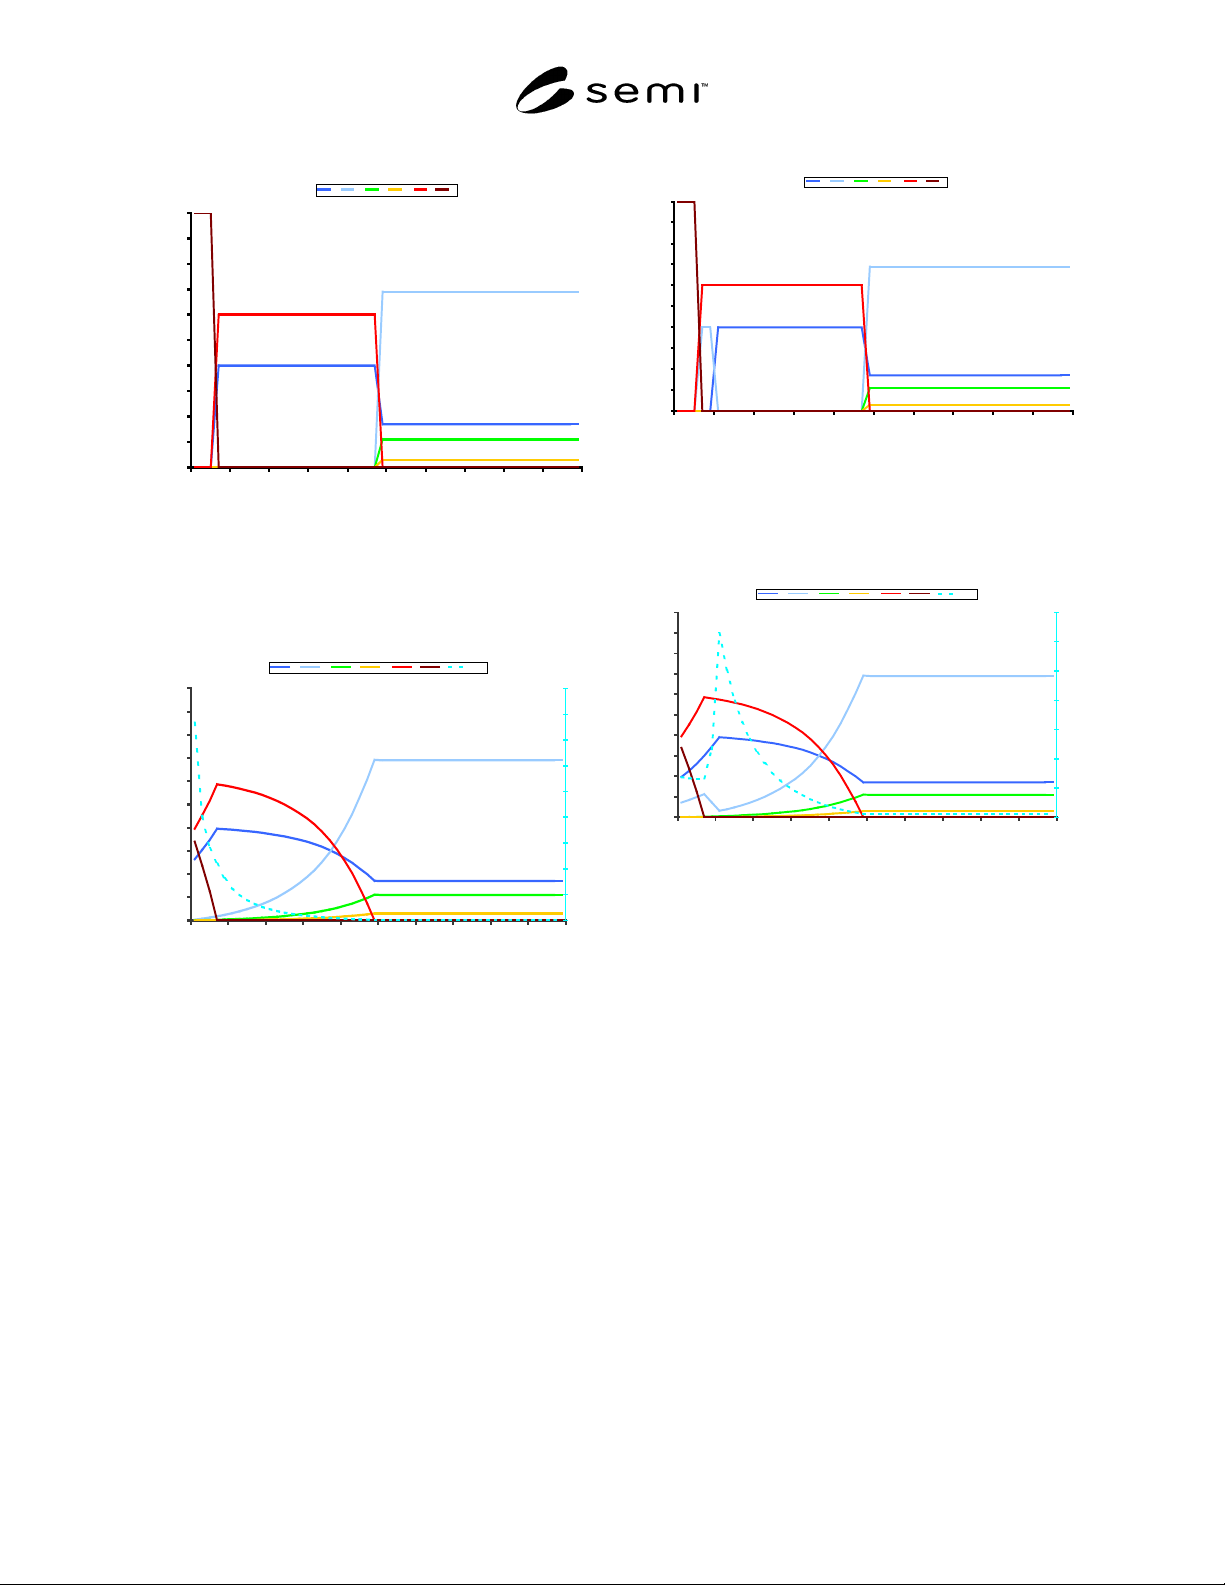
SEMI F60-0301 © SEMI 2001 10
Theoretical
0
10
20
30
40
50
60
70
80
90
100
0 5 10 15 20 25 30 35 40 45
Angstroms
Atomic Concentration
Cr Fe Ni Mo O C
Figure A1-9
Composition versus depth of a carbon layer over a
Cr
2
O
3
layer on stainless steel.
Convoluted 5 Lambda
0
10
20
30
40
50
60
70
80
90
100
0 5 10 15 20 25 30 35 40 45
Angstroms
Atomic Concentration
0
10
20
30
40
50
60
70
80
90
Cr Fe Ni Mo O C Cr:Fe
Figure A1-10
Theoretical depth profile of Figure A1-9 assuming
5λ
λλ
λ depth of analysis.
A1-1.11 The model composition profile of Figure A1-
11 shows a 3 angstrom carbon layer over 3 Å of pure
Fe
2
O
3
over 19 Å of pure Cr
2
O
3
on 316L stainless steel.
Figure A1-12 is the theoretical depth profile of this
model assuming a depth of analysis of 5λ. This profile
is seen to be similar to the depth profiles generally
observed for passivated stainless steel. The Cr:Fe ratio
maximum occurs below the initial surface, and the
initial surface atomic concentrations of the elements of
interest are diluted by the presence of the carbon layer
on the surface. The oxide thickness, as measured by the
FWHM technique, is affected by both the presence of
the carbon layer and the depth of analysis.
Theoretical
0
10
20
30
40
50
60
70
80
90
100
0 5 10 15 20 25 30 35 40 45
Angstroms
Atomic Concentration
Cr Fe Ni Mo O C
Figure A1-11
Composition versus depth of a carbon layer over a
Fe
2
O
3
layer over a Cr
2
O
3
layer on stainless steel.
Convoluted 5 Lambda
0
10
20
30
40
50
60
70
80
90
100
0 5 10 15 20 25 30 35 40 45
Angstroms
Atomic Concentration
0
2
4
6
8
10
12
14
Cr Fe Ni Mo O C Cr:Fe
Figure A1-12
Theoretical depth profile of Figure A1-11 assuming
5λ
λλ
λ depth of analysis.
A1-1.12 It must be emphasized that these derived
depth profiles are for models with perfect interfaces and
perfect compositions instead of the compositional
gradients observed in real systems. Additional
measurement uncertainties result from roughness and
non-planarity of the surface, and from differential
sputtering rates for different chemical species during
depth profiling.
A1-1.13 The depth profiles of real systems must be
interpreted with an understanding of the effects
described in this Appendix and a realization that they
are not ideal. The same considerations pertain to Auger
depth profile analysis.

SEMI F60-0301 © SEMI 200111
NOTICE: SEMI makes no warranties or
representations as to the suitability of the standards set
forth herein for any particular application. The
determination of the suitability of the standard is solely
the responsibility of the user. Users are cautioned to
refer to manufacturer’s instructions, product labels,
product data sheets, and other relevant literature
respecting any materials mentioned herein. These
standards are subject to change without notice.
The user’s attention is called to the possibility that
compliance with this standard may require use of
copyrighted material or of an invention covered by
patent rights. By publication of this standard, SEMI
takes no position respecting the validity of any patent
rights or copyrights asserted in connection with any
item mentioned in this standard. Users of this standard
are expressly advised that determination of any such
patent rights or copyrights, and the risk of infringement
of such rights, are entirely their own responsibility.
Copyright by SEMI® (Semiconductor Equipment and Materials
International), 3081 Zanker Road, San Jose, CA 95134. Reproduction o
f
the contents in whole or in part is forbidden without express written
consent of SEMI.