semi合集-English.pdf - 第5173页
SEMI M32-0998 © SEMI 1998, 2004 12 A4-4.1 First, please note that the term “sig ma” is intentionally used , rather than “standard deviation”. This does not in any way im ply 100% sampling. Instead, the implication is tha…
SEMI M32-0998 © SEMI 1998, 2004 11
0
5
0
100
8
10
13
15
18
20
23
26 28
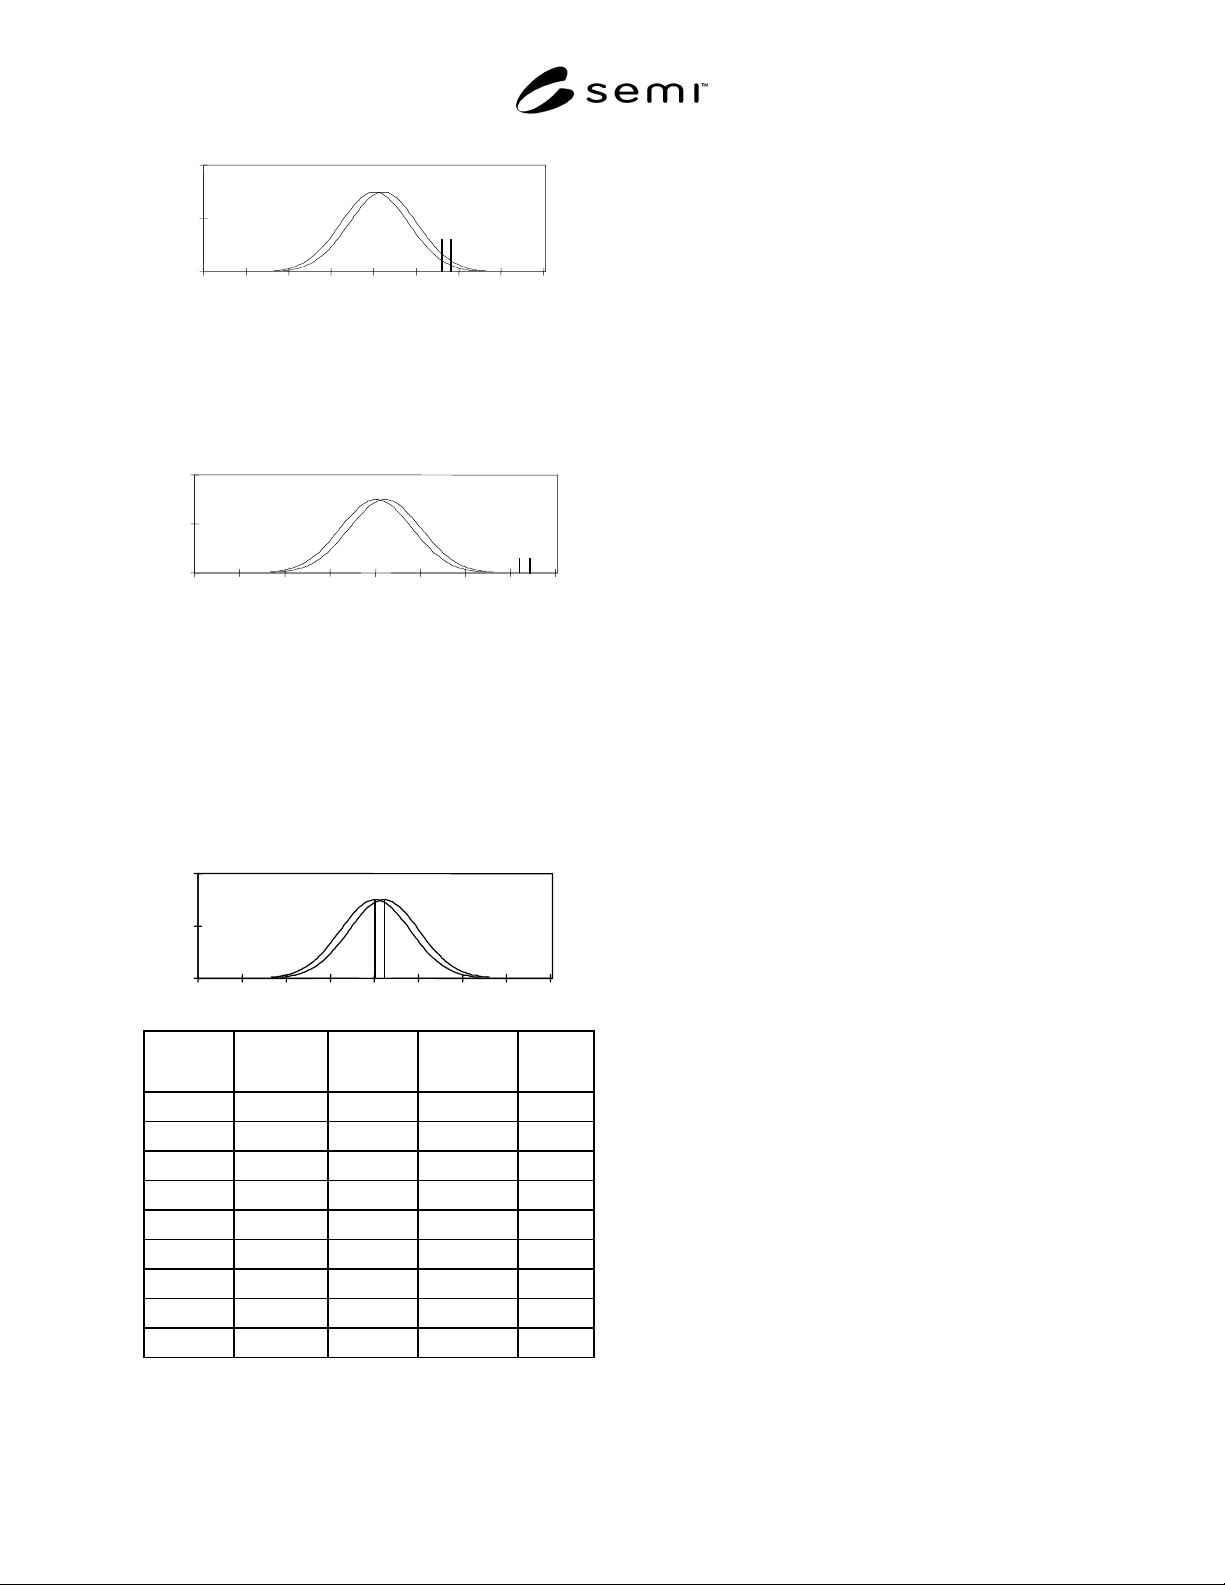
Figure A4-4
Error at 2 Sigma
A4-3.7 The error when the specification is 2 sigma
from the mean, shown in Figure A4-4 as the area
between the vertical lines and below the right curve, is
1.73% or 17,300 ppm.
0
50
100
8
10
13
15
18
20
23
26 28
Figure A4-5
Error at 4 Sigma
A4-3.8 The error when the specification is 4 sigma
from the mean, shown in Figure A4-5 as the area
between the vertical lines and below the right curve
(but indistinguishable), is 0.01% or 100 ppm.
A4-3.9 Figure A4-4 further quantifies this error.
Percent-less-than calculations are shown for each curve
at increments of 1 sigma from the mean. The starting
mean is 18, and the sigma is 2.
0
50
100
8
10
13
15
18
20
23
26 28
Value
Value
Description
Left
Curve %
Right
Curve %
Error
%
10 - 4 s 0.01 0.00 0.01
12 - 3 s 0.13 0.06 0.07
14 - 2 s 2.28 1.22 1.06
16 - 1 s 15.87 10.56 5.31
18 mean 50.00 40.13 9.87
20 + 1 s 84.13 77.34 6.79
22 + 2 s 97.72 95.99 1.73
24 + 3 s 99.87 99.70 0.17
26 + 4 s 100.00 99.99 0.01
Figure A4-6
Percentage Error
A4-3.10 Please note that this is a very conservative
example. The delta and the resulting error can get much
larger.
A4-3.11 A major concern is what to do when the
specification is not met. Users would certainly not want
suppliers to reject material in the center of the
distribution. Alternatives are to (1) reject the whole
shipment, (2) reject nearby lots, (3) mix and match lots,
or (4) translate the percentage hypothetically lost in the
center back out to the tail in order to reject the worst
material. The first two alternatives are really more like
penalties and would lead to unnecessary loss of good
material. The third is the worst form of inspecting in
quality. It is generally agreed that this is the main thing
to avoid. Translating the error back to the tail is
possible but not necessarily a good approach. This
would involve translating a reject percentage with a
large potential error back out to a region that would
have had a very small error. A multiple percentile
specification can also be quite difficult in a production
environment. Each of the percentile criteria must be
evaluated to determine which one requires the highest
reject rate. That reject rate must then be translated back
to the tail, and 100% sample data must be used to
determine which actual pieces to reject. If the statistical
distribution is defined, one specification would give the
same amount of information with much less work. If
only one criterion is used, and it is well out on the tail
(hopefully in the ppm range) then this method is very
similar to a statistical specification.
A4-3.12 A commonly stated goal of multiple percentile
specifications is to focus on centering rather than
distribution tails. All of the discussion in Section A4-
2.2 concerning centering is equally applicable here.
Multiple percentile specifications are more likely to
cause inspected-in quality which detracts from process
control based centering.
A4-3.13 Ease of use is another stated goal, but for all
of the reasons stated above, this method is one of the
most difficult to use. Statistical calculations can be
done in milliseconds while the potential of large
samplings, raw data manipulation, and duplicate effort
associated with multiple distributional percentile
specifications create much more work. Characterizing
with percentiles is an alternative for processes that have
not yet been statistically characterized, but once that
hurdle is crossed, everything gets many times easier.
A4-4 Mean and Sigma Specifications
Mean
≤
Value, Sigm
a
≤ Value, o
r
Low to High Mean, Sigma ≤ Value

SEMI M32-0998 © SEMI 1998, 2004 12
A4-4.1 First, please note that the term “sigma” is
intentionally used, rather than “standard deviation”.
This does not in any way imply 100% sampling.
Instead, the implication is that the process would need
to be monitored long enough to understand the “process
sigma” (i.e., the state at which the process can be
controlled).
A4-4.2 Mean and sigma specifications intuitively seem
very promising, but they have many of the same
problems as multiple distributional percentile
specifications. Here, the issue of statistical sensitivity is
particularly important. Table A4-1, and the discussion
in Section A4-3.4 concerning sampling requirements,
explain the central issue. The sample sizes required to
detect smaller mean shifts are very large, so they
usually are not feasible at the process control point. As
a result, mean and sigma specifications could lead to
much more sampling in an inspection area or in the
warehouse, where larger quantities are available. To
keep the sample sizes small, it is necessary to allow a
specified amount of process drift. Therefore, some form
of tolerance is necessary.
A4-4.3 Another factor that needs careful consideration
is the movement toward controlling surrogate variables
instead of outgoing parameters. Many types of variation
can be controlled by carefully applying the appropriate
samplings (within batch samples for batch-to-batch
variation, within lot samples for lot-to-lot variation,
etc.). However, there are practical limitations on how
many types of variation can be continuously monitored.
There is a large amount of work involved, and there are
hundreds of potential sources of variation. Resource
restrictions regularly force suppliers to concentrate on
the known key variables and leave the rest as error in
the system (at least for now). This practice, called
homogeneous sampling, is designed to continuously
home in on the variables that have the greatest impact
on the distribution. Strictly speaking, for characterizing
process capability, a random and over-time sampling
which covers all sources of variation should be used. In
practice, this is difficult to do, so engineering judgment
is needed to select the most appropriate homogeneous
sampling. This is yet another issue that could generate
significant errors if it is not fully understood.
A4-4.4 From an ease-of-use standpoint, mean and
sigma specifications have many of the same issues as
multiple distributional percentile specifications. Mixing
and matching of lots would be especially tempting with
this approach because it might be the only practical
alternative.
NOTICE: SEMI makes no warranties or
representations as to the suitability of the standards set
forth herein for any particular application. The
determination of the suitability of the standard is solely
the responsibility of the user. Users are cautioned to
refer to manufacturer’s instructions, product labels,
product data sheets, and other relevant literature
respecting any materials mentioned herein. These
standards are subject to change without notice.
The user’s attention is called to the possibility that
compliance with this standard may require use of
copyrighted material or of an invention covered by
patent rights. By publication of this standard, SEMI
takes no position respecting the validity of any patent
rights or copyrights asserted in connection with any
item mentioned in this standard. Users of this standard
are expressly advised that determination of any such
patent rights or copyrights, and the risk of infringement
of such rights, are entirely their own responsibility.
Copyright by SEMI® (Semiconductor Equipment and Materials
International), 3081 Zanker Road, San Jose, CA 95134. Reproduction o
f
the contents in whole or in part is forbidden without express written
consent of SEMI.

SEMI M33-0998 © SEMI 19981
SEMI M33-0998
TEST METHOD FOR THE DETERMINATION OF RESIDUAL SURFACE
CONTAMINATION ON SILICON WAFERS BY MEANS OF TOTAL
REFLECTION X-RAY FLUORESCENCE SPECTROSCOPY (TXRF)
1 Purpose
1.1 The test provides the analytica l procedure to
determine the trace level of contaminating elements of
an atomic number higher than 15 on polished or
epitaxial silicon wafer surfaces in native or thermally
grown or tetraethylorthosilicate (TEOS) oxide or in
residues of microdroplets of process chemicals or
media as analyzed with TXRF on silicon wafer surfaces
as described in Sections 15.1 and 15.2.
2 Scope
2.1 This document specifies a VPD -TXRF (Vapor
Phase Decomposition Total Reflection X-Ray
Fluorescence Spectroscopy) method to analyze the
elemental composition and areal density of impurities,
that include cations and anions with atomic numbers
between 16 (S) and 92 (U) independent of their
chemical state, with the exception of the X-ray source
material, on polished or epitaxial silicon wafer surfaces
in native or thermally grown oxide or in residues of
microdroplets of process chemicals or media as
analyzed with TXRF on silicon wafer surfaces.
2.2 This test is especially useful fo r analyzing metallic
elements such as K, Ca, Ti, V, Cr, Mn, Fe, Co, Ni, Cu,
Zn, (Mo), Pd, Ag, Sn, Sb, Ta, (W), Pt, (Au), Hg, and Pb
and non-metallic elements such as S, Cl, As, Br, and I
through their characteristic K and L lines. (Elements in
brackets are usual X-ray sources.) For limitations in the
nature of analytes refer to the note in Section 14.7.
2.3 This test method can be used t o analyze areal
surface contamination that can be collected in a
microdroplet during the specified VPD preparation and
the collection of the digested surface contamination in
the range of 5 × 10
8
through 5 × 10
12
atoms/cm
2
.
2.4 Theoretically, the detection limit (LOD) of each
analyte depends upon its atomic number. As defined by
DIN 32645 “Limit of detection, determination and
quantification” the LOD of TXRF is also depending
upon many parameters, such as:
— excitation energy,
— intensity of incident X-ray,
— instrumental background,
— crystallographic interferences, such as Bragg
diffraction conditions,
— impurities in the beam path,
— contamination of the blank scanning solution
(see Section 4.5),
— contamination level in the analytical ambient,
— surface microroughness of wafer at the
microdroplet (see Section 6.7), and
— integration time.
2.5 Concerning the surface conditions to be analyzed,
the VPD-TXRF method is invasive. Nevertheless, the
TXRF analysis of the microdroplet residue can be
repeated many times provided that the prepared
specimen is stored in a clean environment. The
substrate and/or surrogate wafers can be recycled for
monitoring purposes.
2.6 The user of this test method must assure that the
metrology equipment is under control by the procedures
commonly utilized in the performing laboratory. In the
absence of established control procedures the use of
4.11.2 EN-ISO 9001 is recommended.
NOTICE SAFETY PRECAUTIONS — This standard
does not purport to address the safety concerns,
associated with its use. It is the responsibility of the
user of this standard to establish and maintain
appropriate safety and health practices and comply with
the local regulatory ordinance. X-ray irradiation and
handling of HNO
3
, HF and H
2
O
2
are dangerous.
Operators must comply with X-ray safety regulations
and be trained to wear protective garments and glasses
when handling HNO
3
, HF and H
2
O
2
. These chemicals
should be handled in a ventilated area (under exhaust.)
3 Referenced Documents
3.1 SEMI Standards
SEMI C7.3 — Standard for Hydrofluoric Acid, Grade 2
SEMI C7.5 — Standard for Hydrogen Peroxide, Grade
2
SEMI C7.6 — Standard for Nitric Acid, Grade 2
SEMI C10.1 — Guide for Determination of Method
Detection Limits for Trace Metal Analysis by Plasma
Spectroscopy
SEMI E45 — Test Method for the Determination of
Inorganic Contamination from Minienvironments