semi合集-English.pdf - 第477页
SEMI E68-0997 © SEMI 1997, 2003 2 8 Apparatus 8.1 See Figure 1. Figure 1 Test Set Up 8.2 Time-Keepin g Apparatus — Capable of keepi ng accurate record s within ± 10 seconds. Time-keeping requirements are not st ringent, …

SEMI E68-0997 © SEMI 1997, 2003 1
SEMI E68-0997 (Reapproved 1103)
TEST METHOD FOR DETERMINING WARM-UP TIME OF MASS FLOW
CONTROLLERS
This test method was technically reapproved by the Global Gases Committee and is the direct responsibility
of the North American Gases Committee. Current edition approved by the North American Regional
Standards Committee on July 27, 2003. Initially available at www.semi.org October 2003; to be published
November 2003. Originally published September 1997.
1 Purpose
1.1 The purpose of this method is to provide a
standardized method for quantifying the warm-up time
of an MFC.
NOTE 1: Warm-up times affect the initial performance of a
mass flow controller (MFC). Warm-up time is necessary
information in deciding if a process tool is ready to be put
back into service. In addition, warm-up data will be useful in
calibration labs.
2 Scope
2.1 The test conditions in this method are intended to
simulate bench top warm-up, with an MFC that has
been equalized to ambient conditions for 24 hours
before the application of power.
NOTICE: This standard does not purport to address
safety issues, if any, associated with its use. It is the
responsibility of the users of this standard to establish
appropriate safety and health practices and determine
the applicability of regulatory or other limitations prior
to use.
3 Limitations
3.1 Conditions in the lab may be different from
conditions found in the field and may influence test
results. This test is intended to measure warm-up under
a controlled condition.
3.2 The MFC is to be at ambient temperature before
the beginning of the test.
3.3 Due to manufacturing variability, warm-up times
may vary for the same model of MFC. This
specification addresses a method for taking a single
data point repetitively from the same MFC. Resulting
data will show exactly how warm-up effects change the
delivered flow of that particular MFC. To statistically
quantify warm-up time for a particular model of MFC,
multiple samples should be tested.
4 Referenced Documents
None.
5 Terminology
5.1 Abbreviations and Acronyms
5.1.1 DUT — Device under test
5.1.2 FS — Full scale
5.1.3 MFC — Mass flow controller
5.2 Definitions
5.2.1 device under test — the MFC being tested for
warm-up time.
5.2.2 indicated flow — flow indicated by the MFC
under test. Electrical output of the DUT.
5.2.3 stability — a condition that exhibits only natural,
random variations in the absence of unnatural,
assignable-cause variations. For the several purposes of
this test, stability is defined as ± 10% of the accuracy of
the DUT at full scale.
5.2.4 steady state — state at which the indicated flow
is stable for a 15-minute time period.
5.2.5 warm-up — a process where the MFC goes from
an unpowered condition to a condition where the output
is within ± 1% full scale, of the final steady state output.
6 Summary of Test Method
6.1 The DUT is connected in series with shut-off
valves on either side of the DUT. With no gas flow and
the DUT powered, indicated flow is monitored until
steady state is achieved. Power is briefly disconnected
then reconnected and indicated flow is again monitored
until steady state is achieved.
7 Significance and Use
7.1 Data generated by this method is used to estimate
the amount of time an MFC should be powered up in a
process tool before resuming production. When
calibrating an MFC, the warm-up time can be used to
estimate the waiting time before calibration. For power
interruptions, the power interruption warm-up time may
be used to determine the time required following a
power interruption to resume production or calibration.
SEMI E68-0997 © SEMI 1997, 2003 2
8 Apparatus
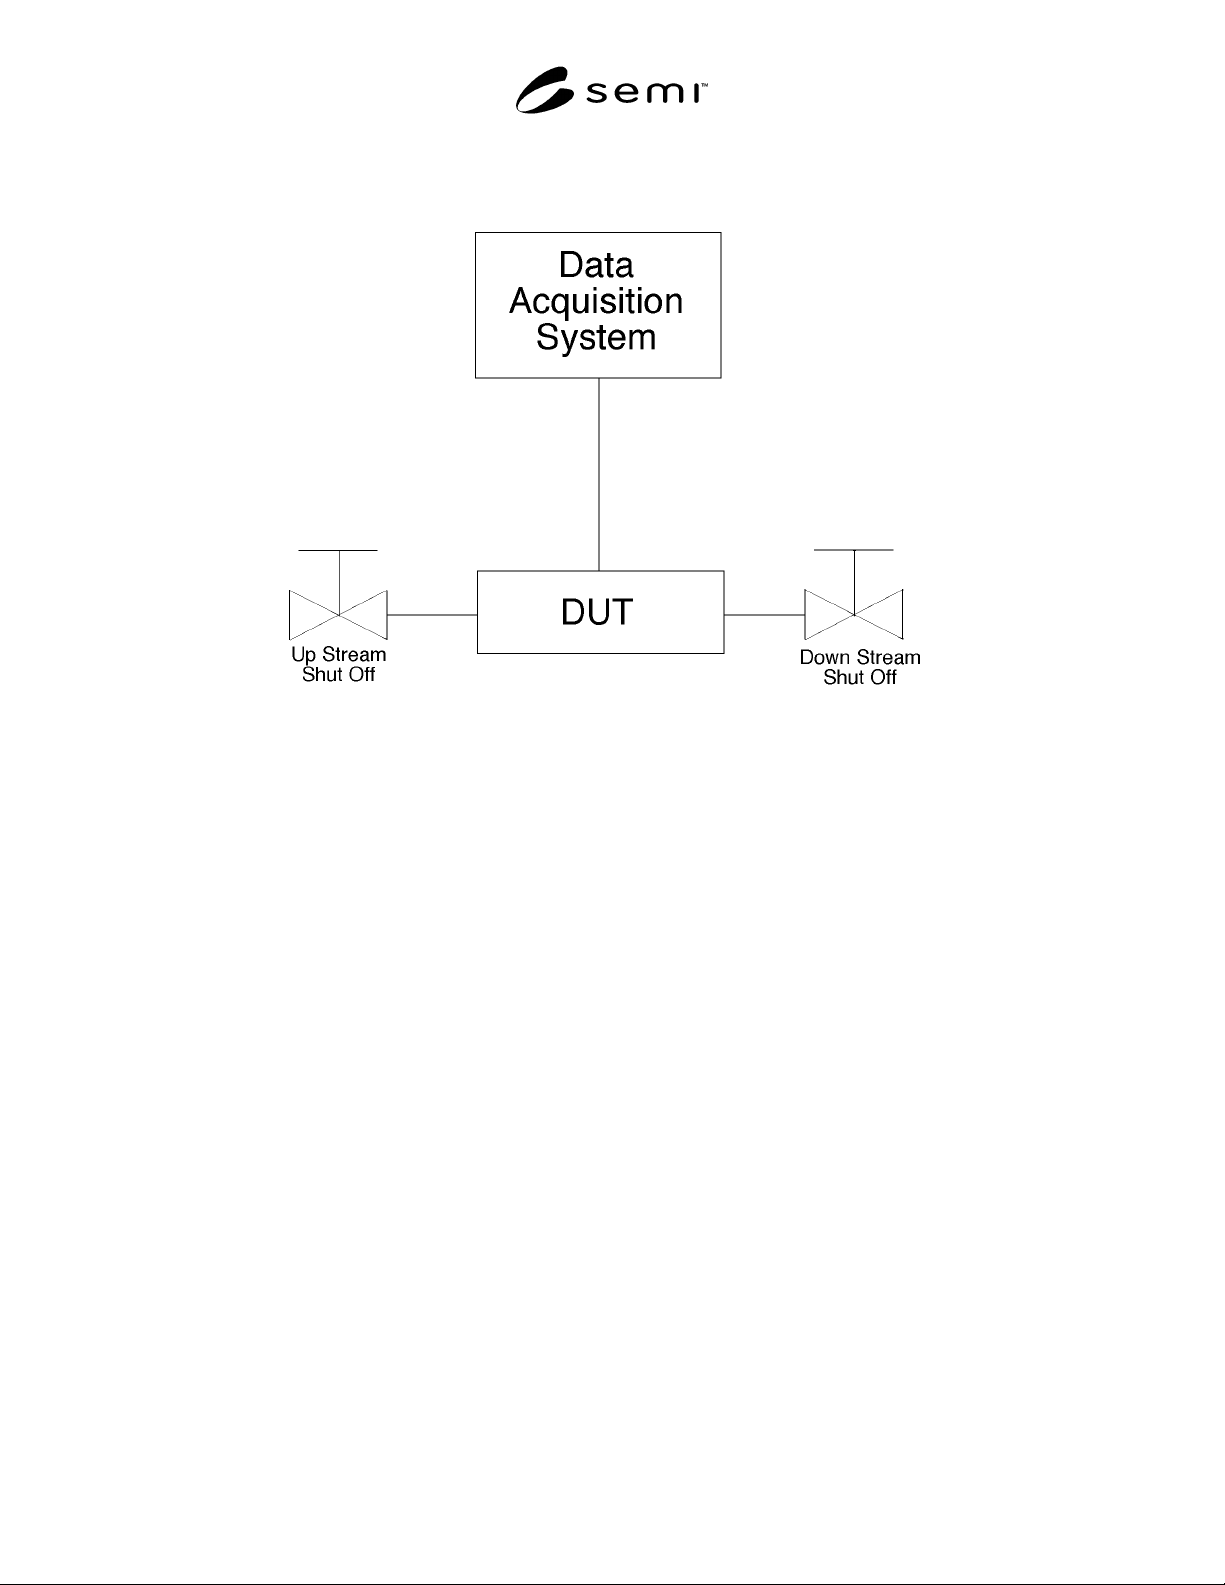
8.1 See Figure 1.
Figure 1
Test Set Up
8.2 Time-Keeping Apparatus — Capable of keeping accurate records within ± 10 seconds. Time-keeping
requirements are not stringent, and almost any apparatus is acceptable.
8.3 Data Acquisition System — Having a resolution of one mV or better and a sample rate of one Hz.
9 Conditioning
9.1 Ambient temperature must be controlled and stable between 20° C and 25° C during testing for all tests. The
DUT must be exposed to the ambient environment for 24 hours before the beginning of the test so that it is in
equilibrium. The gas temperature must be measured and verified to be at equilibrium with both the DUT and with
ambient temperature. Temperatures are in equilibrium if they are within 1° C of each other. Lab temperature may not
change more than 1° C during test.
10 Procedure
10.1 Connect the DUT in series with the two shut-off valves, one upstream of the DUT and the other downstream.
Electronically connect the DUT to a data acquisition system capable of recording indicated flow from the DUT. The
test set-up should be set to give appropriate signals to the DUT so the DUT control valve will not dissipate power.
For normally closed MFC’s, the setpoint should be zero, and for normally open MFC’s, the setpoint should be
100%. Suggested orientation of the DUT is horizontal (base down). If the DUT is positioned otherwise, the
orientation should be reported in the test data (see Figure 1). Valves are to be opened in a downstream-to-upstream
sequence and closed in reverse fashion. The data acquisition system must be warmed up as per the manufacturer’s
instructions.
10.2 Close shut-off valves.
10.3 In Table 1, record the time of day when power was applied to the DUT. Begin recording the indicated flow
from the DUT at one sample per second.
SEMI E68-0997 © SEMI 1997, 2003 3
Table 1 Format for Data Presentation
Warm-up Time Date:____________
± 1% FS Time to
Achieve
Steady State
Steady State
Value
Cold Start
Power Interruption
10.4 Cold Start — Apply power to the DUT and
continue collecting data until the indicated flow
achieves a steady state value.
10.5 Power Interruption — Continue to collect data
while disconnecting power from the test unit for 120 ±
10 seconds. Reconnect power to the DUT and monitor
indicated flow until steady state is again achieved.
11 Data Analysis
11.1 Graph the data collected from the six test
scenarios as directed in Section 10.
11.2 The time required for the DUT to achieve a steady
state value can be visually determined from the graph
of each test scenario. This data can be used to predict
the warm-up times required by an MFC experiencing a
field condition similar to the test scenario.
12 Data Presentation
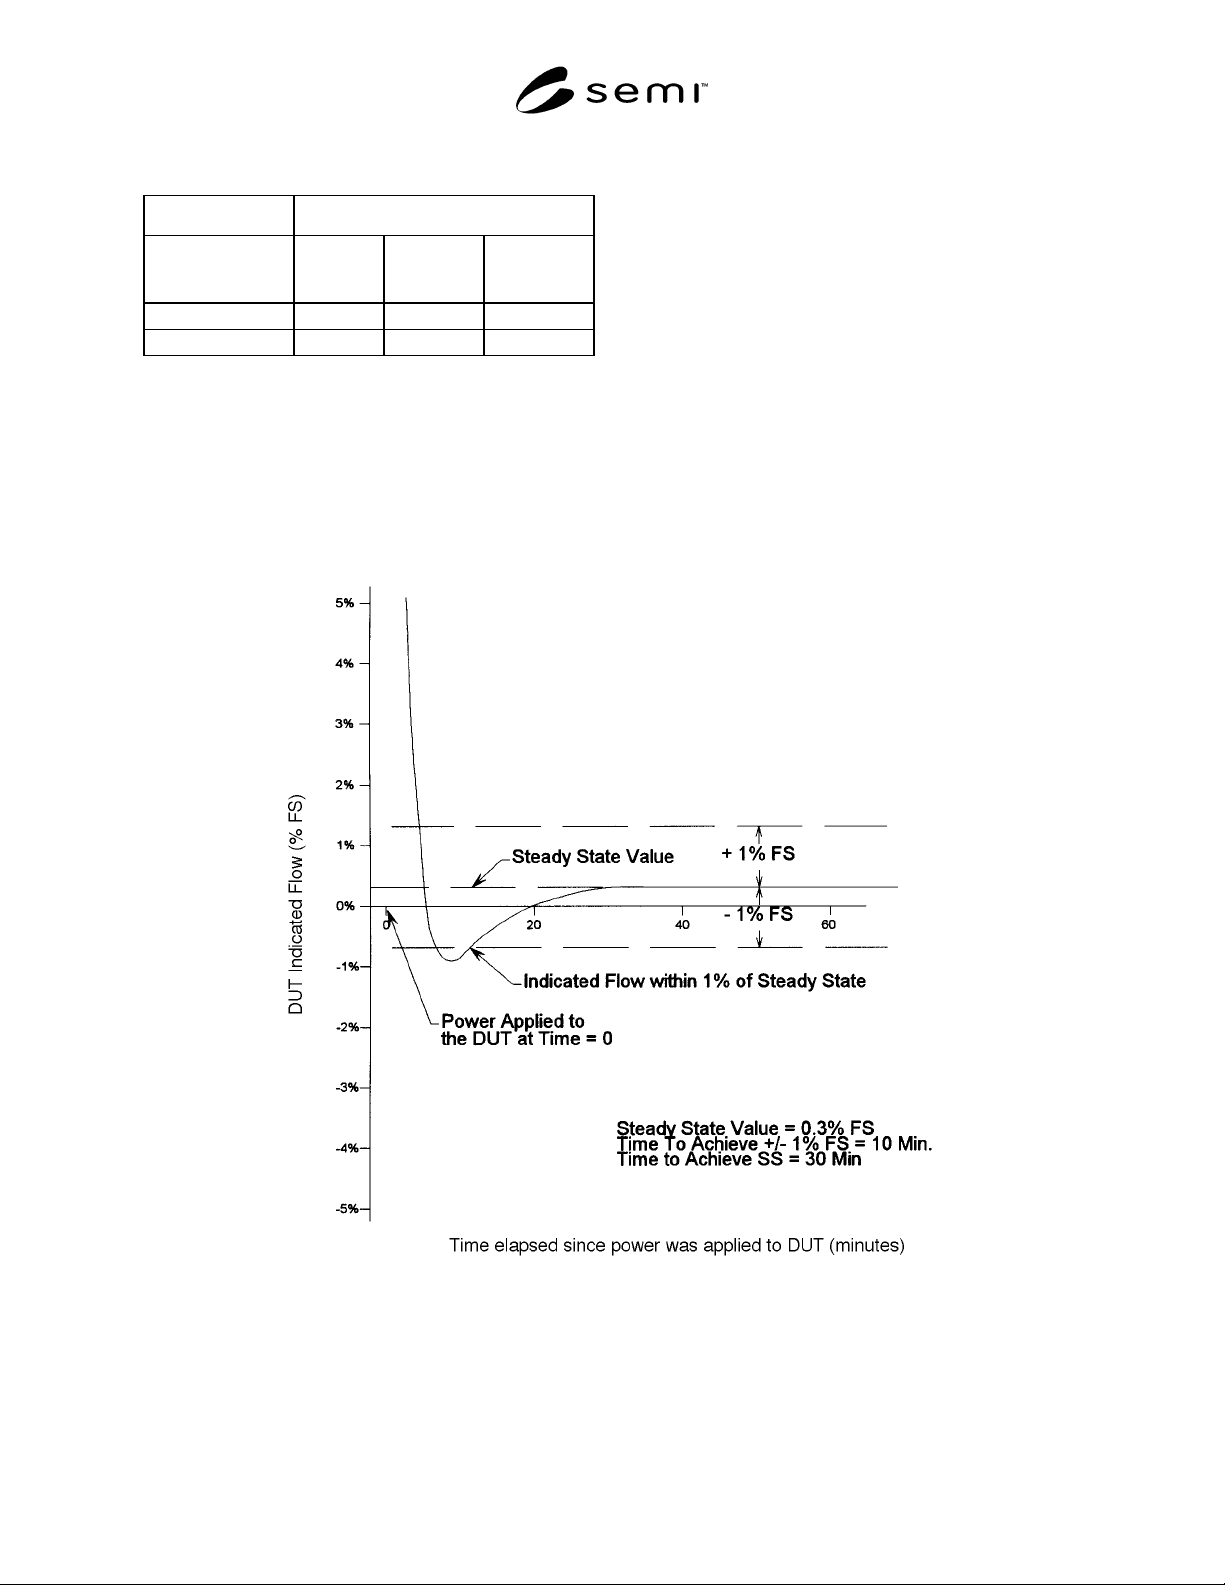
12.1 For the two tests in Section 10, plot DUT
indicated flow vs. time as illustrated in Figures 2 and 3.
Note the following on these graphs and in Table 1.
Figure 2
Cold Start Warm-Up Time