semi合集-English.pdf - 第6231页
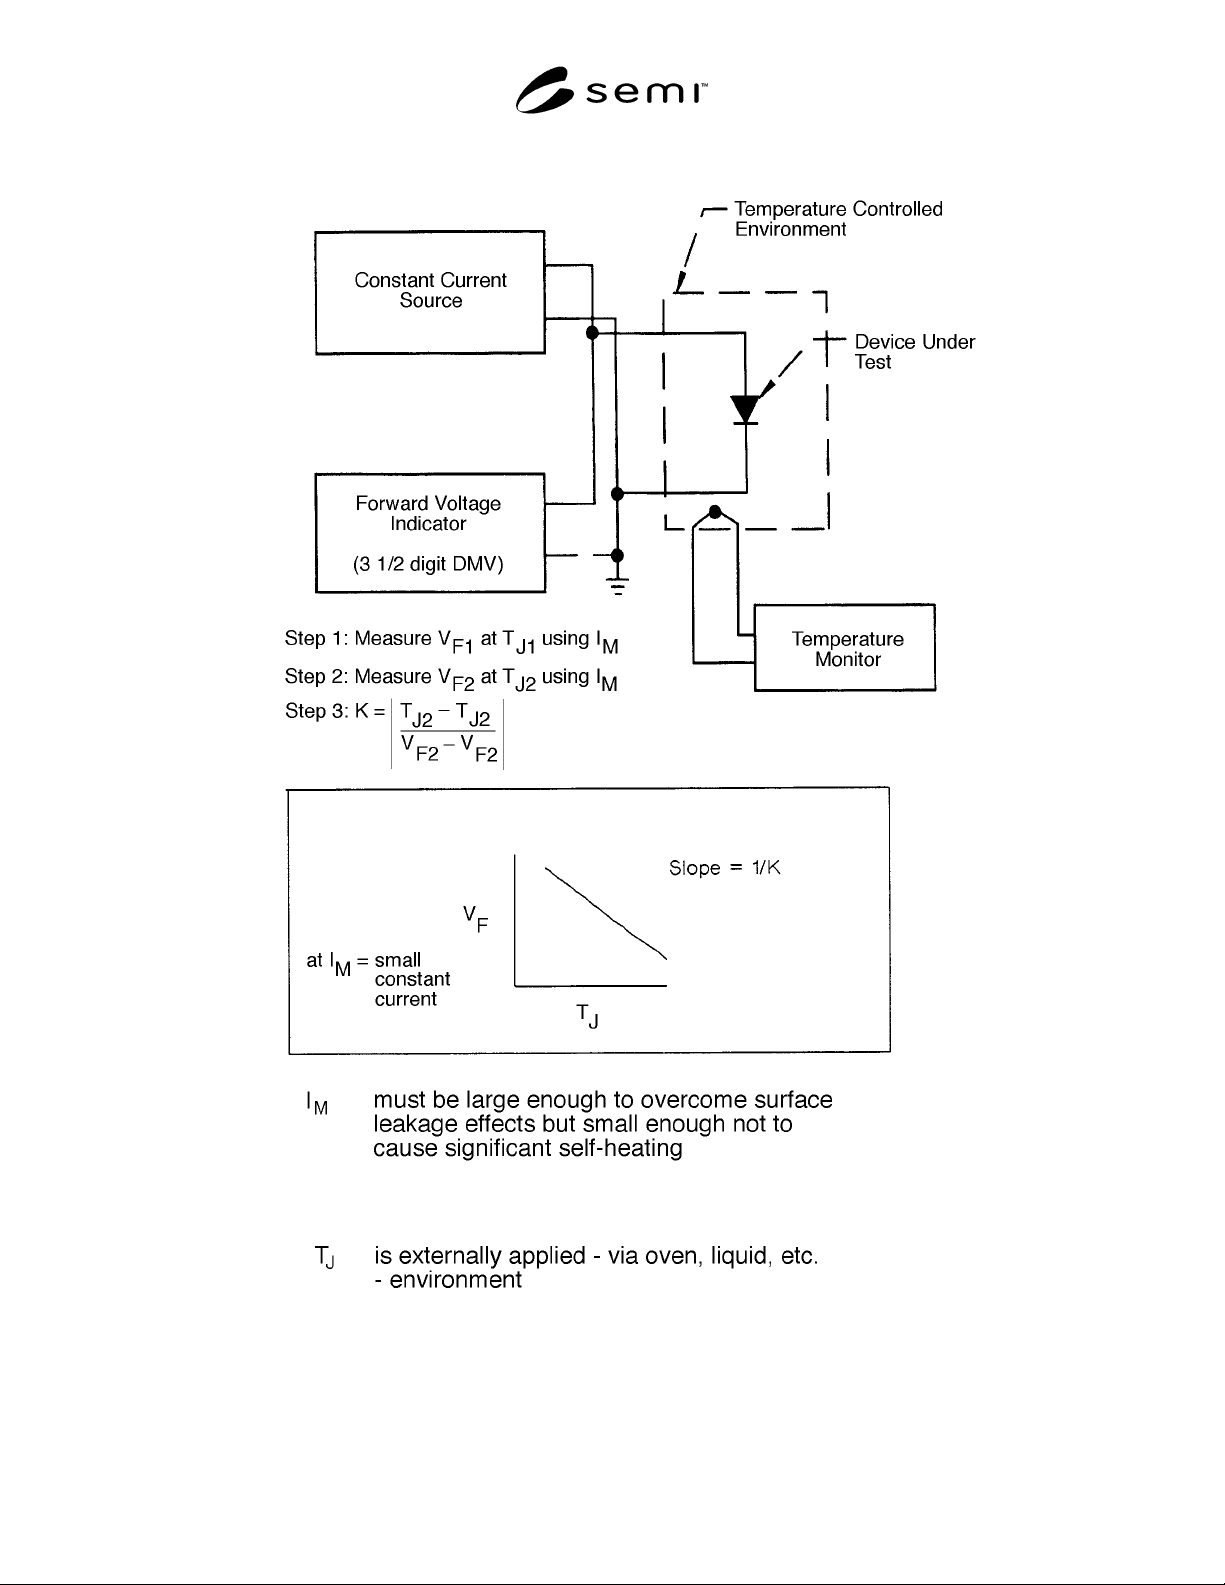
SEMI G46-88 © SEMI 1988 8 Figure 7 K Factor Calibra tion Setup and Procedure
SEMI G46-88 © SEMI 19887
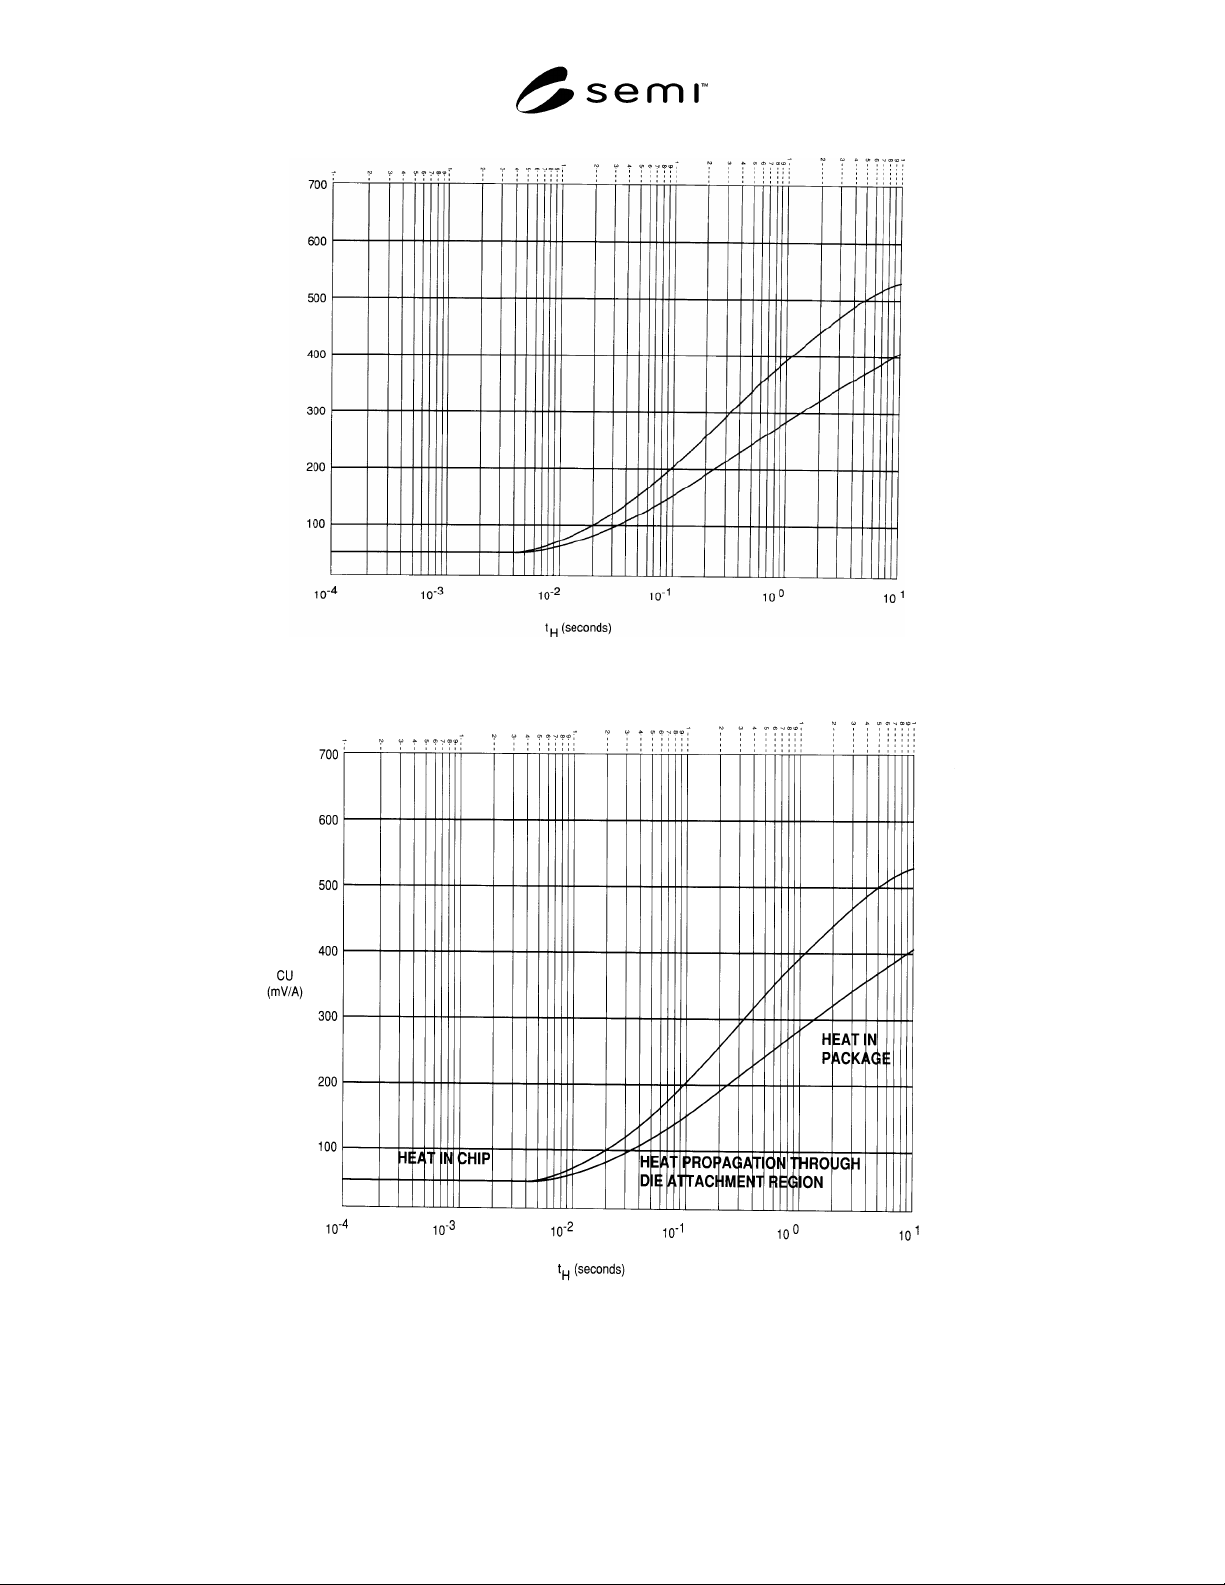
Figure 5
Figure 6
Interpretation of Heating Curves of Figure 5
NOTE: Inflection point in curve occurs at approximately t
H
= 400 ms.
SEMI G46-88 © SEMI 1988 8
Figure 7
K Factor Calibration Setup and Procedure
SEMI G46-88 © SEMI 19889
V = 5.0 v
T = 400 ms
I = 1.0 mA
t = 20
CU = 249 mV/A
σ
= 53.5 mV/A
CU = 302.5 mV/A
H
H
M
MD
cu
high
limit
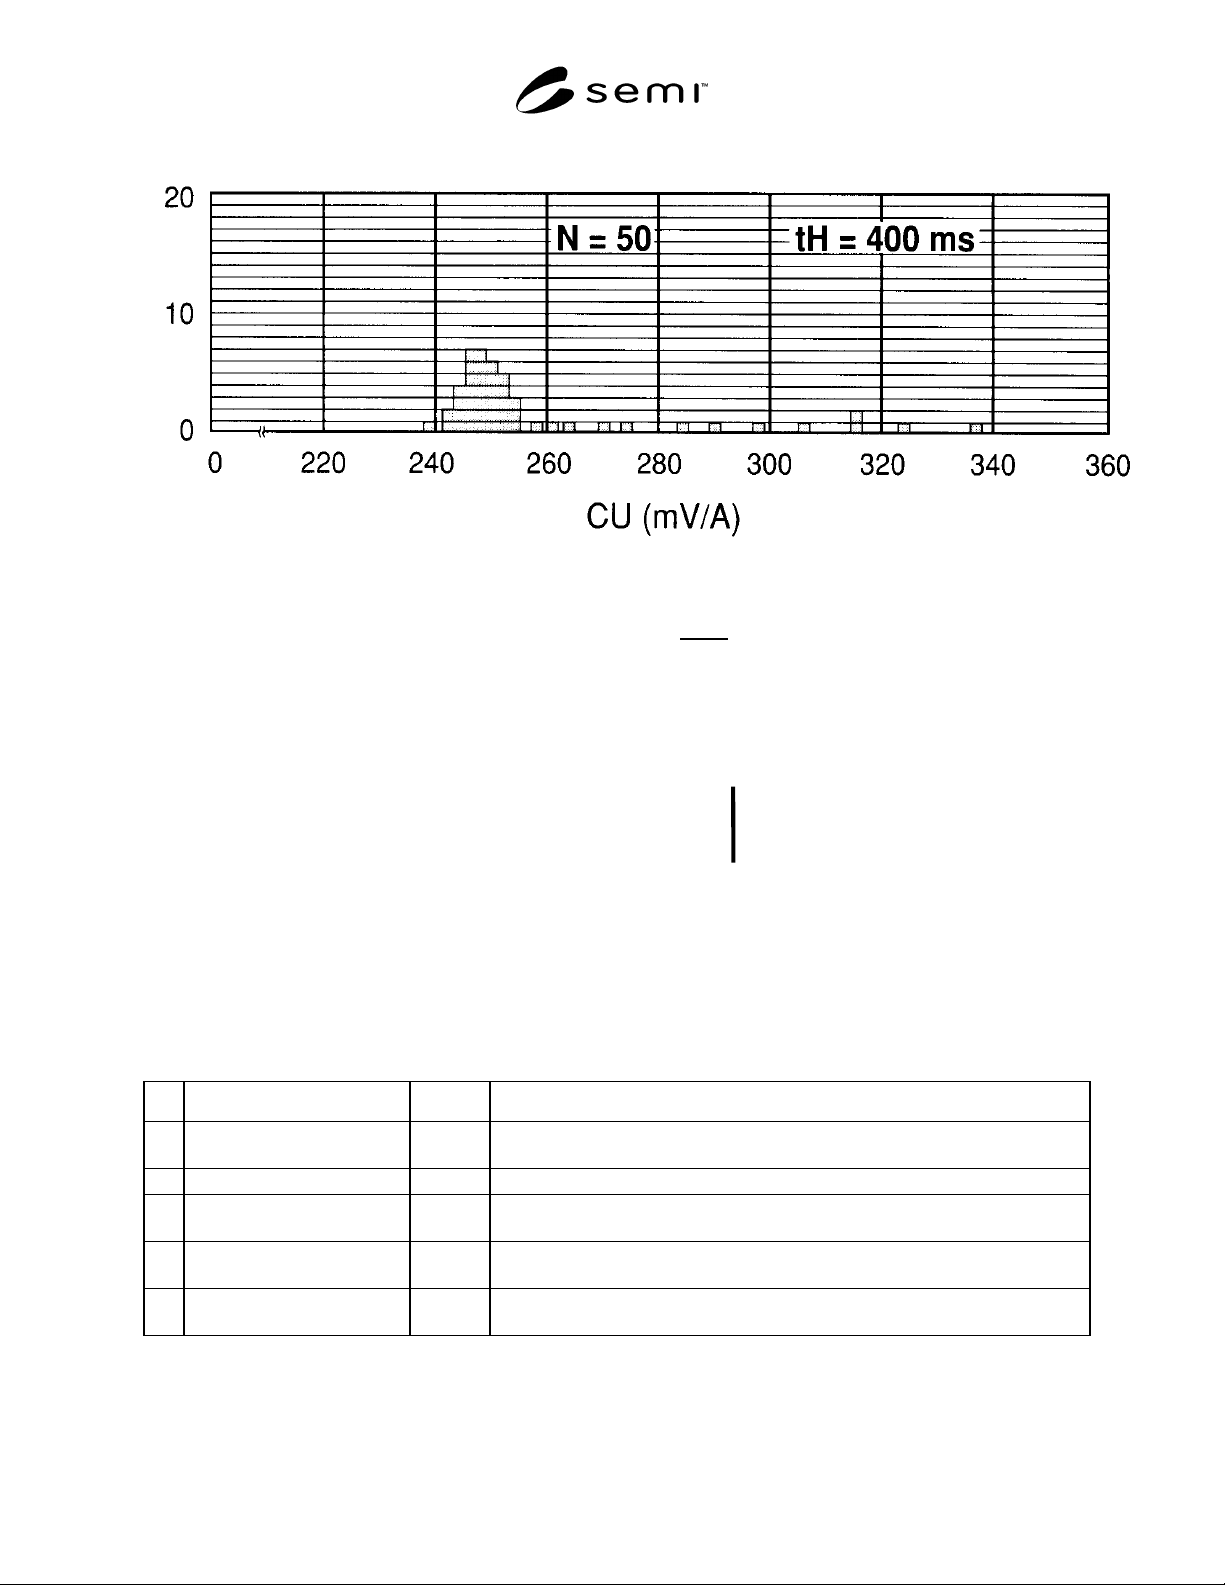
Figure 8
CU bar graph shows thermal distribution of 50 devices when tested at a heating time of 400 ms. (Note: CU data
rounded off to nearest m V/A.)
General Description Steps Comments
A Initial Setup 1 thru 4 Approximate instrument settings to find variations among devices in 10 to 15
piece sample.
B Heating Curve Generation 5 thru 7 Using highest and lowest reading devices, generate Heating Curves.
C Heating Curve Interpretation 8 thru 10 Heating Curve is used to find more appropriate value for t
H
corresponding to heat
in the die attachment are (or some other desired interface in the heat flow path).
D Final Setup 11 Heating Power applied during t
H
is increased in order to improve measurement
sensitivity to variations among devices.
E Pass/F Determination 12 thru 13 A variety of methods is available for setting the fail limit; the statistical approach
is the fastest and easiest to implement.
Figure 9 — Summary table of steps required to implement thermal transient testing for IC die attachment
evaluation.