semi合集-English.pdf - 第7408页
SEMI MF1527-1104 © SEMI 2003, 2004 14 NOTE: Central line, contro l limits, and zones are based on the data in the run charts of Figure R1-1. Figure R1-2 Example of Instrume nt X and s Control Charts for a Resistivity Ref…
SEMI MF1527-1104 © SEMI 2003, 2004 13
A
3
= constant given in Table R1-1 for values of m
from 6 to 10.
R1-2.6 Determine the upper and lower control limits
for the s control chart from the following equations:
11
sBLCLandsBUCL
34
(R1-3)
where:
UCL = upper control limit,
LCL = lower control limit, and
B
3
and B
4
= constants given in Table R1-1 for values
of m from 6 to 10.
R1-2.7 Divide the region between the central line and
the upper control limit (UCL) into thirds. Divide the
region between the central line and the lower control
limit (LCL) in thirds. Label the zones from the UCL as
A, B, C, C, B, A (see Figure R1-2).
R1-2.8
Using these control limits, continue to collect
data on the reference wafers periodically in accordance
with the procedures of Section R1-2.1, recording the
information specified in Section R1-2.2.
Table R1-1 Patterns that Indicate Possible Out-of-
control Conditions in Control Charts Constructed
with No Prior Information
Pattern Indication
1 Single point outside of control limits
2 Two out of three successive points in Zone A
3 Four out of five successive points in Zones A or B
4 Eight successive points on one side of centerline
R1-2.9 Observe the
X
and s control charts for out-of-
control conditions as listed in Table R1-2. If out-of-
control conditions are noted, annotate the chart to
highlight the out-of-control condition and take
corrective action as follows:
R1-2.9.1
Verify that the out-of-control indication is
due to the instrument and not the reference wafer by
checking other similar reference wafers (see Section
7.1.1).
Table R1-2 Factors for Computing Control Limits of Instrument Control Charts
Factors for Charts Constructed with No Prior Information
Factor for CRM
X
Chart
m (Number of
Measurements)
A
3
B
3
B
4
A
6 1.287 0.030 1.970 1.225
7 1.182 0.118 1.882 1.134
8 1.099 0.185 1.815 1.061
9 1.032 0.239 1.761 1.000
10 0.975 0.284 1.716 0.9492
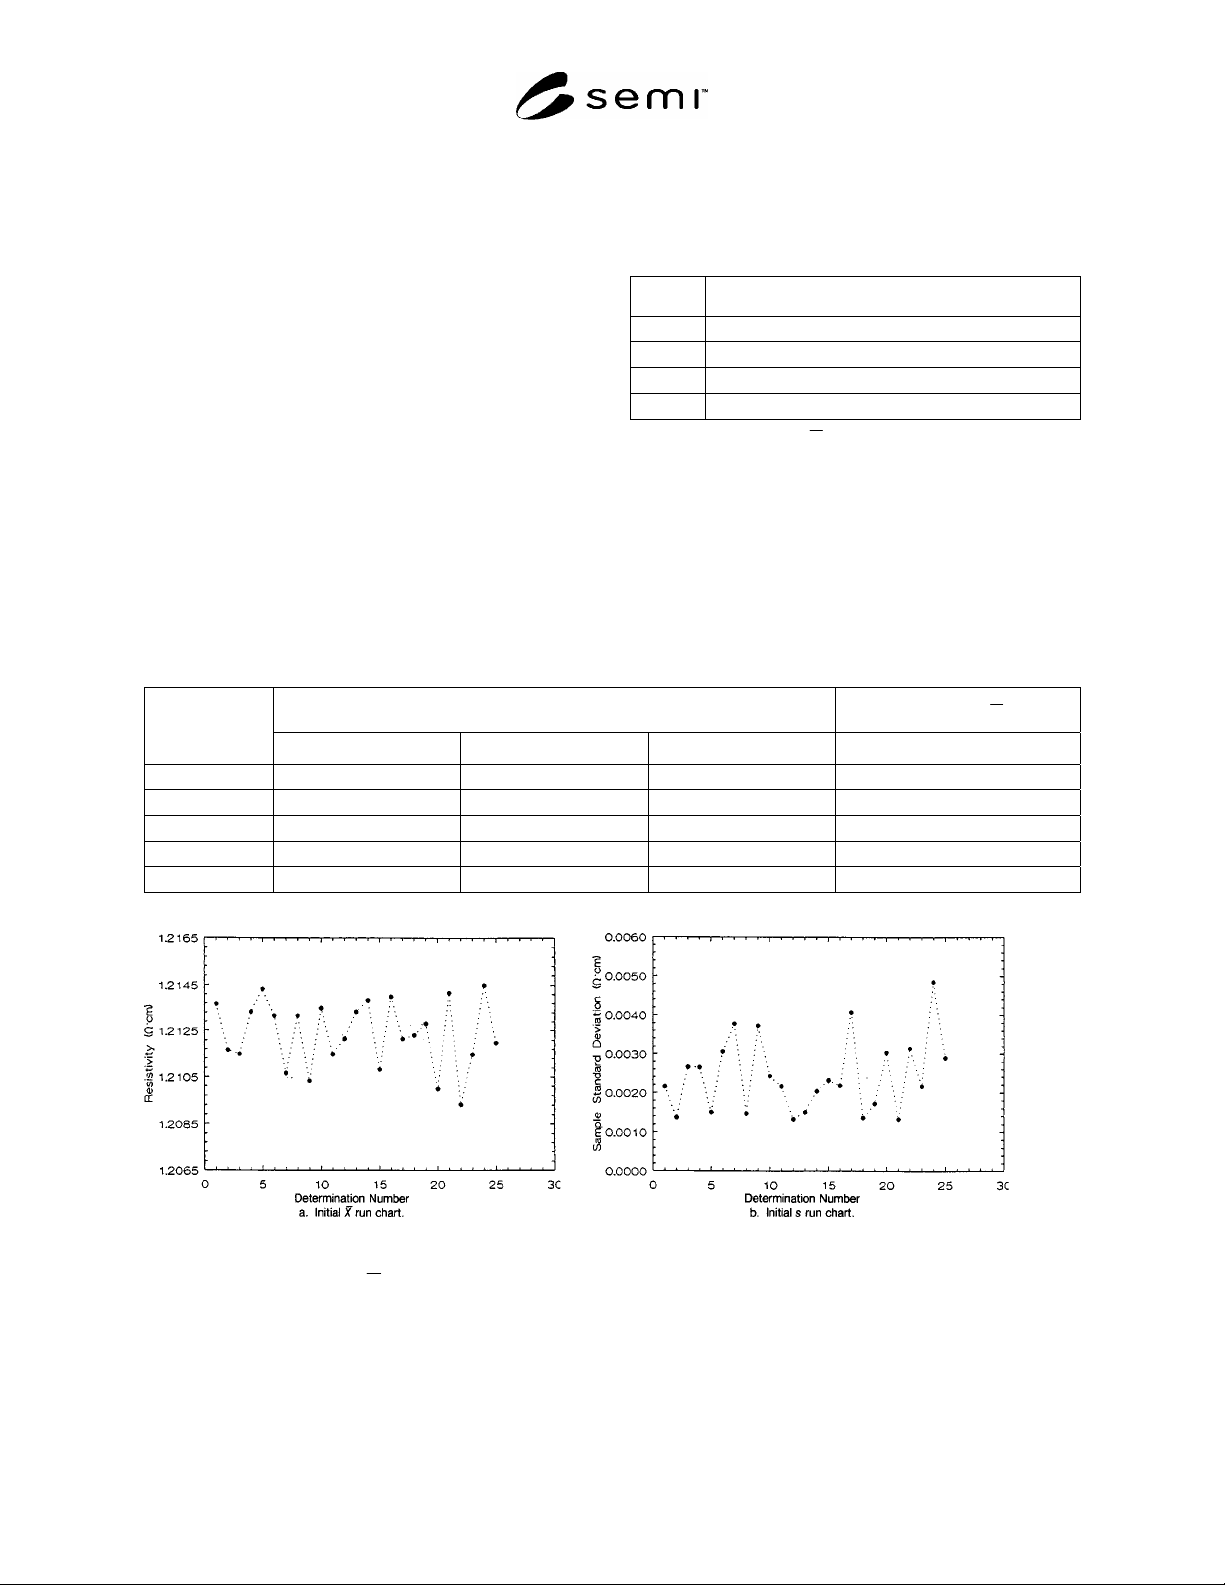
Figure R1-1
Example of Instrument
X
and s Run Charts for a Resistivity Reference Wafer with Nominal Resistivity of
1.2
·cm; 6 Measurements per Determination
SEMI MF1527-1104 © SEMI 2003, 2004 14
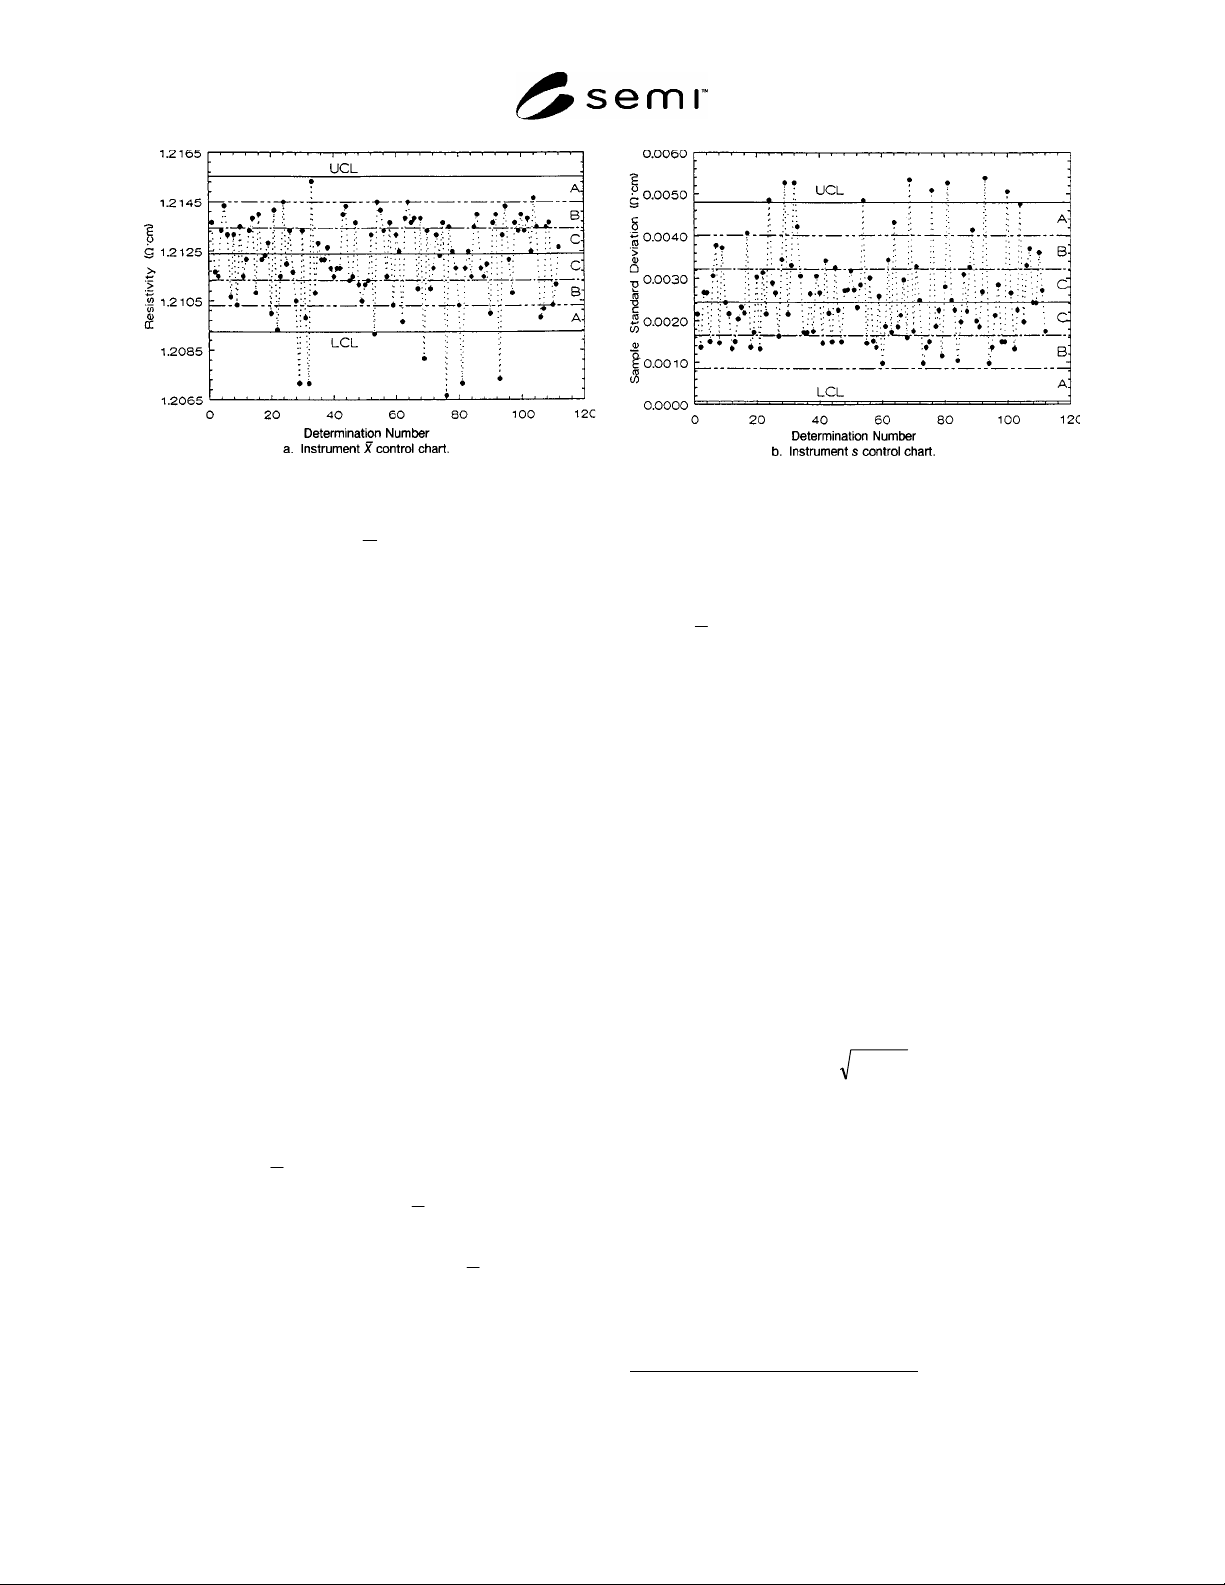
NOTE: Central line, control limits, and zones are based on the data in the run charts of Figure R1-1.
Figure R1-2
Example of Instrument
X
and s Control Charts for a Resistivity Reference Wafer with Nominal Resistivity
of 1.2
·cm; 6 Measurements per Determination
R1-2.9.2 If the reference wafer appears to be at fault,
resurface it and begin the process using it as a fresh
control wafer.
R1-2.9.3 If instrument is at fault, check the probe
assembly and electrical equipment in accordance with
7.1.3, and repair or replace as needed.
R1-2.10
Record the cause of the out-of-control
condition on the control chart.
R1-2.11 After completing any necessary
modifications, note the action taken on the chart and
repeat Sections R1-2.1 through R1-2.7 to determine if
the modification has changed the instrument control
limits.
R1-2.12
Using new control limits, if appropriate,
continue data collection and observation in accordance
with Sections R1-2.8 through R1-2.10.
R1-3 CRM Control Charts
R1-3.1 Data for these control charts are collected
similarly to the data for the instrument control charts
(see Section R1-2). However, because they are based
on known information, the central lines and control
limits for both
X
and s are constructed differently.
R1-3.2 Begin by constructing
X
and s run charts in
accordance with Sections R1-2.1 through R1-2.3.
R1-3.3
Take the central line for the
X
control chart
as
0
, the certified resistivity value for the CRM at
23°C.
R1-3.4 Determine the upper and lower control limits
for the
X
control chart from the following equations:
12
0000
and
ALCLAUCL
(R1-4)
where:
UCL = upper control limit,
LCL = lower control limit,
0
=
the resistivity of the CRM, in ·cm, as show
n
on the certificate,
0
= the standard deviation of resistivity of the
CRM, in ·cm, as listed in Table R1-3, and
A = a constant given in Table R1-1 for values of m
from 6 to 10.
NOTE 2: If the stated uncertainty of the resistivity CRM is
based on the variabilities associated with the certifying
laboratory only,
0
should be determined as follows:
22
0 c
us
where:
s = grand average sample standard deviation found i
n
construction of the CRM s control chart, in ·cm,
and
u
c
= stated uncertainty of the resistivity of the CRM, i
n
·cm. (Note that u
c
is 1/k of the uncertainty, U,
stated on the certificate for NIST resistivity SRMs,
where k = 2, unless otherwise stated.)
12 Manual on Presentation of Data and Control Chart Analysis:
MNL 7, 6th Edition, (ASTM, West Conshohocken, PA, (1991) §3-19,
Tables 13 and Tables 16.
SEMI MF1527-1104 © SEMI 2003, 2004 15
R1-3.5 Calculate the grand average, s, of the s values
in accordance with Section R1-2.4. Take s as the
central line for the s control chart.
R1-3.6 Determine the upper and lower control limits
for the s control chart in accordance with Section R1-
2.6.
R1-3.7 Using these control limits, continue to collect
X
and s data on the reference wafers periodically in
accordance with the procedures of Section R1-2.1,
recording the information specified in Section R1-2.2.
R1-3.8 Observe the
X
and s control charts for out-of-
control conditions as listed in Table R1-4. If out-of-
control conditions are noted, annotate the chart to
highlight the out-of-control condition and take
corrective action as follows:
R1-3.8.1
Verify that the out-of-control indication is
due to the instrument and not the reference wafer by
checking other similar reference wafers (see Section
7.1.1),
R1-3.8.2 If the reference wafer appears to be at fault,
resurface it and begin the process using it as a fresh
control wafer,
R1-3.8.3 If instrument is at fault, check the probe
assembly and electrical equipment in accordance with
Section 7.1.3, and repair or replace as needed, and
R1-3.9 After completing any necessary modifications,
annotate the chart to record both the cause of the out-of-
control condition and the action taken, and continue to
collect and record data using the same control limits as
before.
R1-4 Control Charts for Instruments for
Routine Resistivity Measurements
R1-4.1 For control of resistivity measuring equipment
used in routine applications, a control chart for
individuals with moving range is appropriate. Select
reference wafers in accordance with the instructions in
the applicable test method (see Table 2) covering the
resistivity range of the specimens to be measured.
Begin construction of the control chart by making 25 to
30 center-point resistivity determinations on the
selected reference wafer in accordance with the
procedures in the method governing the type of
instrument being controlled.
R1-4.2
Record the date, time, sample identification,
operator, and value obtained. For all measurements
after the first, calculate and record the magnitude of the
difference between the current value and the previous
value.
R1-4.3 Construct an X (individuals) chart by plotting
the measured resistivity values in the order in which the
data were obtained. Construct a moving R (range) chart
by plotting the differences in the order in which they
were obtained.
R1-4.4
Calculate the averages of the initial 25 to 30
readings,
X
and ,R of the values and the differences,
respectively as follows:
1
11
1
1
and
1
n
i
i
n
i
i
R
n
RX
n
X
(R1-5)
where:
X
i
= the i
th
individual resistivity value,
R
i
=
the difference, X
i+1
X
i
, and
n = number of measurements (25 to 30).
Take these averages as the central lines of the
individuals and moving range charts, respectively.
R1-4.5 Determine the upper and lower control limits
for the individuals chart as follows:
13
RXLCLandRXUCL 66.266.2 (R1-6)
where:
UCL
=
upper control limit,
LCL
=
lower control limit, and
X
=
average resistivity, ·cm, (see Section R1-4.4)
and
R
=
average of the ranges, ·cm (see Section R1-4.4)
13 Manual on Presentation of Data and Control Chart Analysis:
MNL 7, 6th Edition, (ASTM, West Conshohocken, PA, (1991) §3-30,
Table 24.
Table R1-3 Estimates of Standard Deviation for
Four-point Probe Measurements of Resistivity
Resistivity,
0
,
·cm
Estimate of Standard Deviation,
0
,
·cm
0.0008 to 120
0.0067 ×
0
120 to 500
0.0167 ×
0
500 to 2000
<0.05 ×
0
Table R1-4 Patterns that Indicate Possible Out-of-
control Conditions for CRM
X
Control Chart
Pattern Indication
1 Single point outside of control limits
5 Five successive points without change of
direction
6 Six consecutive up and down pairs