semi合集-English.pdf - 第4031页
SEMI F50-0200 © SEMI 2000 9 Monitor-Years . The m inimum coverage for a site was 0.8 Monitor- Years (one m onitor for 10 months ). T he site wit h the ma ximum c over age ha d ei ght Mo nito r- Years of data. The average…

SEMI F50-0200 © SEMI 2000 8
RELATED INFORMATION 1
VOLTAGE SAG PERFORMANCE AT SEMICONDUCTOR FACTORY
SITES
NOTE: This related information is not an official part of
SEMI F50 and was derived from the work of the originating
task force. This related information was approved for
publication by full letter ballot procedures on December 15,
1999. Determination of the suitability of the material is solely
the responsibility of the user.
R1-1 Typical Electric Utility System
Performance
R1-1.1 Although most large semiconductor sites are
served from dedicated substations, data collected from
utility (medium-voltage) distribution circuits can be
useful in establishing a baseline for electric utility
system performance. As part of the EPRI*
2
Distribution Power Quality (DPQ) study, data was
collected for a two-year period from approximately 300
different BMI PQNode monitors. These monitors were
located on 100 different feeders at 24 geographically
dispersed utilities. The power quality database created
in conjunction with this study is probably the most
extensive in existence. The data derived from this
study provides a statistically based assessment of the
level of power quality on electric utility distribution
circuits (voltage range from 4.16kV to 34.5kV).
R1-1.2 Almost every category of power quality data
was collected in the DPQ study, however, only voltage
sag and interruption data is assumed to be pertinent to
this activity. In the DPQ study, a voltage sag event was
initiated when the rms voltage dropped below 95% of
nominal for one cycle (data analysis was performed
only for events with magnitudes less than or equal to
90%). An interruption event was initiated when the
voltage dropped below 10% of nominal for 120
seconds. Although waveforms were captured for most
sag and interruption events, almost all of the data
analysis was performed on the basis of minimum
voltage magnitude (as a percentage on nominal) and
maximum duration during the event.
R1-1.3 DPQ Key Results
• The average interruption rate per site, per month
was approximately 0.5.
• The average sag rate per site, per month was
approximately 4 (10% < V < = 90%).
• The ratio of voltage sags to interruptions was
approximately 10:1.
2 Electric Power Research Institute, Inc., 3412 Hillview Ave., Palo
Alto, CA 94304-1395, USA
• Almost all voltage sag events have only a single
component.
• Most voltage sags had duration of less than 10
cycles.
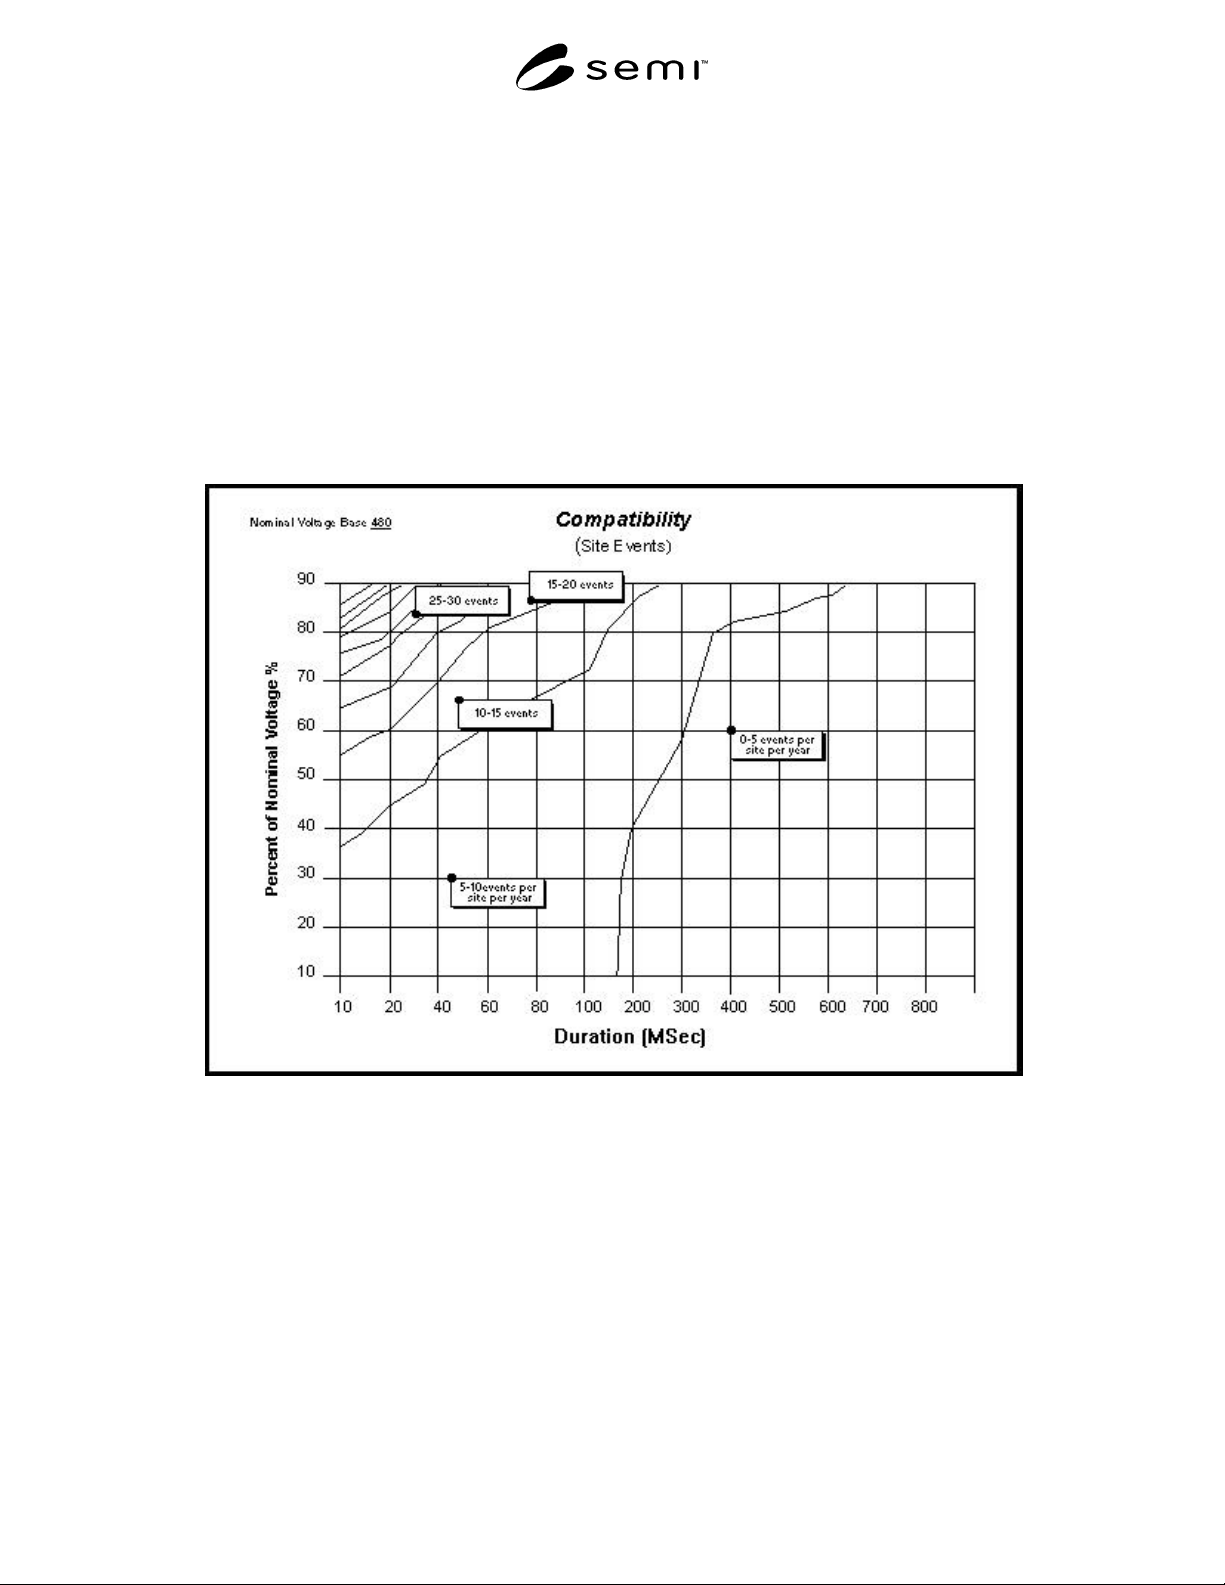
R1-1.4 The Figure R1-1 represents a summary of the
voltage sag and interruption data in a contour format.
The contour lines on the graph represent the expected
number of disturbance events that are more severe
(longer or deeper) than the duration and magnitude
grid.
R1-2 Semiconductor Factory Site Disturbance
Data
R1-2.1 The DPQ study provides a baseline of the
power quality that exists on typical utility distribution
systems. However, only one of the semiconductor
manufacturing sites from which data was collected is
served from a typical utility distribution system.
Fourteen of the fifteen semiconductor sites surveyed
were served from dedicated substations owned by either
the customer or the utility. A comparison between
DPQ and semiconductor site data (for large facilities)
indicates that application of DPQ data would yield a
more restrictive tool tolerance standard. It is
recommended, therefore, that data from semiconductor
sites be utilized to develop an initial curve and that the
curve be validated against DPQ data.
R1-2.2 Voltage sag and interruption data was
accumulated for 14 different semiconductor
manufacturing sites geographically dispersed
throughout the United States. One additional site was
located outside of the United States. Data represented
in this report was provided by semiconductor
manufacturing companies.
R1-2.3 All of the data collected was in the form of
magnitude and duration point values. Although the
validity of characterizing the electrical system
performance is this manner has been questioned, it
remains the most common data format for disturbance
data.
R1-2.4 The coverage of the disturbance data is
typically represented as the product of number of years
(or months) monitored and the number of monitors
present. In this report, the unit for data coverage is
Monitor-Years. One Monitor-Year of data is the
quantity of data derived by one monitor for a one-year
period. The data for semiconductor sites covers 30.5
SEMI F50-0200 © SEMI 20009
Monitor-Years. The minimum coverage for a site was
0.8 Monitor-Years (one monitor for 10 months). The
site with the maximum coverage had eight Monitor-
Years of data. The average for all sites was
approximately 1.9 Monitor-Years.
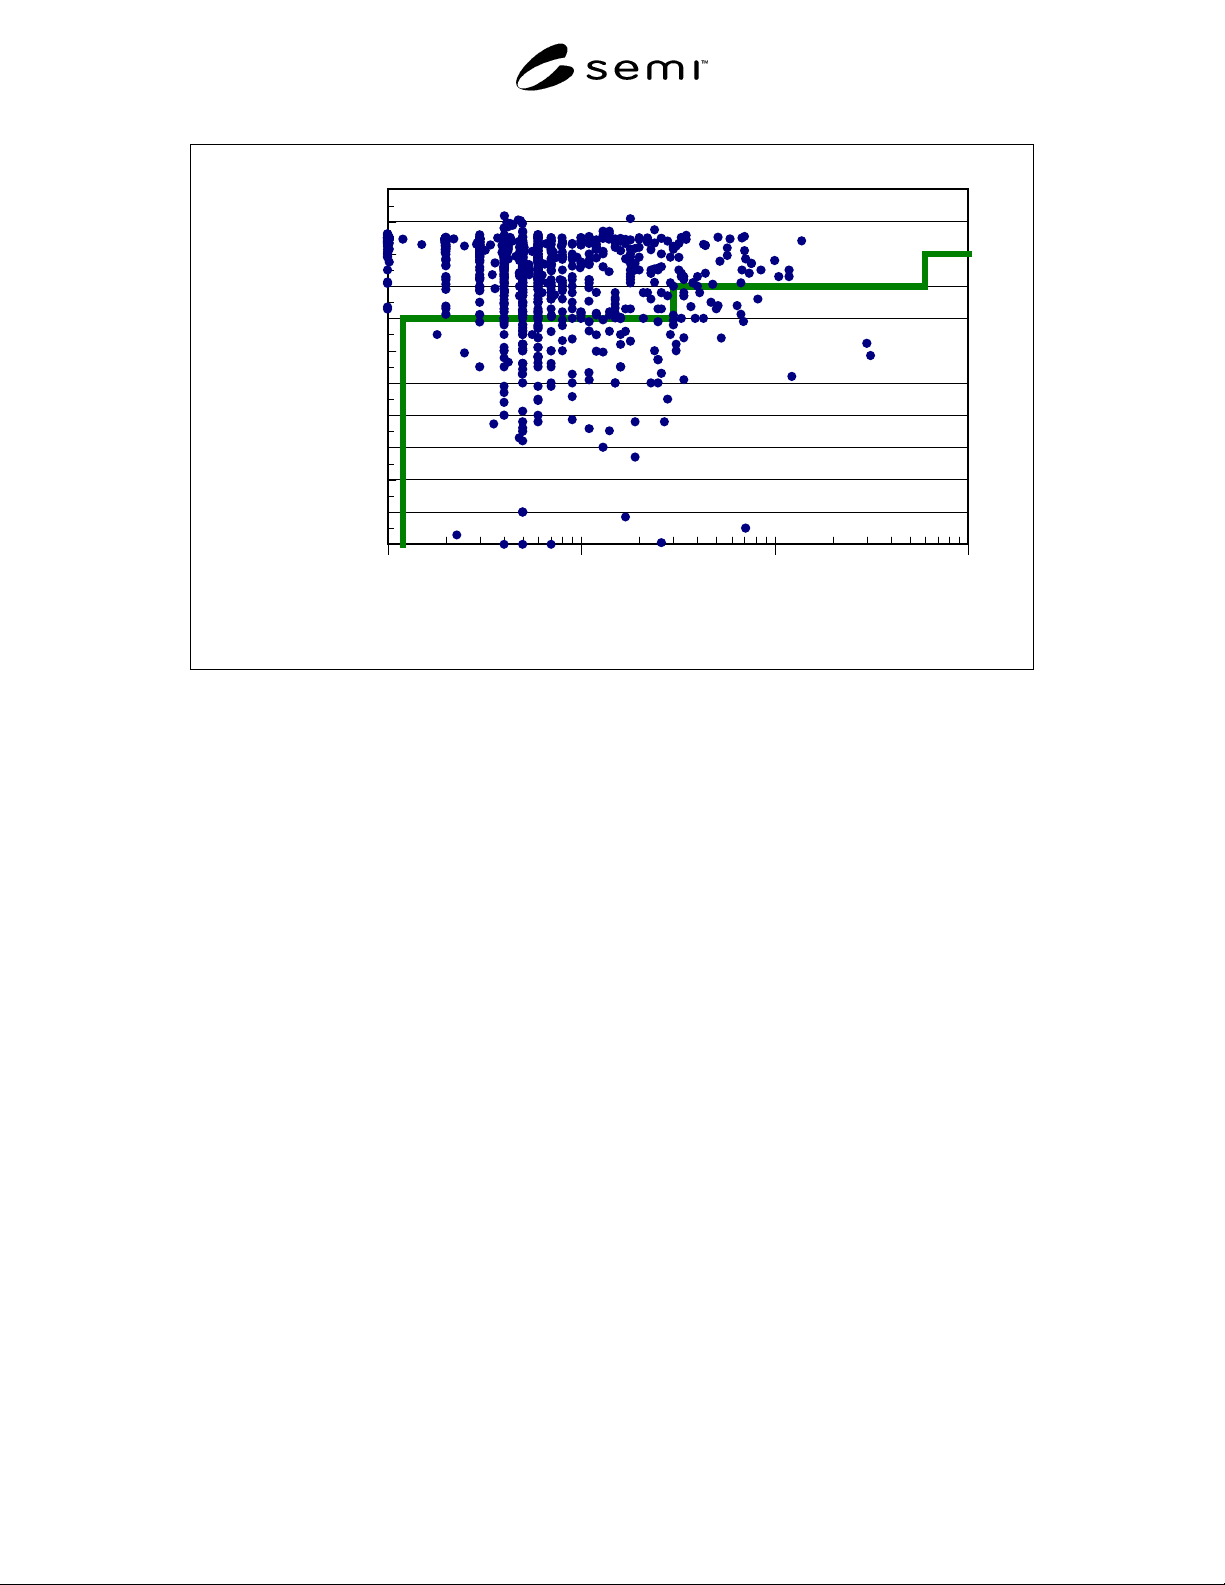
R1-2.5 Shown below is a scatter graph of all of the
1076 disturbances that were reported. The graph
represents the magnitudes and duration for all voltage
sags and interruptions at all sites. The magnitude value
is the minimum voltage level during the sag represented
as a percent of the nominal voltage. Also shown on the
graph is the pertinent portion of the Information
Technology Industry Council (ITIC) “CBEMA-curve,”
contained in IEEE Standards 446 and 1100.
R1-2.6 The total number of events on or below the
CBEMA curve was 166. Thirteen of the fifteen
semiconductor sites averaged at least one event below
the CBEMA each year. The average number of events
below CBEMA, per site, each year was approximately
5.4. If the semiconductor manufacturers employed the
new CBEMA curve for a tolerance standard, most
would have experienced a significant number of
equipment interruptions.
Figure R1-1
Typical Electric Utility System Performance
SEMI F50-0200 © SEMI 2000 10
0%
10%
20%
30%
40%
50%
60%
70%
80%
90%
100%
110%
1 10 100 1000
Duration (cycles)
Percent of Nominal Voltage
Figure R1-2
Semiconductor Factory Site Disturbance Data