semi合集-English.pdf - 第779页
SEMI E104-0303 © SEMI 2000, 2003 15 A2-4 Counting Efficienc y A2-4.1 The counting efficien cy for a specific particle size is defined as the ratio of the detected concent ration of particles to the concen tration actuall…
SEMI E104-0303 © SEMI 2000, 2003 14
APPENDIX 2
CALIBRATION NOTES
NOTICE: The material in this appendix is an official part of SEMI E104 and was approved by full letter ballot
procedures on July 28, 2000 by the European Regional Standards Committee.
A2-1 Size Calibration
A2-1.1 Size calibration is performed with
monodisperse particles with known sizes and known
optical properties. The procedure establishes the
voltage response of the LPPD for these particles. The
reported size for unknown particles is the same size of
the monodisperse particle whose voltage response is the
voltage pulse produced by the unknown particle (called
Optical Equivalent Size).
A2-1.2 If an LPPD is able to detect all of the
distribution (see counting efficiency) generated by a
monodisperse aerosol and the size of the particle
standard is known, the calibrating of an LPPD without a
reference particle counter is possible. Ideally, the data
collected by the LPPD observing a monodisperse
aerosol would describe a Gaussian particle size
distribution. However, the reported voltage pulse height
distribution is often not symmetric. Therefore, the mode
and modal values of the pulse height distribution are
not equal. The thresholds for different particle sizes are
set as the mode or median value of the observed
distribution. The modal voltage method is commonly
used.
A2-1.3 The intensity of the scattered light detected by
a photodetector depends on intensity, polarization state,
and wavelength of the incident light beam, diameter,
shape, and refractive index of the particle, as well as on
the geometrical layout of the collection optics and
detector. In the particle size range near the wavelength
(0.1λ < d
P
< 10λ), large oscillations can be seen in the
intensity curve of the light scattered by spherical
particles as a function of all these parameters.
Therefore, the response curve might not be monotonic.
Particles of more than one size will produce the same
voltage output signal. The calibration particles should
be chosen so that their response is not included in such
reversals of the calibration curves.
A2-1.4 For calibration checks, a reference particle
counter (RPC) with a good sizing capability could be
used. The counting efficiency of the RPC shall be 100%
for the particle sizes used in test. The counts of the RPC
and the LPPD under test in the corresponding channel
should be normalized to a standard detection area
(mm
2
).
A2-2 Particle Size Resolution
A2-2.1 Particle size resolution of a particle detector
describes its capability to differentiate between particles
of nearly the same size, or it is a measure of the range
of sizes which the counter would assign to a particular
particle if its size was determined repeatedly. The
resolution is specified by the coefficient of variation (in
%) obtained by dividing the portion of the standard
deviation of the distribution σ
LPPD
that is contributed by
the LPPD by the mean particle size.
A2-2.2 The employed particle size should be at least 2
times larger than the lower detection limit of the
instrument and is within a monotonic response range of
the LPPD response curve. The size d
p
and the standard
deviation σ
d,p
of the used particles is necessary to
calculate the resolution.
A2-2.3 To determine the resolution, the standard
deviation of the observed particle distribution σ
p,LPPD
is
calculated. The quality of the photodetector is checked
by determining the standard deviation of the pure
sensor signal σ
V,LPPD
at the analog calibration output
with a pulse height analyzer. The σ
LPPD
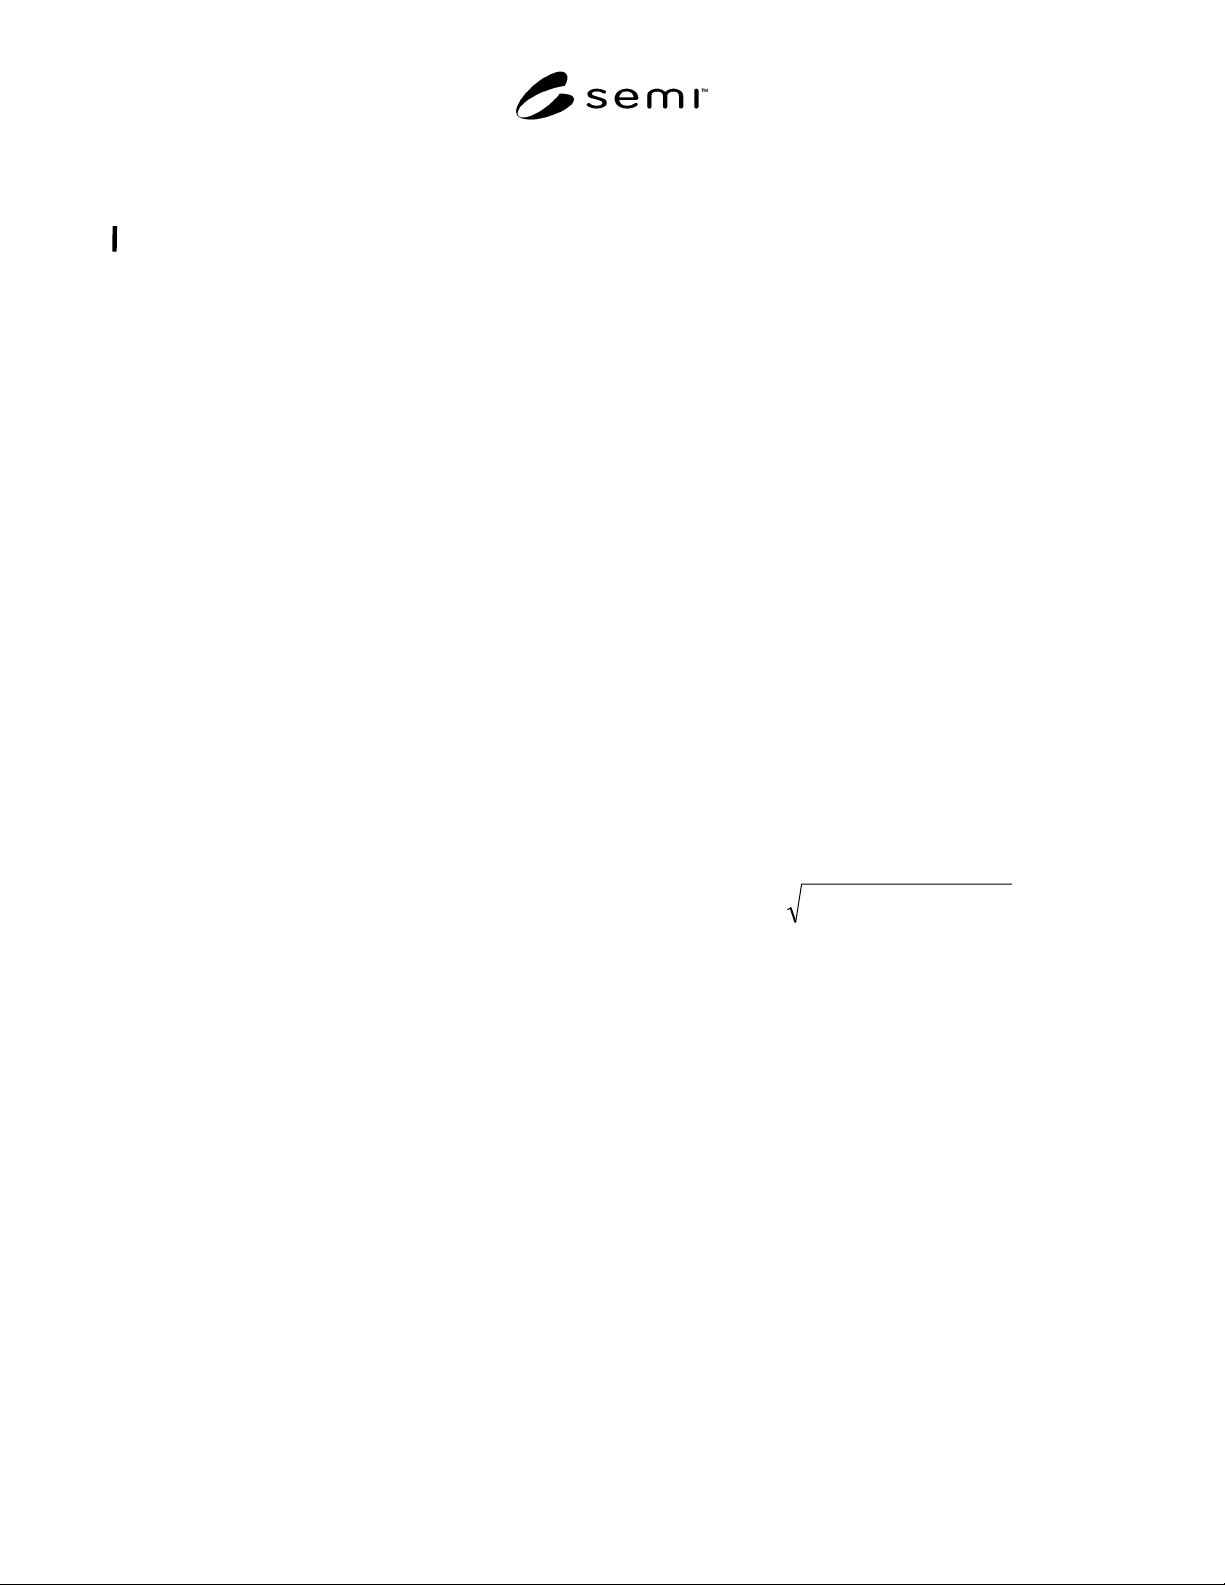
is calculated by
the following formula:
(
)()
2
,
2
, pdLPPDpLPPD
σσσ
−=
A2-3 Zero Counting
A2-3.1 The intent of this procedure is not to adjust the
thresholds for the zero count rate but to verify whether
the LPPD is within its specification. It is assumed that
the zero count level of a correct operating LPPD is
sufficiently better than its specification. Failure of the
verification test is due to a physical failure within the
LPPD and not to statistical variation in the
measurement.
A2-3.2 The output of a photodetector and the
electronic circuits of the particle detector is afflicted
with noise. The zero count rate verification is carried
out to ensure that data, especially near the detection
limit of the LPPD, is generated by particles rather than
by noise. To achieve this goal, the basic thresholds for
the LDL are to be set so that a signal-to-noise ratio of at
least 3 dB is ensured. The sampling time shall be long
enough to provide adequate sampling statistics.

SEMI E104-0303 © SEMI 2000, 2003 15
A2-4 Counting Efficiency
A2-4.1 The counting efficiency for a specific particle
size is defined as the ratio of the detected concentration
of particles to the concentration actually present. The
determination of the counting efficiency of an LPPD
requires particles of known size and concentration in
the aerosol. The counting efficiency is affected by
several factors.
• First, the counting efficiency is dependent on a
specific particle size.
• The effect of particle concentration is addressed
under zero counting and coincidence.
• Due to inhomogeneous light intensity within the
detection area of the particle counter, not all small
particles near the lower detection limit of the
instrument are detected.
• If the sampling flow is not completely contained
within the defined detection area, then some
portions of the aerosol will not be counted.
A2-4.2 Ideally, the counting efficiency of a particle
counter covering 100% of the line cross-section area as
detection area would consist of a step function at the
point of the LDL. Real particle detectors have a gradual
transition (efficiency curve) instead of a step function.
The point with 50% detection probability of all particles
of a given size moving through the detection area is
often used as a reference point. The corresponding
particle size is called the minimum detectable particle
size (see sensitivity). If the slope of the efficiency curve
for two detectors with the same specified 50%
efficiency point is different, the two detectors may
show different particle counts for the same polydisperse
aerosol. To define an efficiency curve, more than one
particle size, e.g. 5 particle sizes around the LDL
covering 0% to 100% efficiency, should be used.
Acceptable counting efficiency for single particle
counting instruments is 50% ± 20% at the minimum
detection size and 100% ± 10% for all particles larger
than 1.5 times the minimum size.
A2-4.3 The detection area of most LPPDs comprises
only a small portions of the cross-section area of the
line. Therefore, it is not possible to specify a 50%
efficiency point. For this, the commonly used definition
for sensitivity could not be used for such instruments.
A2-4.4 The actual particle concentration is determined
with a reference particle counter with a 100% counting
efficiency for the employed particle size. It is important
that there are no differences between the concentration
within the detection area of the LPPD and the
concentration monitored by the RPC.
A2-5 Sensitivity
A2-5.1 The particle size corresponding to the point
with 50% counting efficiency of the particles of a given
size is defined as the minimum detectable particle size.
This is valid only for particle counters capable to reach
100% counting efficiency for a specific particle size.
This does not apply to most LPPDs.
A2-6 Particle Concentration Effects
A2-6.1 All optical particle detectors are able to operate
accurately only within a limited range of particle
concentration. It is not the scope of this document to
define how this limit is measured or how to verify the
specification.
A2-6.2 High Concentration Effects
A2-6.2.1 The upper limitation of the particle
concentration is chiefly based on coincidence effects.
A2-6.2.2 One effect is optical coincidence. If the
particle concentration is too high, more than one
particle is present within the detection area of the
instrument. The reported particle concentration will be
less than the true value, and the reported particle size
distribution will be shifted towards the indication of
larger particles than in reality.
A2-6.2.3 The other effect is electronic coincidence. It
is defined as the inability of the electronic pulse
processing system to detect and size individual pulses
that are too closely spaced. If there are so many pulses
that they cannot completely return to the baseline, they
become superimposed. Electronic saturation occurs.
Electronic coincidence introduces errors in both particle
size and counts as well. Normally, this problem is not
critical for modern electronic systems. Optical
coincidence can become a problem at particle levels
well below the point where electronic saturation occurs.
A2-6.2.4 Another error can occur when high
concentrations of particles just smaller than the lower
detection limit of the instrument are present. Even
though no single one of these particles will be detected,
scattering-light levels from these particles can increase
the background optical noise level. So, errors might be
produced in particle count data in the lower particle size
ranges reported by the counter.
A2-6.3 Low Concentration Effects
A2-6.3.1 It is obvious that it is necessary to collect
sufficient data to determine number and size of particles
within an acceptable confidence limit.

SEMI E104-0303 © SEMI 2000, 2003 16
APPENDIX 3
AEROSOL GENERATION AND AEROSOL DILUTION
NOTICE: The material in this appendix is an official part of SEMI E104 and was approved by full letter ballot
procedures on July 28, 2000 by the European Regional Standards Committee.
A3-1 Monodisperse Particle Suspension
A3-1.1 Monodisperse suspensions of particles (PSL)
are available in sizes from 0.02 µm. These particles are
grown by emulsion polymerization and are stabilized in
aqueous suspensions with an anionic surfactant. They
carry a negative charge which contributes to their
stability. The suspension normally contains 10% solids
and 2% dissolved, highly viscous stabilizer. The solid
contains up to 8% emulsifier and inorganics.
A3-1.2 After evaporation, these solids and the
stabilizer will both increase the diameter of the single
particle and generate a residual nucleus out of an empty
droplet. These residual particles are called secondary
aerosol. The diameter of residual nucleus could be up to
0.25 µm according to the PSL size and dilution of the
suspension. Most of these secondary aerosol particles
might be too small to be detectable with commonly
used particle detectors, but they will have an influence
on the noise level because of there high number.
A3-1.3 Out of a high-concentration suspension it is not
possible to aerosolize only individual particles.
Droplets containing more than one of the suspended
particles will become undesirable agglomerates upon
evaporation.
A3-1.4 For this, an adequate dilution of the suspension
is necessary to avoid the formation of aggregates and
the enlargement of the particles.
A3-2 Generation and Dilution of PSL
Suspension
A3-2.1 A diluted PSL suspension for particle
generation in an aerosol generator can be created by the
following procedure:
• Shaking and/or ultrasonic treatment of the PSL
bottle distributed by the PSL manufacturer.
• Placing one drop of PSL in one liter of deionized
or destilled water or Isopropanol. The water could
be cleaned using a filter with a pore size no more
than 10% of the size of the particles being used.
• Shaking and/or ultrasonic treatment of the
suspension to disperse the particles.
A3-2.2 The suspension will probably need to be diluted
further to provide a required particle concentration.
This is necessary to avoid the formation of
agglomerates and to restrict the size of the secondary
aerosol particles. An equation to calculate the required
particle concentration is given in “The Generation of
Aerosols of Fine Particles” by O. Raabe (see Section
11).
A3-2.3 The particle suspensions distributed by the PSL
manufacturer shows no detectable variation in particle
characteristics when they are stored in a cool place over
the years. Diluted suspensions for atomization feature
an aging process. Diluted suspensions of polymer
spheres smaller than 1 µm should not be stored for
more than one week.
NOTE A3-1: Care should be taken to avoid contamination of
the polymer spheres and the suspension.
A3-3 Aerosol Generation
A3-3.1 The diluted suspension is nebulized in the
aerosol generator. Great account is taken of
concentration and size distribution of the generated
droplets and of the volume flow rate V´
G
. To achieve a
constant aerosol production, the volume flow rate and
the droplet size distribution should be constant and
independent of the supplies of suspension in the
reservoir. The variation in particle concentration should
be no more than 10% as measured by the reference
particle counter over a time period of 15 minutes or
more.
NOTE A3-2: Care should be taken to avoid contamination of
the aerosol generator.
A3-4 Aerosol Drying
A3-4.1 The water of the generated droplets will
completely evaporate when the relative humidity of the
aerosol flow behind the nebulizer is lower than 70%.
The volume flow of the suspension in the nozzle
increases the humidity of the filtered compressed air
which has a relative humidity of 10%–15% in spite of
predrying. The use of a diffusion dryer or another
appropriate instrument allows a higher relative
humidity of the aerosol flow behind the aerosol
generator. The diffusion dryer uses silica gel desiccant
to remove the moisture. The desiccant shall either be
new or freshly regenerated. It is not wise to get the
aerosol in direct contact with the desiccant. Polymer
spheres will be precipitated and additional particles out
of the desiccant will change the particle size
distribution of the aerosol.