semi合集-English.pdf - 第6985页
SEMI S10-1103 © SEMI 1996, 2003 15 RELATED INFORMATION 4 EXAMPLE OF NUMERICAL RISK RATING METHODS NOTICE : This rel ated information is n o t an of ficial part of SEMI S10 a nd is not intended t o modify or supersede the…

SEMI S10-1103 © SEMI 1996, 2003 14
RELATED INFORMATION 3
EXAMPLE OF RISK RANKING METHOD
NOTICE: This related information is not an official part of SEMI S10 and is not intended to modify or supersede
the official guideline. It has been derived from practical application by the task force members. Publication is
authorized by the vote of the responsible committee April 2, 2003.
R3-1 Example of Risk Ranking Method
R3-1.1 One method for risk analysis is the risk ranking
number (RRN) system. Numerical values are assigned
to descriptive phrases. A RRN is calculated, thus
indicating the risk.
R3-1.2 The RRN is a function of severity (S) and
probability of occurrence (PO).
R3-1.3 To get the RRN, use function (1) or
(2),
depending on which data and experiences are available.
RRN = S × PO (1)
S × FE × POH × PA (2)
Where: PO = FE × POH × PA
R3-1.4 Severity (S) — when assessing the severity of
harm, the following factors should be taken into
account:
• degree of possible harm/injury
• number of people at risk
• amount of property loss
• harm to environment
R3-1.5 Probability of Occurrence of Harm (PO) —
The probability of occurrence taken into account the
factors described in Sections R3-1.6-R3-1.8.
R3-1.6 Frequency and Duration of Exposure (FE) —
need for access to the danger zone, e.g., operator,
maintenance, service personnel
• number of persons exposed to hazard
• time spent of exposure to the danger zone, e.g.,
seconds, minutes
• frequency of access, e.g., annually, monthly, daily
R3-1.7 Probability of Occurrence of Hazardous
Situations (POH) —
• accident history
• history of damage to heath, property and/or
environment
• risk comparisons to other industries with
similarities, e.g., chemical industry, petroleum
industry
• statistical data
R3-1.8 Possibility to Avoid the Harm (PA)
R3-1.8.1 This is a number between 1 (not possible) to
0 (avoiding always possible)
• nature of persons, e.g., skilled or unskilled persons,
unmanned operation
• the speed of appearance of the hazards, e.g., slow,
fast
• awareness of critical situations, e.g., warning signs,
direct observation, information
• possibility to avoid the hazardous situations, e.g.,
reflex, possibility of escape
• knowledge and experience about the equipment
R3-1.9 Risk Ranking Number
R3-1.9.1 The risk-ranking number is a function of
severity (S) and probability of occurrence (PO).
R3-1.9.2 For these criteria, specific numbers need to be
defined. Based on the risk ranking appropriate actions
should be carried out according to the control strategy.
SEMI S10-1103 © SEMI 1996, 2003 15
RELATED INFORMATION 4
EXAMPLE OF NUMERICAL RISK RATING METHODS
NOTICE: This related information is not an official part of SEMI S10 and is not intended to modify or supersede
the official guideline. It has been derived from practical application by the task force members. Publication is
authorized by the vote of the responsible committee April 2, 2003.
R4-1 Example of Numerical Risk Rating Methods
R4-1.1 Background — For practical reasons numerical descriptions are preferred during many risk assessments.
The tables below are an example how the descriptive categories are changed to numerical. The data in the following
tables are not based on statistical data.
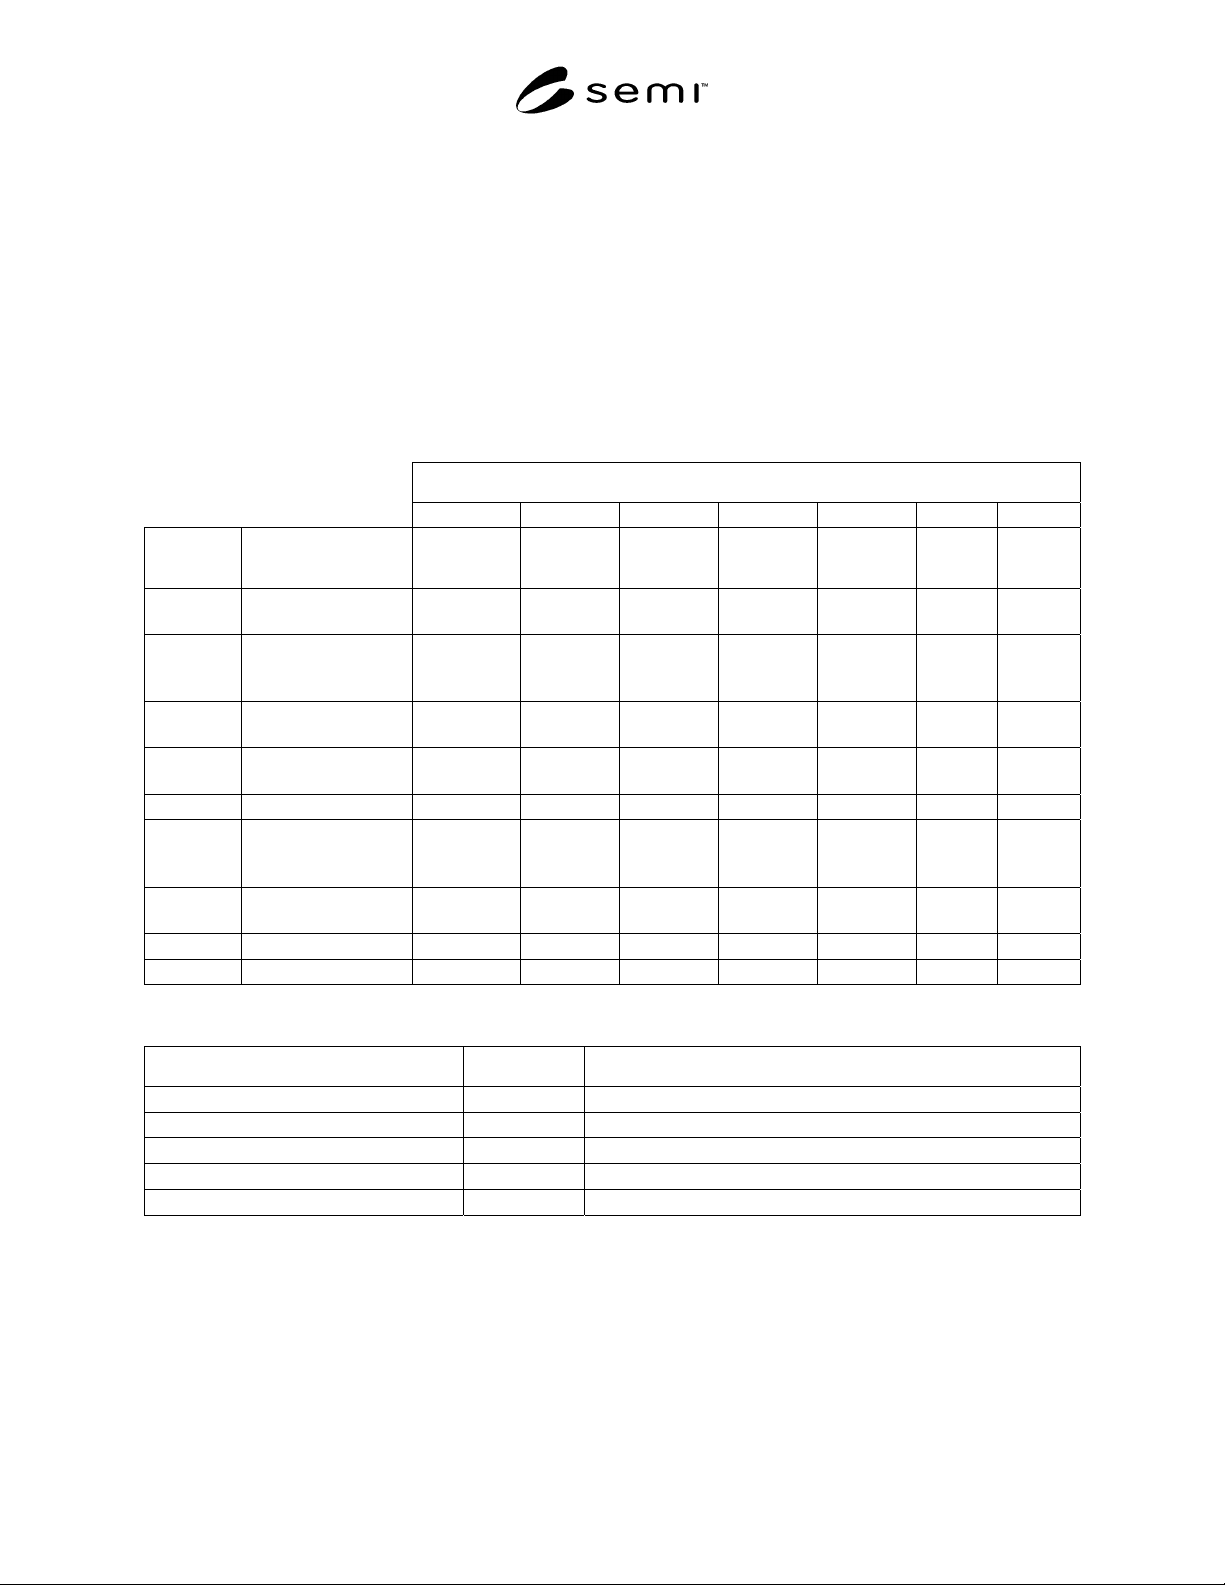
Table R4-1 Likelihood and Frequency: Based on Number of Occurrence Per Year
Frequency of exposure – based on number of occurrence per year
Infrequent Annually Monthly Weekly Daily Hourly Constant
% of time Likelihood of
occurrence
0.333 1 12 52 365 8760 525600
0% Impossible, Cannot
happen
0 0 0 0 0 0 0
0.25% Almost unlikely,
possible in extreme
circumstances
0.001 0.003 0.03 0.13 0.91 21.9 1,314
1% Highly unlikely,
Though conceivable
0.003 0.01 0.12 0.52 3.65 87.6 5,256
5% Unlikely, but could
occur
0.017 0.05 0.6 2.6 18.25 438 26,280
15% Possible, but unusual 0.05 0.15 1.8 7.8 64.76 1,314 78,840
50% Even chance of
occurance, can
happen
0.167 0.5 6 26 182.6 4,380 262,800
75% Probable, not
surprised
0.25 0.75 9 39 273.8 5,570 394,200
90% Likely, to be expected 0.3 0.9 10.8 46.8 328.5 7,884 473,040
100% Certain, No doubt 0.33 1 12 52 365 8,760 525,600
Table R4-2 Likelihood and Frequency: Related to Example Likelihood Table in SEMI S10-1296
Likelihood of occurrence Range Number of times per year (based on 500 installed tools)
Frequent X > 5 Greater than 5 times a year
Likely 1 < X < 5 More once a year, but no more than 5 times a year
Possible 0.2 < X < 1 More once in 5 years, but no more than once a year
Rare 0.1 < X < 0.2 More than once in 10 years, but no more than once in 5 years
Unlikely 0 < X < 0.1 No more than once in 10 years
SEMI S10-1103 © SEMI 1996, 2003 16
Table R4-3 Severity numbers (more quantitative)
Severity number People (See Note R4-1)
Equipment/Facility Property
0 No injury No damage No damage
1
(minor)
Scratch/bruise Non-serious equipment (< 1
hour) or facility damage.
Minor Chemical release
requiring only routine cleanup
without reporting.
Minor
2 First aid only. Non-serious equipment (< 8
hour)
Facility damage (< 1 hour).
Chemical release requiring
only routine cleanup without
reporting.
4 Minor Medical treatment or
restricted work activity (OSHA
recordable) (< 1 week)
Beginning Repetitive strain
injury.
Minor subsystem loss (< 1 day)
Facility damage (< 1 shift).
Chemical release triggering
external reporting
requirements.
Moderate
8 Medical treatment or restricted
work activity (OSHA
recordable). Repetitive strain
injury (intensive treatment
required).
Subsystem loss (< 1 month)
Facility damage (< 1 shift).
16 Disabling injury/illness.
Repetitive strain injury
(permanent restricted work
activity).
Major-system loss (between 1
month and 1 Year)
Facility damage (1-4 Weeks).
Chemical release with
temporary environmental or
public health impact.
Severe
32 Disabling injury/illness. (Loss of
Limbs/ serious illness)
Total System loss; (> 1 Year)
Facility loss (between 1 month
and 1 Year).
Catastrophic
64 One or more fatalities. Total Facility loss (> 1 year). Chemical release with lasting
environmental or public health
impact.
Note R4-1: This number is if 1-2 people are exposed to the risk. The number must be doubled when there are 3 or more people involved.
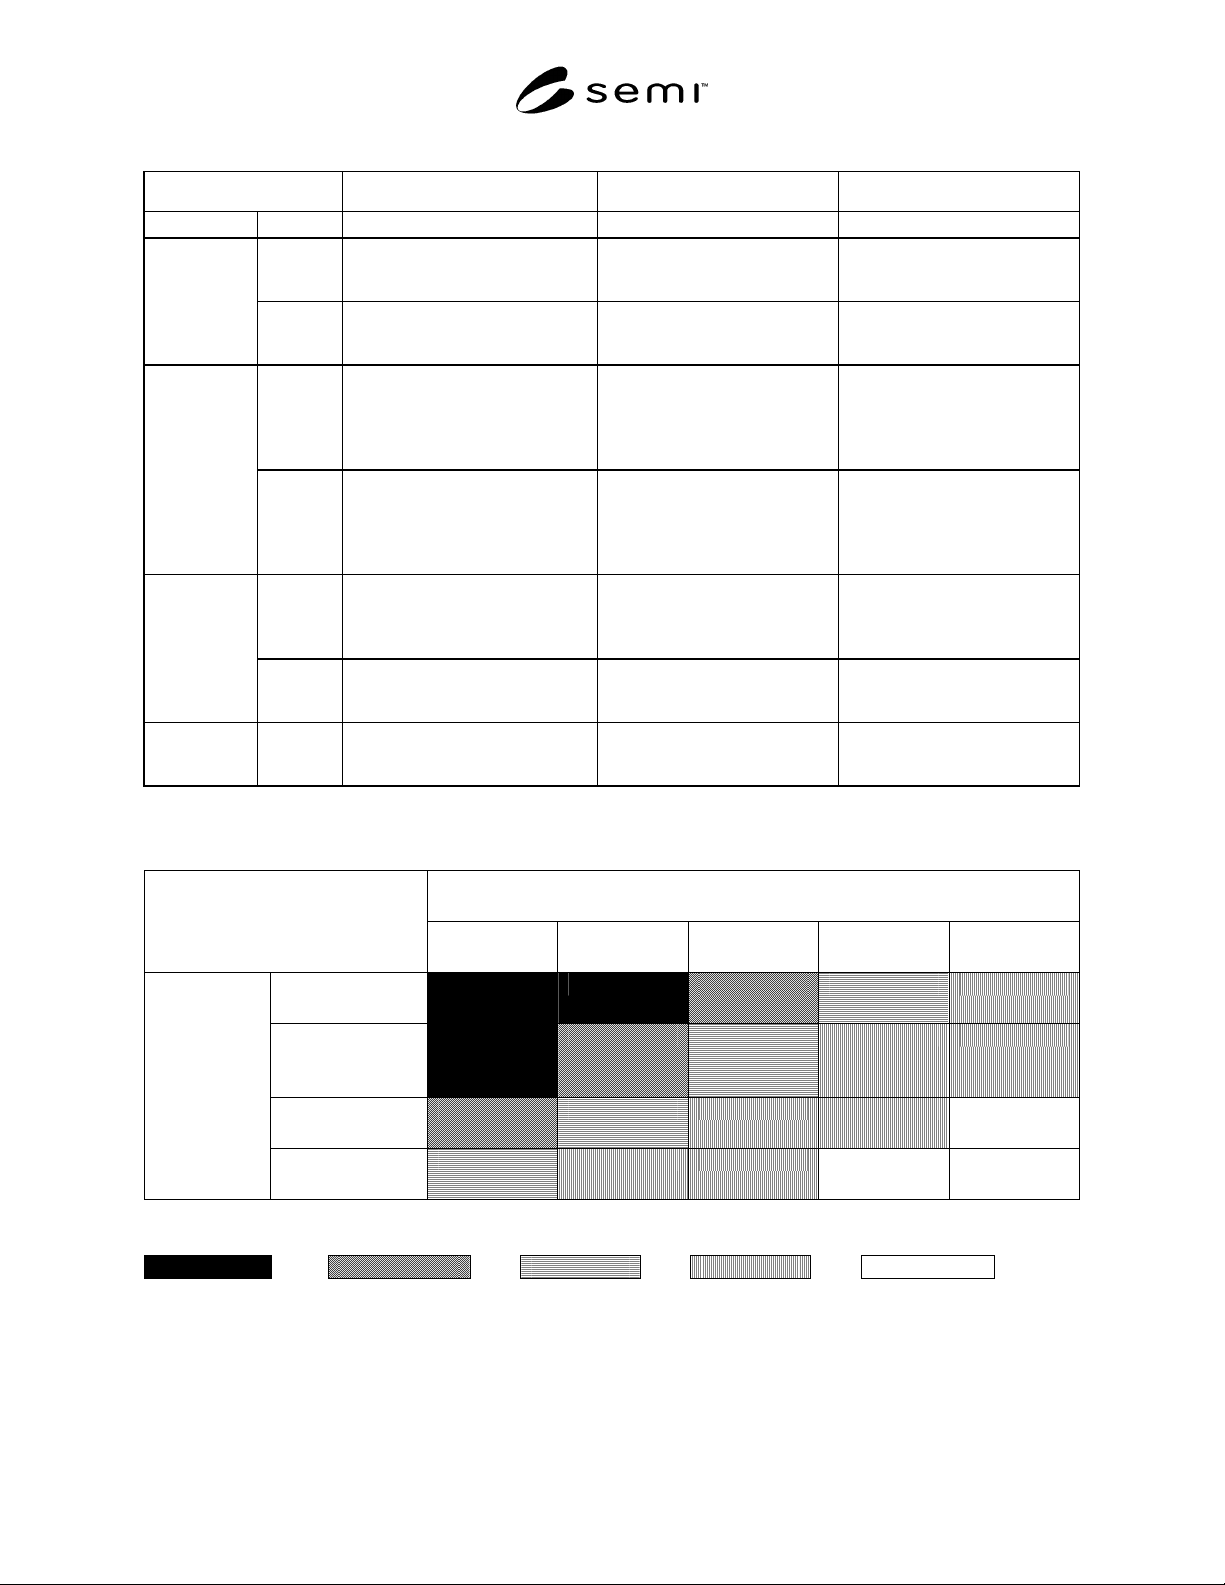
Table R4-4 Table R4-1 to Table R4-3 related to Appendix 1 Table A3
LIKELIHOOD
RISK
ASSESSMENT
MATRIX
FREQUENT
(X >5)
LIKELY
(1 < X < 5)
POSSIBLE
(0.2 < X < 1)
RARE
(0.1 < X < 0.2)
UNLIKELY
(0 < X < 0.1)
CATASTROPHIC
(≥ 64)
SEVERE
(8 ≤ x < 64)
MODERATE
(4 ≤ x < 8)
S
E
V
E
R
I
T
Y
MINOR
(1 ≤ x < 4)
Overall Risk Ranking Categories:
VERY HIGH HIGH MEDIUM LOW VERY LOW
NOTE 1: The Risk Categories of “Very High” and “Very Low” correspond identically with the Risk Categories, used in
previous SEMI documents (e.g., S10-12-96, S2, and S14) of “Critical” and “Slight”. The terms were changed to facilitate
translation from English.