semi合集-English.pdf - 第7330页
SEMI MF1366-0305 © SEMI 2003, 2005 5 11.4.6 Repeat ¶11.4 .4 and ¶11.4.5 for a third and fourth r ound of measurements, all in their own separate craters. Group all the analyses for each specimen ne ar the center of the w…

SEMI MF1366-0305 © SEMI 2003, 2005 4
two standards bracket the expected values for the test specimen (that is, one calibration standard is higher in oxygen
and one is lower, compared to the expected value in the test specimen).
10.2 The calibration standards must be measured by infrared absorption to determine the concentration and
homogeneity of the oxygen within the standards; each standard is assigned the averaged infrared absorption oxygen
value (IOC-88) for the substrate.
10.3 Calibration standards that are included in the SIMS analyses must be taken from that portion of the wafer that
provided a homogeneous measurement in the Fourier transform infrared (FT-IR) spectrophotometer analysis; this
portion is typically the central portion of the wafer.
10.4 Each calibration standard specimen must be the same size and have the same polished surface as the test
specimen.
10.5 The float zone specimens that are included in the SIMS analysis to measure the instrumental oxygen
background must be measured by infrared absorption to determine if the oxygen concentration is low enough to
measure the instrumental SIMS background. Oxygen concentrations below 0.5 ppma in the float zone specimen are
normally sufficient.
10.6 Each float zone specimen must be the same size and have the same polished surface as the test specimen.
11 Procedure
11.1 Specimen Loading
11.1.1 Load the specimens into the SIMS sample holder, checking to see that the specimens are flat against the
backs of the windows and cover the windows as much as is possible. A specimen load includes one float zone
silicon specimen, two or more standard specimens, and the test specimen.
11.1.2 Bake the loaded sample holder at 100C ± 10°C for a minimum of 1 h in air.
11.2 Instrument Tuning
11.2.1 Turn on the instrument in accordance with the manufacturer’s instructions.
11.2.2 Fill the liquid nitrogen or helium cold trap.
11.3 Analytical Conditions
11.3.1 Use a cesium primary ion current and focus, which maximizes the ion count rate for an appropriate silicon
isotope.
11.3.2 Typical analytical conditions are a 250 m by 250 m raster and 1-s integrations. Choose apertures to keep
the oxygen count rate on the electron multiplier detector below 1 × 10
5
counts per second for the test specimen.
11.4 Analysis of Specimen
11.4.1 Position the specimen holder so that the sputtered crater in the specimen will form near the center of the
window.
11.4.2 Center the primary ion beam and begin a SIMS profile.
11.4.3 Repeat ¶11.4.1 and ¶11.4.2 for all the specimens in the holder until all the specimens have been presputtered.
This is called a presputtering round and is intended to reduce the instrumental oxygen background. No oxygen data
are taken or used from these profiles.
11.4.4 Now make a second round of measurements on all the samples according ¶11.4.1 and ¶11.4.2, but in
locations near the presputtered craters of the specimen. Do not make the second round of measurements in the same
craters as the presputter craters.
11.4.5 At the end of each profile in the second round of craters, measure and record the
16
O
count rate on the
electron multiplier detector and the
30
Si
, or other Si isotope as appropriate, matrix ion count rate on the Faraday cup
detector.

SEMI MF1366-0305 © SEMI 2003, 2005 5
11.4.6 Repeat ¶11.4.4 and ¶11.4.5 for a third and fourth round of measurements, all in their own separate craters.
Group all the analyses for each specimen near the center of the window but do not overlap. The raster area for each
analysis must be the same.
11.4.7 Calculate the ratio S(O
/Si
) of oxygen count rate to silicon count rate using the recorded secondary ion
intensities at the end of each profile in the second, third, and fourth rounds of profiles, thus obtaining three ratios per
specimen.
11.4.8 Calculate the average S
avg
(O
/Si
) of the three ratios for each specimen in the holder.
11.4.9 Compare the average ratio S
avg-FZ
(O
/Si
) for the float zone specimen to the average ratio S
avg-sp
(O
/Si
) of
the other specimens. If the average ratio for the float zone specimens is not much less (approximately 10 times less)
than the average ratio for the other specimens, then the precision of the measurement may be degraded. In this case,
depending upon the desired precision, it may be necessary to either abort the analysis and find the cause of the high
instrumental background, or to increase the number of measurements per specimen.
11.4.10 Calculate the relative standard deviation (RSD percent) of the ratio S(O
/Si
) for each specimen, including
the calibration specimen, the float zone specimen, and the test specimen.
11.4.11 Repeat the analysis of oxygen for specimens (other than float zone specimens) with a RSD percent greater
than 3%.
11.4.12 Record the specimen identification, O
/Si
ratios, average, standard deviation, and relative standard
deviation in a table and include the same for the float zone silicon specimen.
12 Calculations
12.1 Load Line Calibration Procedure
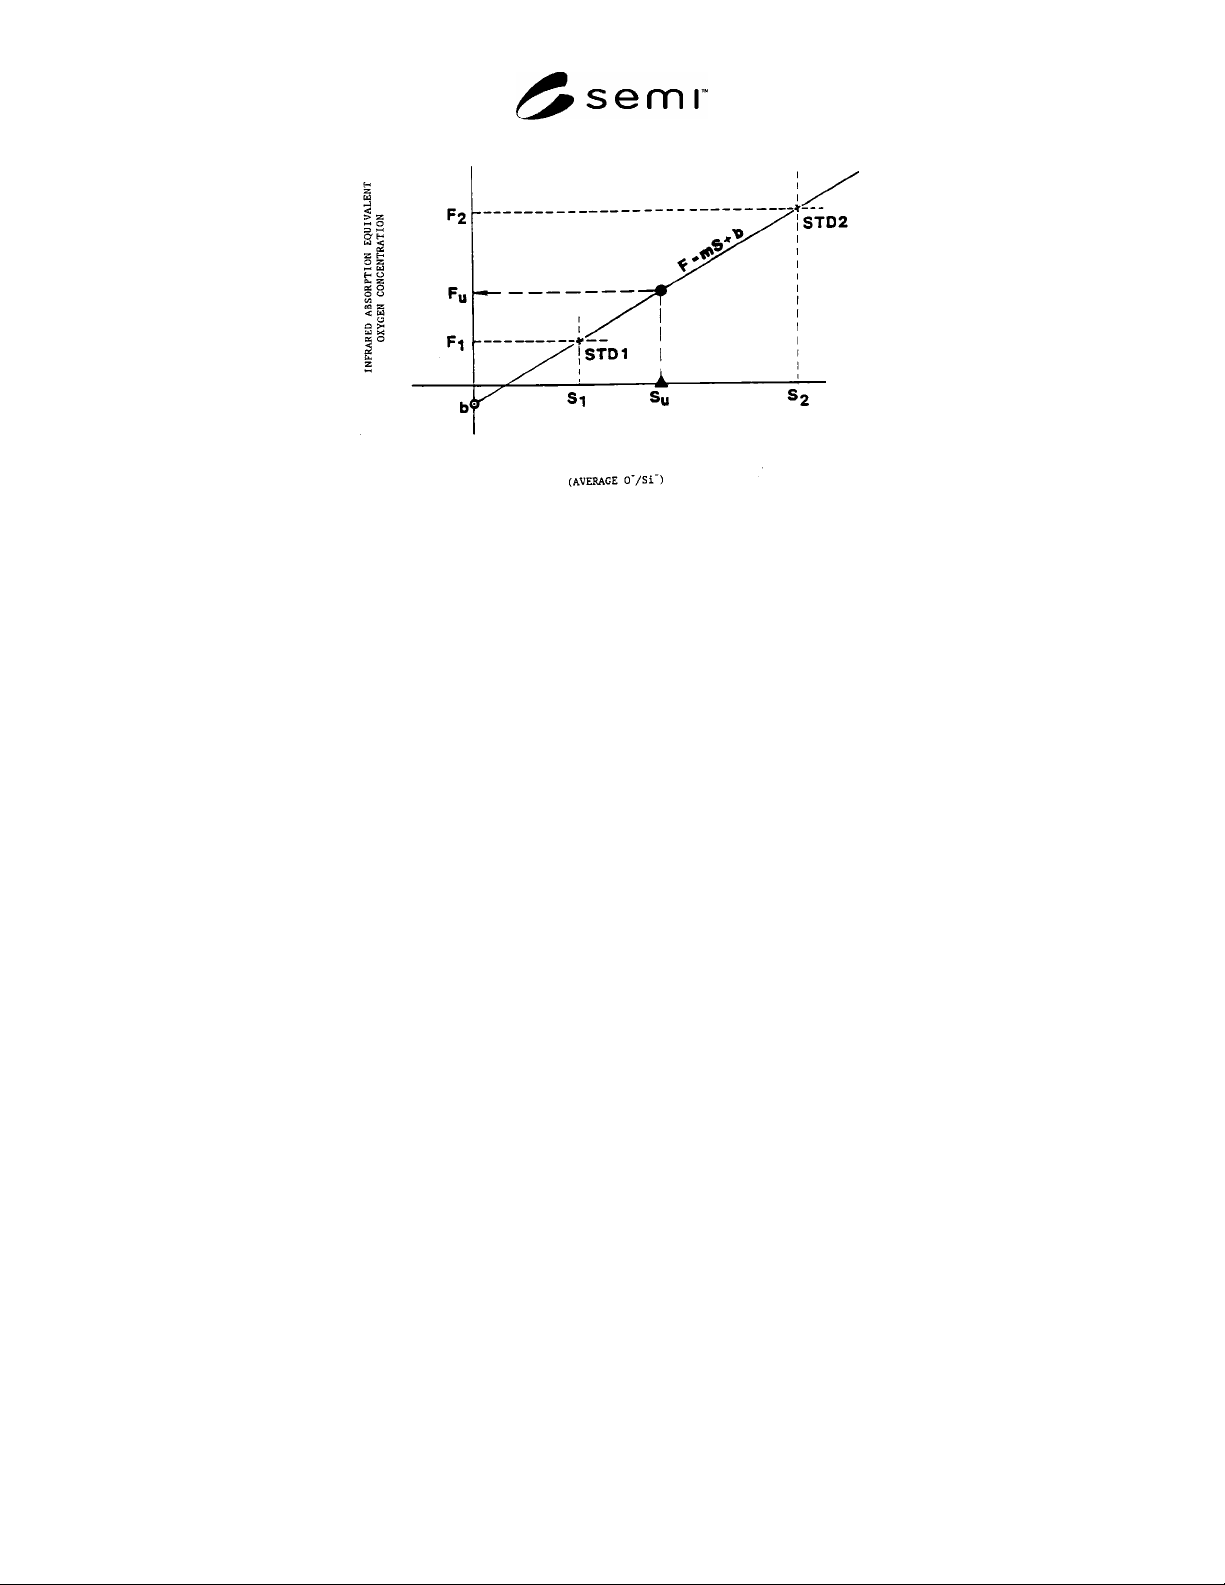
12.1.1 Calculate the slope m and intercept b of the load calibration line of infrared absorption oxygen values F
versus the SIMS average O
/Si
ratios S for the standards as follows:
bmSF
(1)
where m and b are calculated from the assigned infrared absorption oxygen values F
1
and F
2
of the two calibration
standards and S
1
and S
2
are the measured average ratios of the O
/Si
for the two calibration standards.
)(
)(
21
21
SS
FF
m
(2)
)(
)(
12
1221
SS
SFSF
b
(3)
12.1.2 Convert the SIMS O
/Si
ratios S
u
for each test specimen and for the float zone specimen to the infrared
absorption equivalent value F
u
based on the calibration line (Equation 1) and as illustrated in Figure 1.
12.2 Load Factor Calibration Procedure
12.2.1 Calculate the calibration load factors, LF
1
= F
1
/S
1
and LF
2
= F
2
/S
2
, of the assigned infrared absorption
oxygen F to the S ratio O
/Si
from the standard samples using the average ratios of the O
/Si
from the calibration
standards.
12.2.2 Calculate the average load factor, LF
avg
, as follows:
2
)(
21
LFLF
LF
avg
(4)
SEMI MF1366-0305 © SEMI 2003, 2005 6
Figure 1
Load Line Calibration for SIMS Bulk Oxygen Analysis
12.2.3 Convert the SIMS O
/Si
ratios S
u
for each test specimen to the infrared absorption equivalent value F
u
by
multiplying the S
u
by the average load factor LF
avg
derived from the calibration standards, as follows:
avguu
LFSF
(5)
13 Report
13.1 Report the following information:
13.1.1 The instrument used, the operator, and the date of the measurements,
13.1.2 Identification of test and standard specimens,
13.1.3 Calibration procedure used,
13.1.4 The infrared absorption equivalent oxygen values for the test specimen and the float zone silicon specimen,
and
13.1.5 The relative standard deviations (RSD percent) of the oxygen values for the test specimen and the float zone
silicon.
14 Precision
14.1 The precision was estimated for both the load line calibration and average load factor calibration procedures
using 191 samples from one silicon wafer and measured in 191 different loads over a two-month period. The one
standard deviation was 0.38 ppma for both methods for an oxygen level of 18 ppma. The data are given in
Appendix 1.
14.2 The load line and average load line methods to quantification gave equivalent accuracy and precision in the
test outlined in ¶14.1. The reason one is used versus another is more conceptual than empirical if the oxygen values
for the standards bracket the oxygen values of the test specimens.
15 Keywords
FTIR; oxygen; secondary ion mass spectrometry; silicon