semi合集-English.pdf - 第3930页
SEMI F35-0304 © SEMI 1998, 2004 4 13.3 There will be two modes of O 2 measurement: 13.3.1 Critical Sample Point O 2 Measurement 13.3.1.1 Applicable to O 2 measurem ents performed continuously on the critical sample p oin…

SEMI F35-0304 © SEMI 1998, 2004 3
8.1.1 The operation and calibration of the specific
equipment used in performing this test.
8.1.2 The proper procedures in handling UHP gases as
agreed upon by supplier and user.
8.1.3 The proper safety procedure in handling
combustible or toxic gases as agreed upon by supplier
and user.
8.1.4 The behavior of atmospheric leak sources relative
to position, pressure/flow, and gas usage.
9 Apparatus
9.1 An analyzer must be selected which is capable of
continuous ultra-low trace O
2
measurements, with the
ability to report measurements with at least once per
minute frequency.
9.2 The ultra-low trace O
2
analyzer shall meet or
exceed the following specifications. These
specifications are appropriately defined in Section 5:
Sensitivity < 0.1 ppb
Low Detectable Limit < 0.3 ppb
Weekly Zero Drift < 0.5 ppb
Response Time < 10 minutes for 90% of a
0–1 ppb O
2
step change
NOTE 2: The O
2
analysis must be conducted using an
analytical method which meets or exceeds the specifications
required by this test method. If not, the user will not be able to
confidently distinguish true gas distribution system impurity
trends from false analyzer trends.
10 Safety Precautions
10.1 This test method is not a replacement for safety
regulations. It is the responsibility of the user to ensure
that the UHP gas distribution systems under analysis
comply with applicable safety regulations, as agreed to
between gas supplier and user.
10.2 It is also the responsibility of the user to comply
with applicable safety regulations governing the
operation of the required O
2
analytical equipment, as
specified by the analyzer manufacturer.
11 Identify Sample Point Locations
11.1 Identify the critical sample point locations in the
UHP gas distribution system which allow for a
continuous gauging of overall system integrity. These
shall include, at a minimum:
11.1.1 An exit purity O
2
measurement of the UHP gas
at the furthest point of the gas distribution system
within the fab.
11.1.2 Sample point locations representing sub-
sections of the UHP gas distribution system, which are
deemed critical for the avoidance of atmospheric
impurities.
11.1.3 Point-of-use process tool locations which are
deemed critical for the avoidance of atmospheric
impurities.
11.2 A source purity O
2
measurement of the UHP gas
entering the gas distribution system is suggested to be
used as a reference comparison against other points
within the fab.
11.3 Additional investigative (spot check) O
2
measurements may be required at sample point
locations which aid in deducing the location of
suspected atmospheric leak sources. This will vary from
situation to situation. (See Section 16.)
11.4 The exact sample tap location must be
representative of the measurement point of interest.
Avoid measurement of dead-leg locations.
12 Preparation of Sample Point Locations
12.1 Thoroughly pre-purge the sample point prior to
connecting the O
2
analyzer.
12.2 Thoroughly cycle-purge any regulators or other
components in the sample system. Cycle the pressure at
least 20 times with a high/low pressure ratio of at least
5 times.
12.3 Connect the O
2
analyzer to the sample point using
appropriate UHP gas lines and fittings. Avoid using
long lengths of bellows-type tubing because of long
purge-down requirements. Avoid using Teflon or
plastic tubing of any kind. Teflon and most other
plastics are extremely permeable to O
2
and will cause
atmospheric O
2
leakage. Only a few feet of plastic
tubing can introduce ppm levels of O
2
.
12.4 Establish flow from the sample point to the O
2
analyzer per the manufacturer’s recommendations.
13 Calibration and Qualification
13.1 Follow the manufacturer’s recommendations for
initial start-up and calibration of the O
2
analyzer.
13.2 After initial start-up and calibration, adhere to the
manufacturer’s recommendations for routine calibration
and maintenance needed to achieve the required
performance specification as described in Section 9.2.

SEMI F35-0304 © SEMI 1998, 2004 4
13.3 There will be two modes of O
2
measurement:
13.3.1 Critical Sample Point O
2
Measurement
13.3.1.1 Applicable to O
2
measurements performed
continuously on the critical sample point locations
identified earlier.
13.3.1.2 Prior to continuous data collection use of the
analyzer, validate it by demonstrating the capability
required in the specification for Weekly Zero Drift.
Chart the zero baseline drift and peak-to-peak noise
while on zero gas for 1 week.
13.3.1.3 Re-validate the O
2
analyzer performance by
running a 24-hour blank test on zero gas monthly.
13.3.2 Investigative Sample Point O
2
Measurement
13.3.2.1 Applicable to spot check O
2
measurements
performed in the investigation of locating atmospheric
leak sources.
13.3.2.2 The O
2
analyzer must be operated for a time
period sufficient to establish the “contaminant
signature” at the point of interest.
13.3.2.3 Validate the O
2
analyzer with a blank test
prior to each use. Chart zero baseline drift over a period
of time which is twice as long as the expected time
required to make the O
2
measurement. If a
measurement can typically be made successfully in less
than one hour, then verify the zero drift and peak-
topeak noise with a two-hour blank test.
14 Data Collection Procedure
14.1 Collect all O
2
measurement data at a minimum of
1 point/minute using a chart recorder or data acquisition
device.
14.2 Graph data points with sufficient resolution to
observe trends over a one-week period. The graph must
also be able to resolve O
2
spikes which may last only
10–15 minutes.
15 Interpretation of Results
15.1 Generate graphs of the baseline “contaminant
signature” for each critical sample point location.
Compare the baseline “contaminant signature” with the
O
2
analyzer’s blank run on zero gas to validate that the
analyzer is producing useful data. The base-line
“contaminant signature” should exhibit equal or greater
O
2
variation than the blank run on zero gas.
15.2 Problem Identification
15.2.1 Observe data from critical sample point
locations and look for deviations (abnormal trends or
events) from the baseline “contaminant signature”.
15.2.2 Determine if deviations (observed trends or
events) are sufficient to impede mandatory atmospheric
impurity specifications or influence critical
product/process quality.
15.2.2.1 If yes, proceed into Section 16.
15.2.2.2 If no, continue observing O
2
data from critical
sample point locations.
SEMI F35-0304 © SEMI 1998, 2004 5
16 Atmospheric Leak Locating Procedure
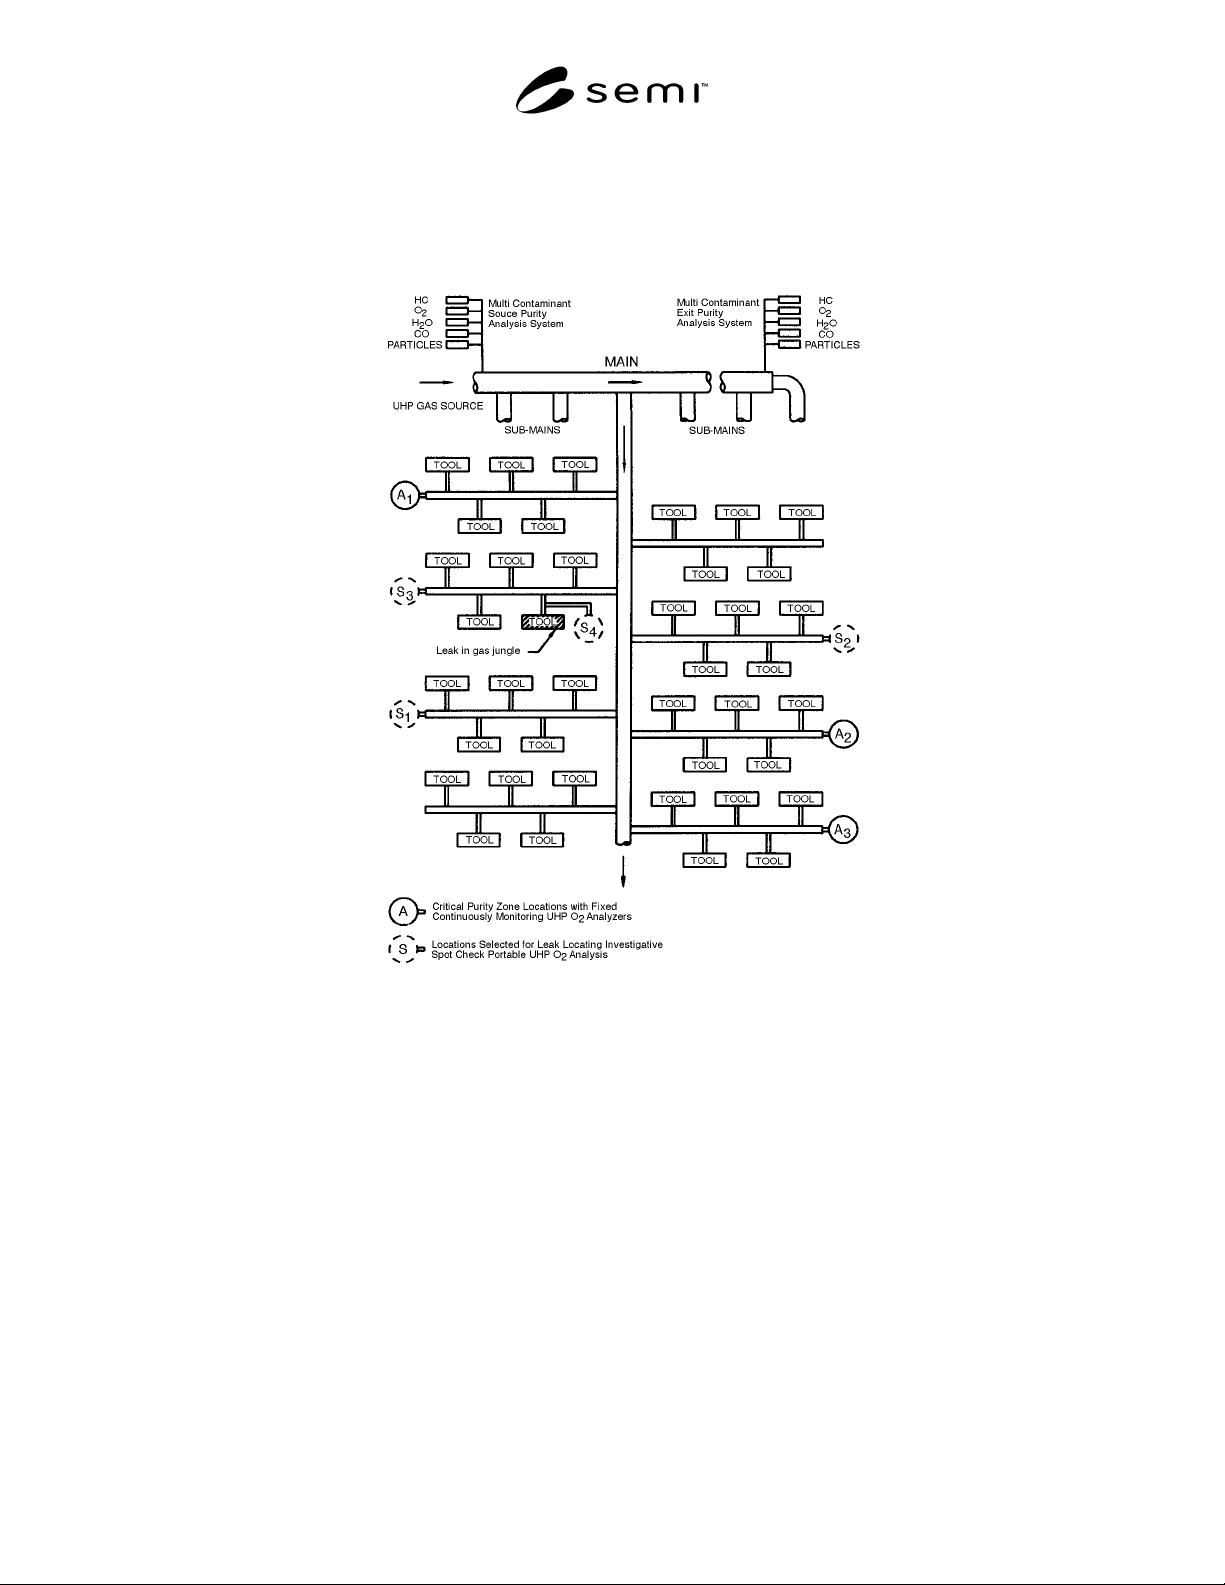
16.1 Familiarize yourself with Figure 1 before proceeding with the remainder of Section 16.
Figure 1
Typical Fab UHP Gas Distribution System
16.2 Isolate a zone where the contamination is likely to originate from by comparing the O
2
levels at the critical
continuous monitoring sample point locations. Assume the leak source is somewhere between the last
uncontaminated sample point and the first contaminated sample point going downstream. Some knowledge of the
gas distribution flow path will be required here.
16.3 Compare the data from the O
2
analyzer detecting the contamination with pressure and flow data, or gas usage
demand over time in the specific lateral of the gas distribution system where the O
2
analysis is being made.
16.4 Correlate the changes in O
2
readings which show abnormally high O
2
levels with specific tool cycles that
cause the UHP gas pressure and flow in the lateral line to change. The timing of the analyzer’s response to these
usage demands will give some clues as to the approximate position of the atmospheric leak source.
NOTE 3: Back-contamination is likely originating in a leg which is dead at the time the O
2
analyzer responds. Actual response
time will depend on the time needed for the contaminant to travel to the O
2
analyzer plus the response time of the O
2
analyzer.
16.5 If no demand cycles in the lateral cause O
2
readings to change, then the source of contamination is likely to
occur further upstream in the distribution system, prior to the intersection of the lateral in question. This assumes
that there is always a net flow of gas in the line leading to the intersection of the lateral being checked.