semi合集-English.pdf - 第3897页
SEMI F28-1103 © SEMI 1997, 2003 7 6.4.2.6 In order to determine if there is statistical evidence of the component having an effect on the observed pa rticle count, a t est must be co nducted to see if the actual differen…
SEMI F28-1103 © SEMI 1997, 2003 6
6.3.4 Dynamic Test — This test is to immediately
follow the static test. To conduct the dynamic test,
actuate the panel’s final process outlet valve at the rate
of 1 cycle/minute for 60 minutes. Each cycle consists of
having the valve in the open position for 58 seconds
and in the closed position for 2 seconds.
6.3.5 Cylinder Change Test — Close V-2, open V-3
and V-4, and adjust PCV-2 until PI-5 reads 3450 Kpag
(500 psig). Adjust the flow rate and pressure to the
vacuum venturi using FC-3 and PCV-3. The flow rate
and pressure should be set to the manufacturer’s
recommended values. Next perform a simulated
cylinder change purge and evacuation sequence
following the valve sequencing, dwell times, pressure
settings, etc. as specified by the manufacturer.
6.3.6 Final Steady State Test — Close V-4, V-3, and
open V-2. Repeat the step in Section 6.3.3.3.
6.3.7 Unregulated Flow Test (optional) — In some
instances, it may be desirable to test the panel with its
regulator in the fully-open position. Such a test will
give an indication of panel particulate performance
without the additional contribution of particles from an
operating regulator. In this instance, steps 6.3–6.3.5
should be repeated with the regulator in the wide open
condition.
6.4 Data Analysis and Reporting — The following test
conditions are to be reported in the data presentation:
1. Date and time of test
2. Operator
3. Test flow rate
4.Test pressures
5. Panel type, manufacturer, and serial number
6. Particle counter manufacturer, serial number, sample
flow rate, model number, specified particle size
sensitivity, and calibration date
7. Test gas type and dew point
8. A schematic of the test apparatus, including
manufacturer’s and model numbers of all test
apparatus components
9. Calibration dates for all instrumentation.
6.4.1 Data Presentation — Graph the static and
dynamic portions of the test separately as counts/minute
(measured by the counter) versus time, including the
appropriate background (measured with the spool piece
in place) with each. Also graph the entire data set as
counts per minute versus time.
6.4.1.1 Present the entire raw data set in tabular form.
6.4.2 Data Reduction — The statistical analysis is
based on the assumption that the particles generated are
randomly distributed and are statistically independent
of each other. The background counts are independent
of the particle performance of the component. The
particle counts observed from the test include the
counts from the component and the background count.
Let:
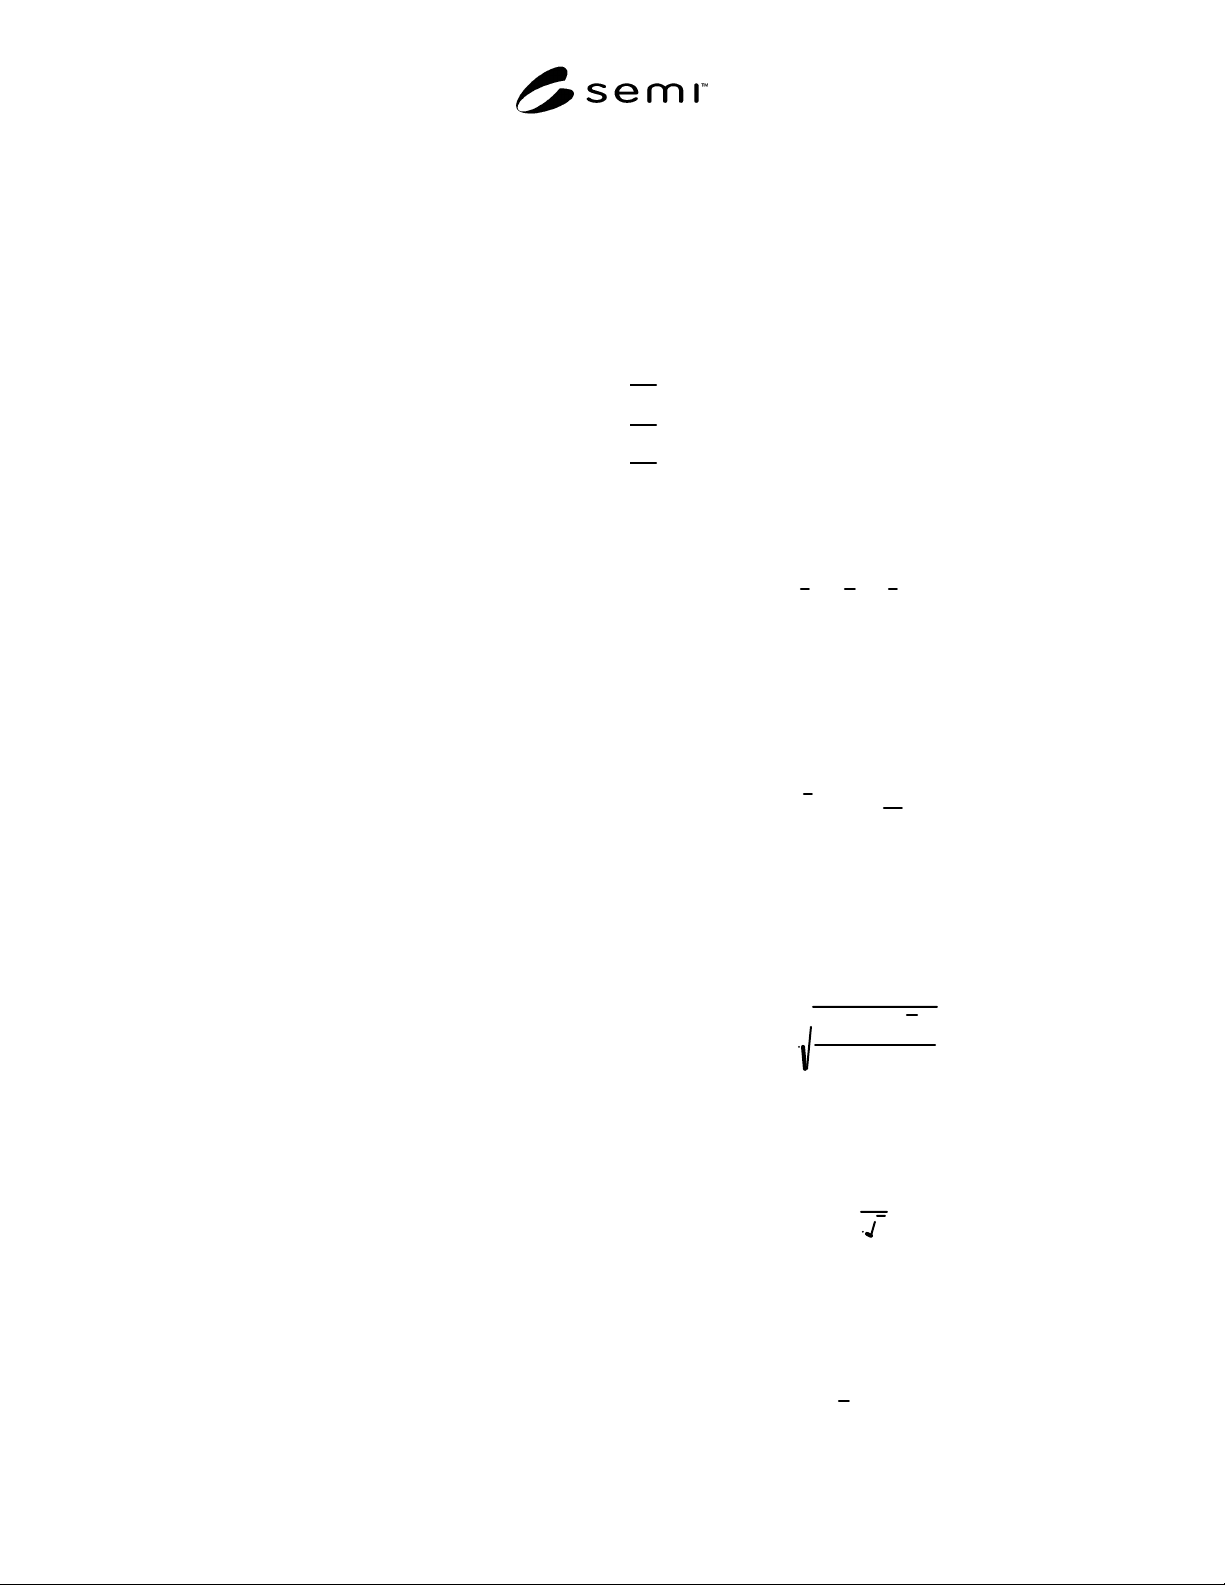
X
B
=
average background particle count
X
t
=
average total particle count from test
X
c
=
average particle count generated by the test component
Therefore,
X
t
=
X
c +
X
B
6.4.2.1 A statistical analysis of the data is performed to
determine the mean, standard deviation, and the
standard error for each particle size range.
6.4.2.2 The sample mean, X, or average of the data for
each state is given by:
X
=
X
i
n
i= 1
n
∑
where X
i
is the observed counts for the state and n is the
number of samples.
6.4.2.3 The sample standard deviation is a measure of
the variability of the data about the mean. The standard
deviation, s, for each state is expressed as:
s =
(Xi − X
)
2
i=1
n
∑
n − 1
6.4.2.4 The standard error, Se or standard deviation of
the sampling distribution of the mean for each state is
given below:
Se =
s
n
6.4.2.5 The average particle count for the total number
of particles generated, or the sample mean, is an
estimation of the population mean. For a 95%
confidence level, the population mean, µ
p
, will be
within two standard errors of the sample mean, or:
µ
p
= X ± 2 Se

SEMI F28-1103 © SEMI 1997, 2003 7
6.4.2.6 In order to determine if there is statistical
evidence of the component having an effect on the
observed particle count, a test must be conducted to see
if the actual difference between the average background
count, X
B
, and the average test count, X
t
, exceeds two
standard errors in a distribution of differences between
means. The average particle count generated by the test
component, X
c
, is given by:
X
c =
X
t −
X
B
6.4.2.7 The standard error in a distribution of
differences between means is expressed as:
S
ec
= S
et
2
+ S
eB
2
6.4.2.8 The 95% confidence interval of the test
component itself is then determined by:
X
c ± 2 S
ec
6.4.2.9 If this confidence interval includes 0, then this
implies that there is not strong statistical evidence of
the component having an effect on the observed particle
count. If this interval does not include 0, then this
implies there is strong statistical evidence that the
component does have an effect on the observed particle
count.
6.4.2.10 Present in tabular form the average particle
count and the associated upper and lower confidence
limits (as calculated in Section 6.4.2) for each test state.
In addition, present the background test data separately
as a distinct element.
7 Related Documents
Agarwal, J. K. and Sem, G. J., “Continuous Flow,
Single Particle Counting Condensation Nucleus
Counter”, Journal of Aerosol Science, v.11.4. July
1950: 343–357
Fissan, H. and Schwientek, “Sampling and Transport of
Aerosols”, TSI Journal of Particle Instrumentation,
v.2.2. July–December 1987: 3–10
Hinds, W. C. Aerosol Technology: “Properties,
Behavior, and Measurement of Airborne Particles”,
John Wiley & Sons. 1982: 187–194
VanSlooten, R. A., “Statistical Treatment of Particle
Counts in Clean Gases”, Microcontamination, v.4.2.
February 1986: 32–38
ANSI/ASME B46.1
2
— “Specification for Surface
Texture - Surface Roughness, Waviness, and Lay”
NOTICE: SEMI makes no warranties or
representations as to the suitability of the standards set
forth herein for any particular application. The
determination of the suitability of the standard is solely
the responsibility of the user. Users are cautioned to
refer to manufacturer’s instructions, product labels,
product data sheets, and other relevant literature
respecting any materials mentioned herein. These
standards are subject to change without notice.
The user’s attention is called to the possibility that
compliance with this standard may require use of
copyrighted material or of an invention covered by
patent rights. By publication of this standard, SEMI
takes no position respecting the validity of any patent
rights or copyrights asserted in connection with any
item mentioned in this standard. Users of this standard
are expressly advised that determination of any such
patent rights or copyrights, and the risk of infringement
of such rights, are entirely their own responsibility.
2 American Society of Mechanical Engineers, Three Park Avenue,
New York, NY 10016-5990, USA. Telephone: 800.843.2763
(U.S./Canada), 95.800.843.2763 (Mexico), 973.882.1167 (outside
North America)Website: www.asme.org
Copyright by SEMI® (Semiconductor Equipment and Materials
International), 3081 Zanker Road, San Jose, CA 95134. Reproduction o
f
the contents in whole or in part is forbidden without express written
consent of SEMI.

SEMI F29-0997 © SEMI 1997, 1103 1
SEMI F29-0997 (Reapproved 1103)
TEST METHOD FOR PURGE EFFICACY OF GAS SOURCE SYSTEM
PANELS
This test method was technically approved by the Global Gases Committee and is the direct responsibility of
the North American Gases Committee. Current edition approved by the North American Regional Standards
Committee on September 3, 2003. Initially available at www.semi.org September 2003; to be published
November 2003. Originally published September 1997.
1 Purpose
1.1 This document defines the purge efficacy test
method recommended for determining the minimum
acceptable level of purge efficacy for gas source
systems used in semiconductor manufacturing. It is also
intended as an aid to the procurement of gas source
equipment.
NOTE 1: Users of this specification are encouraged to submit
suggested revisions or other comments to SEMI.
2 Scope
2.1 This specification applies to gas source equipment
used in semiconductor manufacturing facilities and
comparable research and development areas. It includes
contamination testing requirements for gas source
systems.
2.2 The tests covered by this document are as follows:
2.2.1 Purge efficacy with a non-interactive gas using
manufacturers’ standard purge sequence.
2.2.2 Purge efficacy with a non-interactive gas using
the test method specified purge sequence.
2.2.3 Purge efficacy with an interactive gas using
manufacturers’ standard purge sequence.
2.2.4 Purge efficacy with an interactive gas using the
test method specified purge sequence.
NOTICE: This standard does not purport to address
safety issues, if any, associated with its use. It is the
responsibility of the users of this standard to establish
appropriate safety and health practices and determine
the applicability of regulatory or other limitations prior
to use.
3 Limitations
3.1 The document is not intended to determine the safe
operation of a gas source system. The test method
described here is for determining the removal efficacy
of hazardous gas from the pigtail portion of the gas
panel during routine cylinder change operations (pre-
purge). It does not address the purge condition after the
change of the cylinder (post-purge) nor the purge of the
entire gas source system which is usually performed
following its initial installation or during maintenance
(maintenance purge).
3.2 Because the response time of moisture and oxygen
analyzers utilizing different technologies can differ
significantly, this can lead to the possibility that
different instruments will report different peak heights
when measuring identical contaminant spikes.
Therefore, results of tests should only be compared
when similar analyzers are used.
4 Referenced Standards
None.
5 Terminology
5.1 Abbreviations and Acronyms
5.1.1 ppb — Molar parts per billion, same as ppbv.
5.1.2 ppm — Molar parts per million, same as ppmv.
5.2 Definitions
5.2.1 clean dry air (CDA) — filtered air filtered to 0.02
mm and dried to a dew point of at least -80° C.
5.2.2 dry down — removal of residual moisture in a
gas delivery or distribution system, often accomplished
by flowing a stream of high purity dry inert gas
continuously through the system for an extended period
of time.
5.2.3 dwell time — the time for which vacuum or
pressure is applied during the evacuation or
pressurization steps of a purge operation.
5.2.4 interactive gas — a gas that will readily adsorb to
the surface of a vessel used to contain or transport it.
Examples of interactive gases are hydrogen chloride
and moisture.
5.2.5 non-interactive gas — a gas that will not adsorb
to the surface of a vessel used to contain or transport it.
Examples of non-interactive gases are oxygen and
nitrogen.
5.2.6 pigtail — the pigtail is the part of the gas source
equipment that is the flexible connection between the
cylinder and the gas panel.