semi合集-English.pdf - 第5242页
SEMI M40-0200 © SEMI 2000 24 Table R1-11 S/N R atios for the 2 nd Order Effects of Table R1-9 c1/e1 c1/ c2 c1 /e2 c1/ sym e1/c2 e1 /e2 e1/sym c2 /e2 c2/s ym e2/sym ravg1 7 .7045 10.7110 7 .7045 19.2237 10.5897 7 .8732 19…
SEMI M40-0200 © SEMI 200023
pronounced. In any case, the 5-point measurement provides the correct average ± 6%, the 9-point measurement ±
2.5%. In a similar way, the 5-point standard deviation is correct ± 1.6% and the 9-point standard deviation ± 1%.
0
0.2
0.4
0.6
0.8
1
1.2
1.4
center1 lo
center1 hi
edge1 lo
edge1 h i
center2 lo
center2 hi
edge2 lo
edge2 hi
sym. rot.
sym. cyl
Variables
Effects
ravg1 ravg5 ravg9 stdabw5 stdabw9
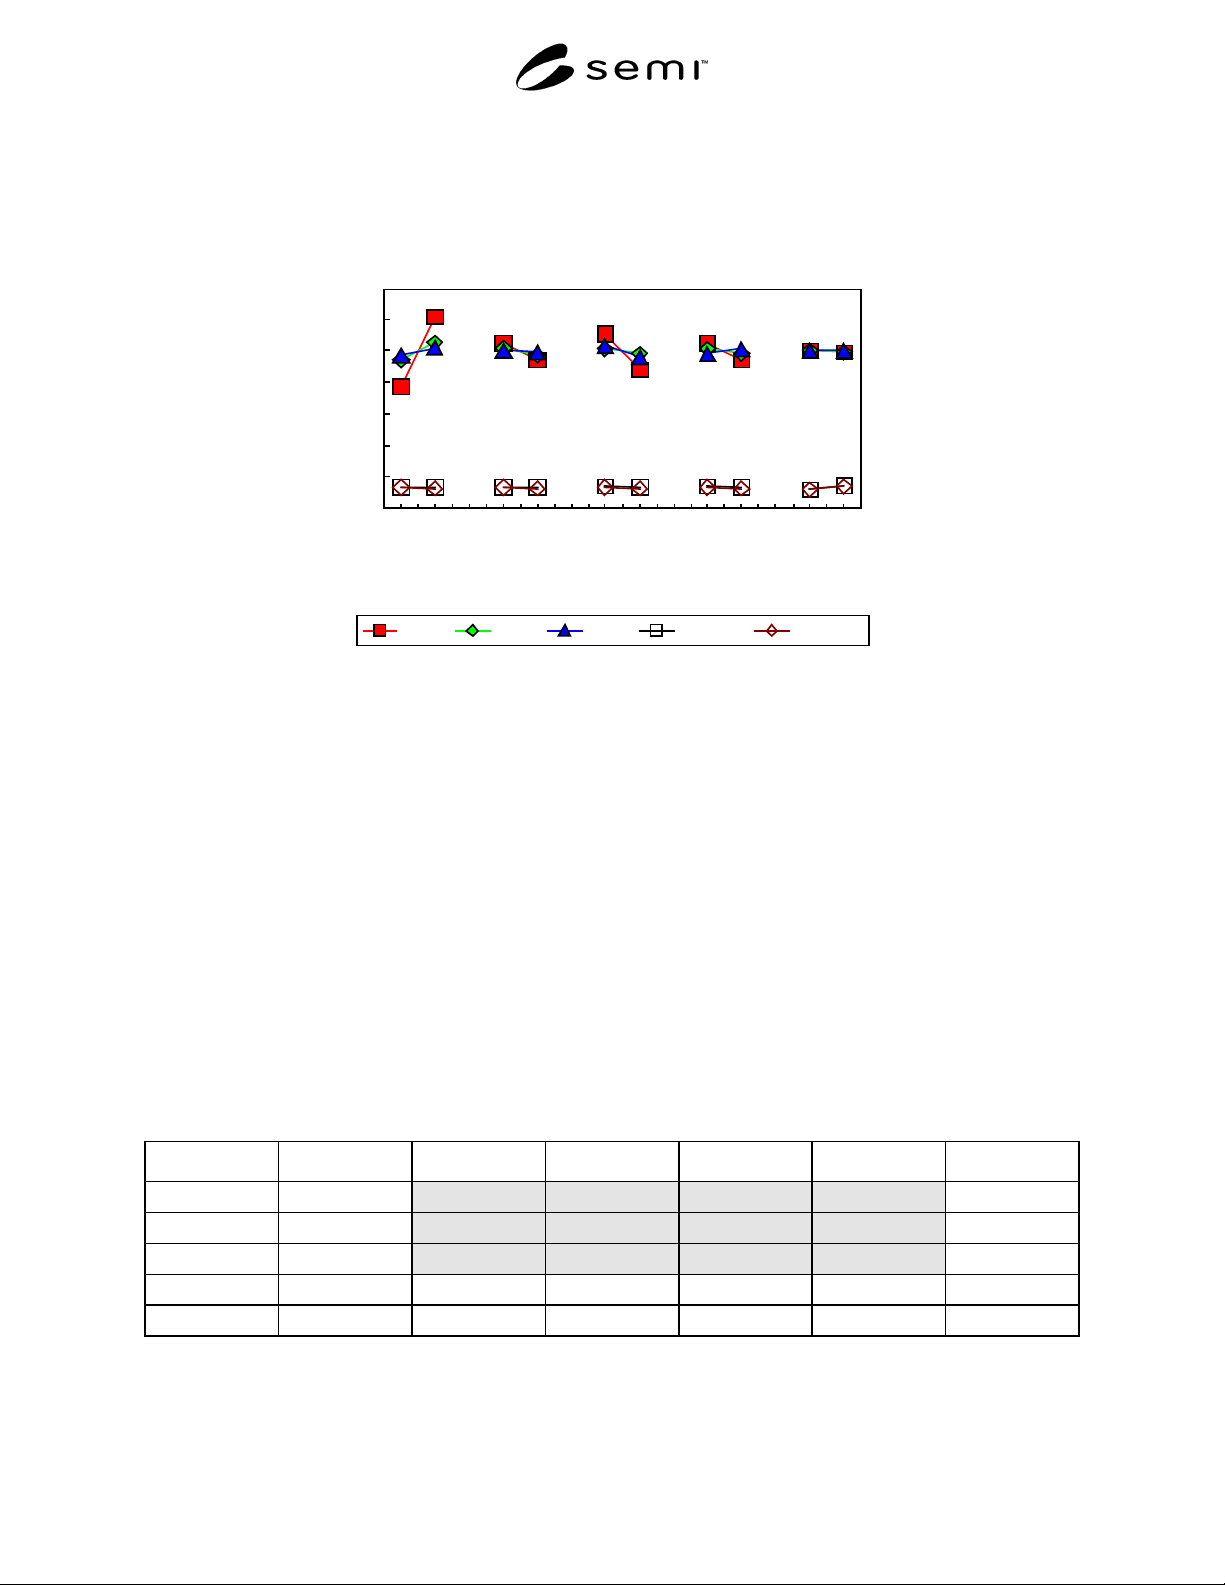
Figure R1-5
Main Effects of the 2
5
Factorial Design for Models a and b
R1-5.3.7 The significance of numbers given in Table R1-8 and Table R1-9 can be estimated only in relation to the
noise or variance of the observables which is also displayed in both tables. The signal-to-noise ratio S/N is obtained
by using a logarithmic measure:
S/N = 10 log (effect
2
/variance)
R1-5.3.8 The corresponding S/N values for the main and for the second order effects are listed in Table R1-10 and
Table R1-11.
R1-5.3.9 A linear signal-to-noise ratio of 3:1 is commonly used to distinguish significant data from insignificant
data. This linear ratio corresponds to a S/N of about 10 in the present case of a logarithmic signal-to- noise ration.
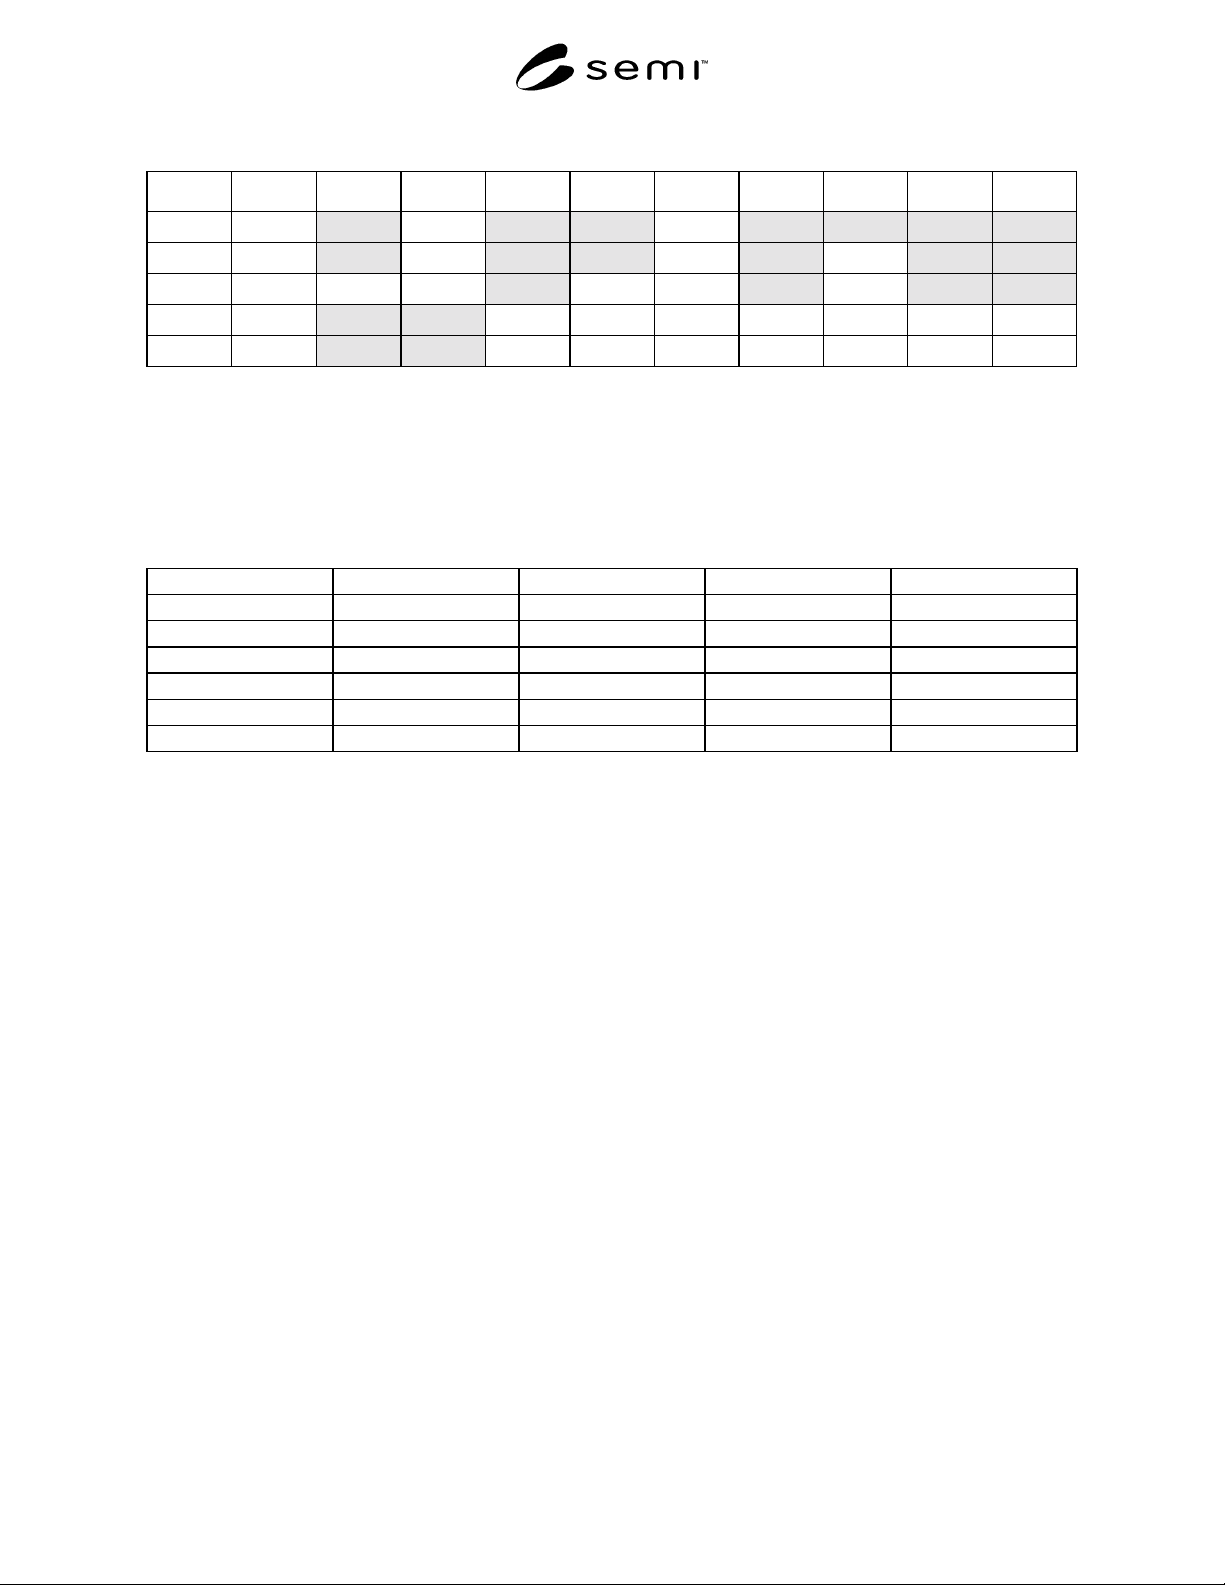
The S/N ratios > 10 are shaded lightly gray in Table R1-10 and Table R1-11. The variables center1,2 and edge1,2
have a significant effect on the relative averages ravg1,5,9. Mainly the interactions of the model selected with the
other variables are significant for the relative averages ravg1,5,9 and the interaction of center1 and center2 for the
relative standard deviations rstdabw5,9. The other cases emphasized in Table R1-11 by shading have a S/N ratio
only slightly larger than 10.
Table R1-10 S/N Ratios for the Main Effects of Table R1-8
average c1 e1 c2 e2 Sym
ravg1 43.7817 36.8384 24.7251 30.8046 24.7251 -0.0364
ravg5 54.3215 35.4230 27.5959 25.8609 23.4801 2.9416
ravg9 53.5959 26.4387 10.1741 30.9124 24.6260 -26.2612
rstdabw5 16.8383 -13.6750 -11.4959 -8.0646 -7.3246 4.6154
rstdabw9 15.0934 -10.7996 -11.7656 -5.7926 -12.5745 -0.9359
SEMI M40-0200 © SEMI 2000 24
Table R1-11 S/N Ratios for the 2
nd
Order Effects of Table R1-9
c1/e1 c1/c2 c1/e2 c1/sym e1/c2 e1/e2 e1/sym c2/e2 c2/sym e2/sym
ravg1 7.7045 10.7110 7.7045 19.2237 10.5897 7.8732 19.0682 10.5897 18.5684 19.0682
ravg5 -2.3106 12.2743 6.3820 10.8291 10.5529 9.0162 10.4414 6.2417 21.3820 21.8517
ravg9 -17.0034 0.7278 8.7438 23.2512 7.3954 -3.1738 23.2558 -11.9623 12.8618 15.1361
Rstdabw5 -9.5587 19.9853 10.2575 -16.7484 7.1802 6.5178 -9.8910 5.1594 -32.1153 -16.1308
Rstdabw9 -8.8505 16.4782 10.2932 -40.5530 0.9730 12.1486 -37.1733 7.4191 -18.3336 -28.6846
R1-5.3.10 The interactions are discussed for two examples, ravg9 and rstdabw5 (Table R1-12). Going from sym lo
(model a, parabolic symmetry) to sym hi (model b, cylindrical symmetry) and keeping c1 fixed at the lo level
decreases ravg9 from 0.993 to 0.963 whereas it increases from 1.007 to 1.037 when c1 is kept fixed at the lo level.
This change in opposite directions indicate an interaction between c1 and sym. c1 and c2 interact in a similar way
with respect to rstdabw5.
Table R1-12 2
nd
Order Effects or Interactions
C1 lo/sym hi 0.963 1.037 c1 hi/sym hi
ravg9
C1 lo/sym lo 0.993 1.007 c1 hi/sym lo
c1 lo/c2 hi 0.219 0.031 c1 hi/c2 hi
stdabw5
c1 lo/c2 lo 0.132 0.223 c1 hi/c2 lo
R1-5.4 Summary and Conclusions
R1-5.4.1 Three different models for surface roughness distribution (roughness maps) were investigated and three
different site patterns for measuring the roughness were applied to them. The parameters of the models – roughness
in the center and near the edge of the wafer – were used as variables in a factorial design and varied between two
levels. Average roughness and the corresponding standard deviations calculated for the site patterns were compared
with the “true” values obtained by evaluating all points of the roughness map.
R1-5.4.2 The patterns where the roughness is measured at five or nine points exhibit a standard deviation of 7 and 5
%, respectively, from the true average value for all possible combinations of the variables. The average of the
standard deviations of the roughness distribution of the single variable sets differs by about 13% from the true value
for the five- as well as nine-point site pattern. A standard deviation of the standard deviations of about 11% is
obtained by averaging over the 32 different variables sets.
R1-5.4.3 The evaluation of the factorial design outlines that the variation of the variables c1, c2, e1, and e2 has a
significant effect – with respect to “noise” – on the average roughness values but not on the corresponding standard
deviations. Varying the surface model does not significantly affect the averages and standard deviations. Some
second order effects or interactions are also significant but less pronounced than the main effects. A pronounced
interaction of the variables c1 and c2 occurs e.g. for the five point standard deviation rstdabw5. This interaction
could be reduced by introducing an additional site for measuring roughness in the center of the wafer with a
direction perpendicular to the present one.
R1-5.4.4 The goal of finding a site pattern which results only in non-significant effects is not completely achieved
by the five and nine point patterns utilized in the present work. However, they allow to measure the average
roughness of wide variety of surface roughness distributions with a one sigma deviation of 5-7 %, or a three sigma
deviation of 15-21 %. These values are certainly more than sufficient for present wafer surfaces.

SEMI M40-0200 © SEMI 200025
R1-6 Related Documents
ASTM E 1392 — Practice for Angle Resolved Optical Scattering Measurements on Specular or Diffuse Surfaces
ASTM F 1048 — Test Method for Measuring the Effective Surface Roughness of Optical Components by Total
Integrated Scattering
J.M. Bennett, L. Mattson, Introduction to Surface Roughness and Scattering, Optical Society of America,
Washington, D.C., 1989
G.E.P. Box, W.G. Hunter, J.S. Hunter, Statistics for Experiments, An Introduction to Design, Data Analysis, and
Model Building, John Wiley, N.Y.
ISO 1879 — Instruments for the measurement of surface roughness by the profile method -- Vocabulary
ISO 3274 — Instruments for the measurement of surface roughness by the profile method – Contact (stylus)
instruments of consecutive profile transformation – Contact profile meters, system M
ISO 4287/1 — Surface roughness – Terminology – Part 1: Surface and its parameters
J.A. Ogilvy, Theory of Wave Scattering from Random Rough Surfaces, IOP Publishing, Bristol, 1991
J.C. Stover, Optical Scattering, Measurement and Analysis, Second Edition, McGraw-Hill, Inc., N.Y. 1995
P. Wagner, H.A. Gerber, in Particles, Haze and Microroughness on Silicon Wafers, SEMICON Europe 1995, W.
Baylies, P. Wagner, Eds.
NOTICE: SEMI makes no warranties or representations as to the suitability of the guide set forth herein for any
particular application. The determination of the suitability of the guide is solely the responsibility of the user. Users
are cautioned to refer to manufacturer’s instructions, product labels, product data sheets, and other relevant literature
respecting any materials mentioned herein. These guides are subject to change without notice.
The user’s attention is called to the possibility that compliance with this guide may require use of copyrighted
material or of an invention covered by patent rights. By publication of this guide, SEMI takes no position respecting
the validity of any patent rights or copyrights asserted in connection with any item mentioned in this guide. Users of
this guide are expressly advised that determination of any such patent rights or copyrights, and the risk of
infringement of such rights, are entirely their own responsibility.
Copyright by SEMI® (Semiconductor Equipment and Materials
International), 3081 Zanker Road, San Jose, CA 95134. Reproduction o
f
the contents in whole or in part is forbidden without express written
consent of SEMI.