semi合集-English.pdf - 第7250页
SEMI MF525-0705 © SEMI 2003, 2005 13 found with the lower resistivity specimens. It was theref ore decided to omit the two highest re sistivity specim ens from furthe r analysis. R1-6 Tests of the distribu tion of report…
SEMI MF525-0705 © SEMI 2003, 2005 12
and
R
could be calculated that would apply to broad ranges of resistivity values without further respect to specimen
crystallographic orientation or conductivity type.
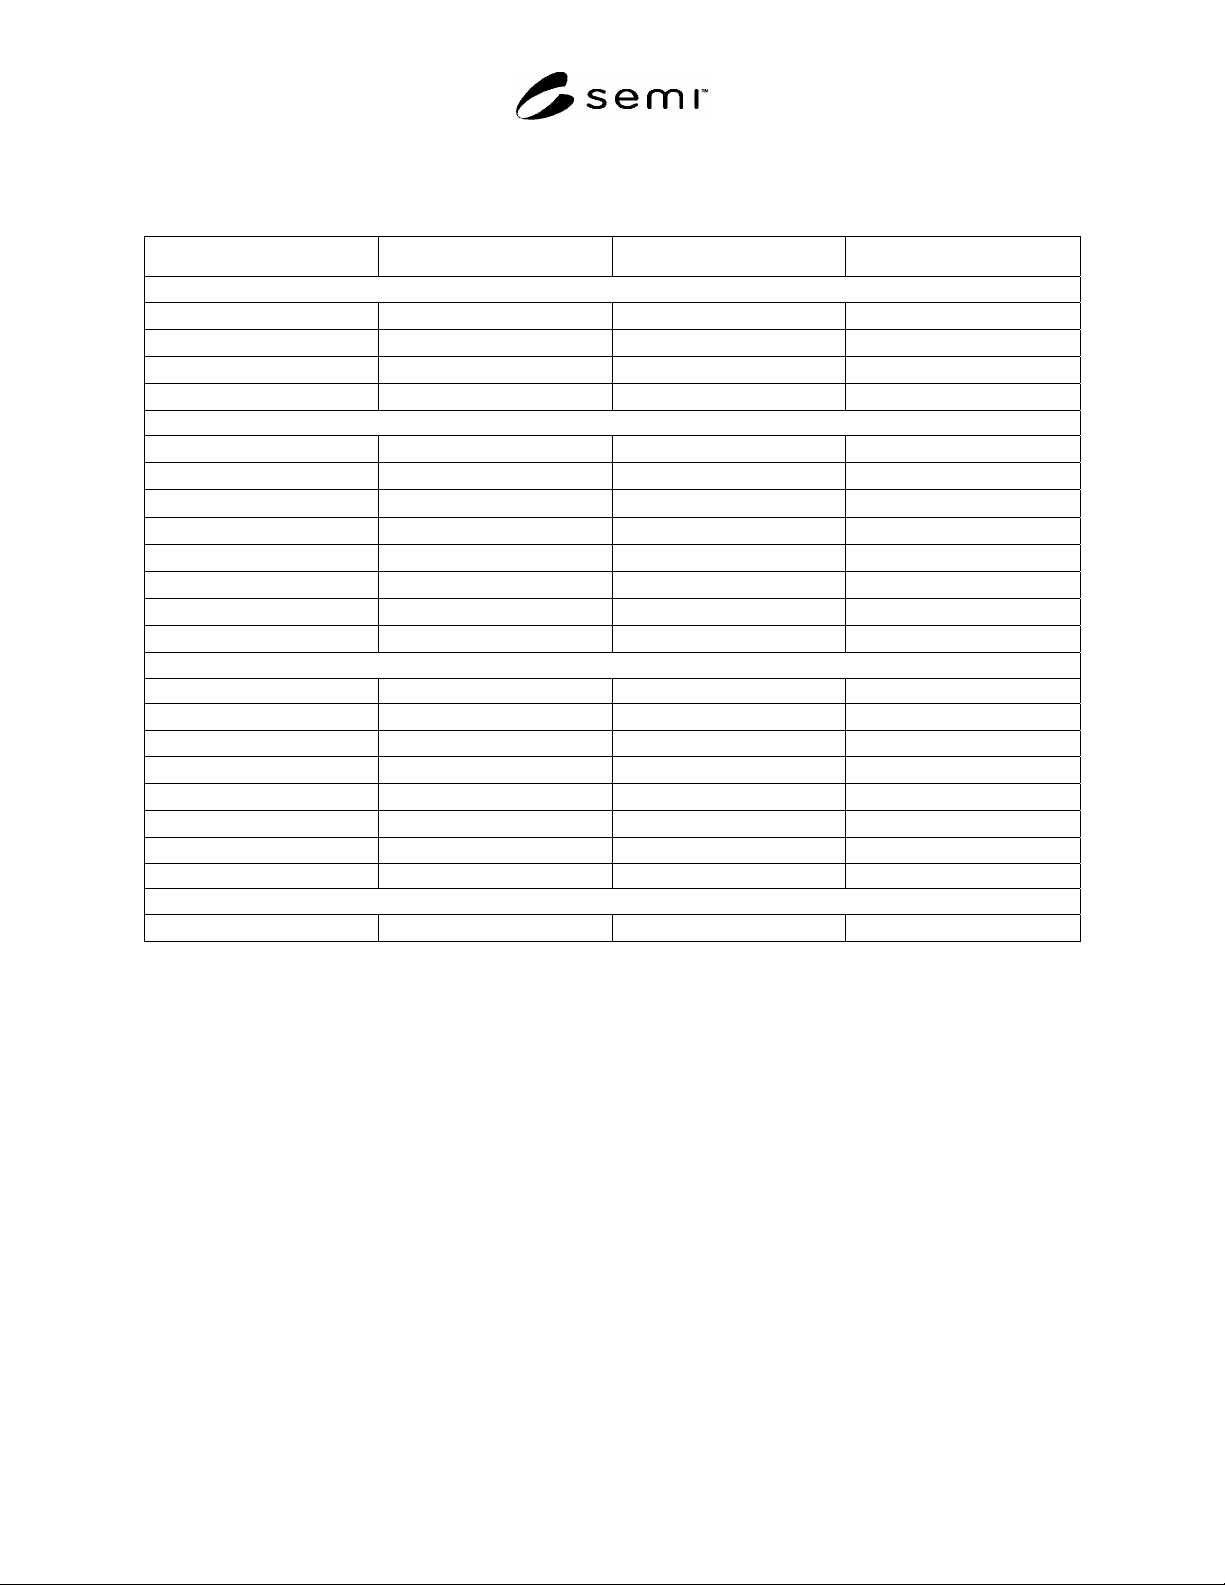
Table R1-2 Description of Probe and Specimen Preparation Conditions Used in Each Laboratory
Laboratory Number Probe Material Probe Load, g Specimen Preparation
Diamond Planar-Polished
3 Tungsten-Osmium 10
0.5 m diamond
3 Tungsten-Osmium 20
0.5 m diamond
5 Tungsten-Osmium 45
0.5 m diamond
14 Tungsten-Osmium 45
1 m diamond
Diamond Bevel-Polished
1 Tungsten-Osmium 20
0.1 m diamond
3 Tungsten-Osmium 10
0.1 m diamond
3 Tungsten-Osmium 20
0.1 m diamond
4 Tungsten-Ruthenium 5
0.25 m diamond
6 Tungsten-Osmium 10
0.5 m diamond
9 Tungsten-Osmium 22
0.1 m diamond
9 Tungsten-Osmium 5
0.1 m diamond
12 Tungsten-Osmium 20
0.1 m diamond
Silica Bevel-Polished
3 Tungsten-Osmium 10 …
3 Tungsten-Osmium 10
Bake at 150C
3 Tungsten-Osmium 20 …
3 Tungsten-Osmium 20
Bake at 150C
7 (Instrument 1) Tungsten-Osmium 20
Bake at 150C
7 (Instrument 2) Tungsten-Osmium 20
Bake at 150C
15 Tungsten-Osmium 45 Silica + 5% H
2
O
2
11 Tungsten-Osmium 20 (low penetration) pH = 8
Aluminum Oxide Lapped
10 Tungsten-Osmium 45
5 m Lapped Surface
R1-5 No independent checks of measurement quality were available; all inferences regarding control of the
measurement process by the participating laboratories had to be made from the test data supplied. To this end,
within each specimen preparation category, all contributed values of
r
and
R
were rank ordered. Any laboratory
which contributed significantly more than its expected fraction of the large values of either parameter was totally
dropped from further analysis. (The only exception was Laboratory 3 in the diamond-planar-polished category.
Although its data were generally higher than those from the other two laboratories, they were generally of
reasonable absolute value and were likely due to the noticeably lower probe loads used by Laboratory 3.) As a result
of this screening, data from the following laboratories were omitted from further analysis: diamond bevel
polishing—Laboratory 6 and Laboratory 9 at 5 g, silica bevel polishing—Laboratory 11.
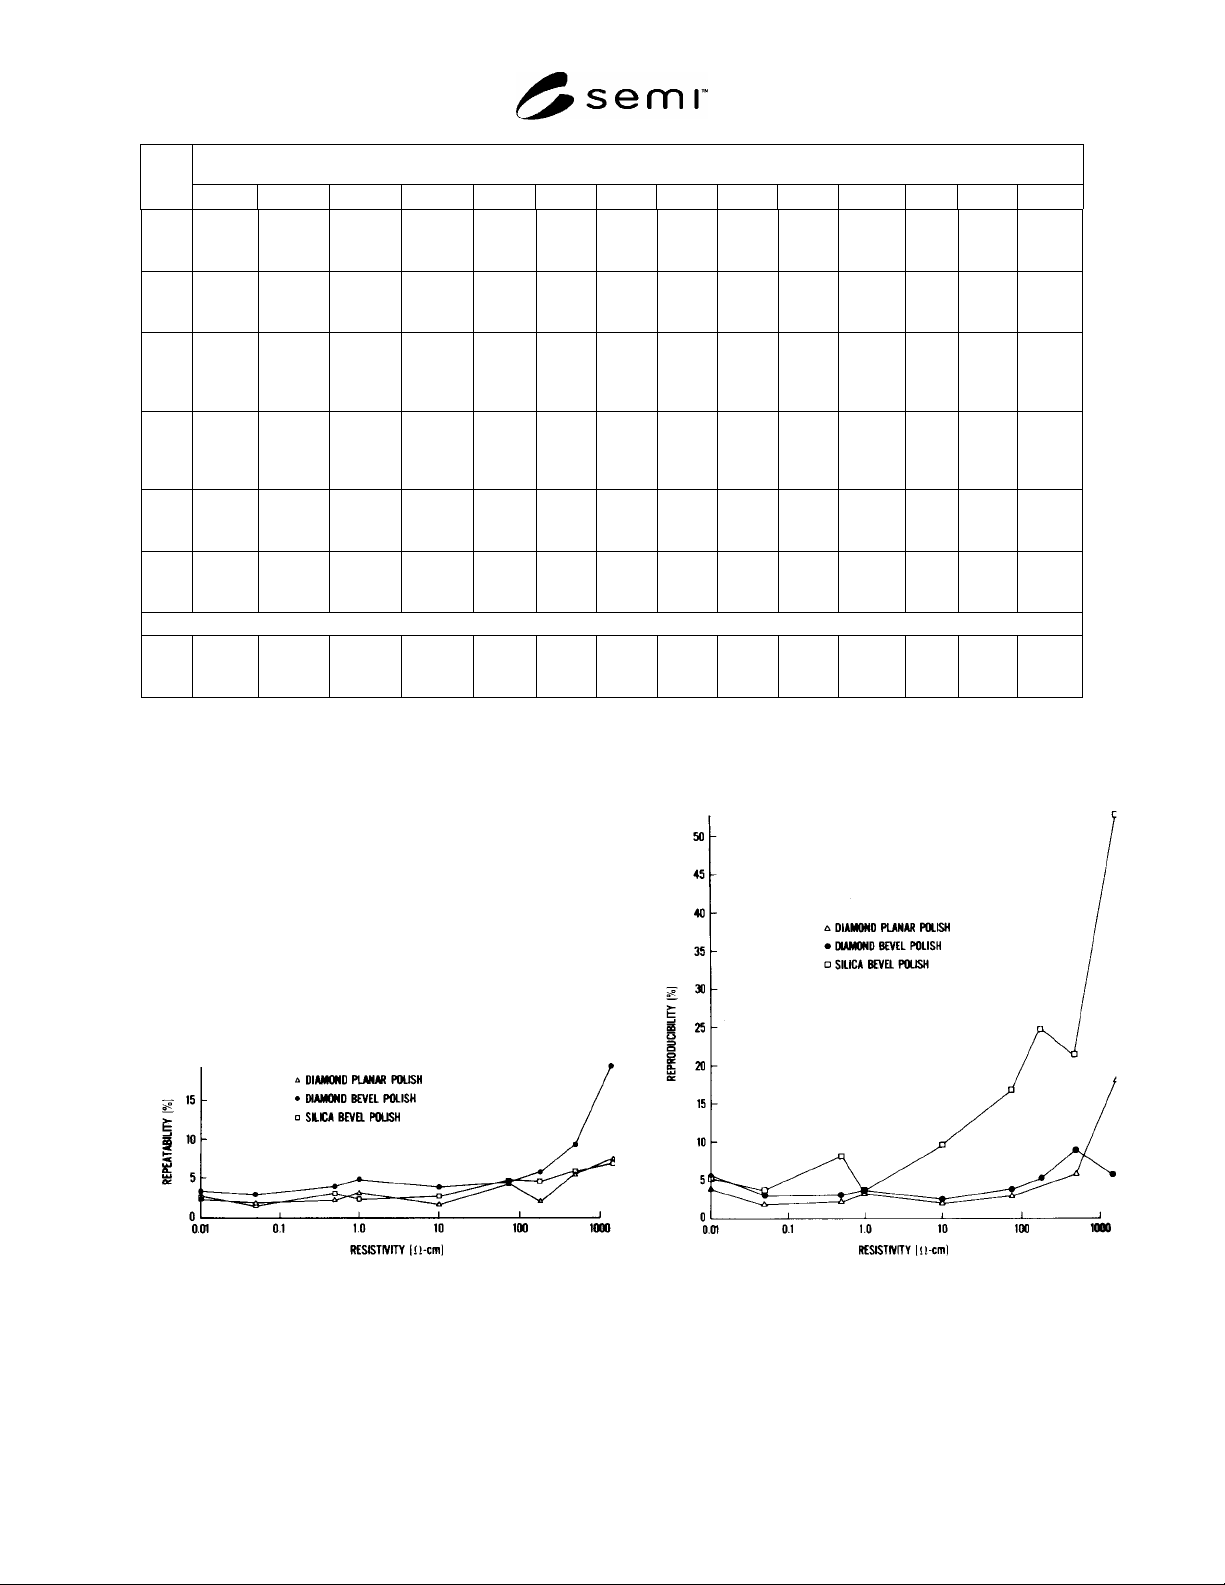
R1-5.1 Plots of average values of
r
and
R
as a function of resistivity only are shown in Figure R1-1. These plots
were obtained by simple averaging of all values of these parameters, as a function of specimen resistivity, for all
laboratories whose data were not rejected. From these plots it is seen that single fixed values of
r
, or
R
, do not
apply to the entire range of specimen resistivities measured. Each category of diamond polish appears to have a
reasonably constant value of
r
or
R
, for the specimen range from 0.05 to 200 ·cm. Silica-beveled specimens
have a reasonably constant value of in this resistivity range; however, it is difficult to establish a single value of
R
over any reasonable resistivity range for silica-polished specimens.
R1-5.2 Re-examination of laboratory data for the two highest resistivity specimens indicated a strong possibility of
resistivity variations in these two specimens as well as a variety of reported probe control problems that were not
SEMI MF525-0705 © SEMI 2003, 2005 13
found with the lower resistivity specimens. It was therefore decided to omit the two highest resistivity specimens
from further analysis.
R1-6 Tests of the distribution of reported values of
r
and
R
within each category indicated that they had too much
variability to be consistent with single underlying values of repeatability and reproducibility in any of the
preparation categories. It is probable that some of this excess variability resulted from the variety of probe
conditions and specimen orientations, conductivity types, and surface preparation details. Nevertheless, the effect of
this excess variability was that overall estimates of
r
and
R
could not be obtained from root-mean-square pooling
of the respective variances. These overall estimates were obtained instead as percentiles of the distributions of the
contributed values in each category from specimens in the resistivity range from 0.01 to 200 ·cm.
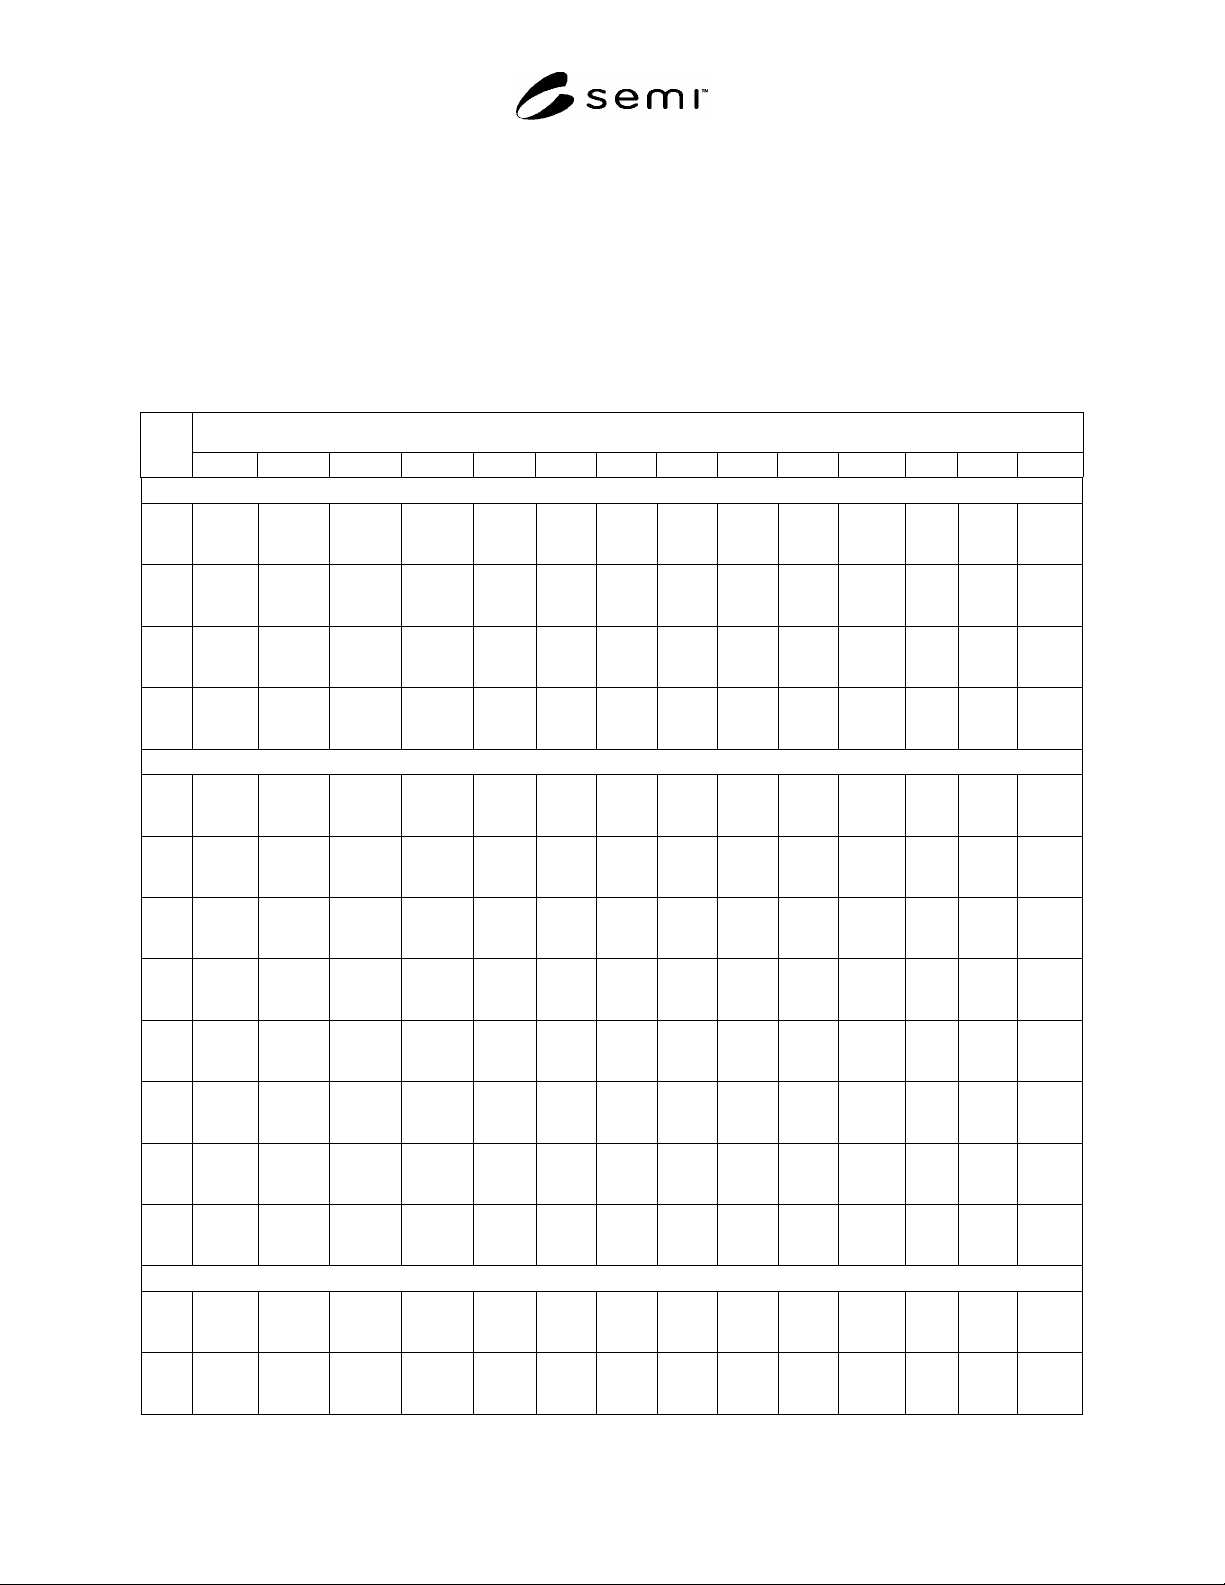
Table R1-3 Summary of Round Robin Data
Specimen Identification
Lab
#
C D E F G H J K L M N P R T
Diamond-Planar Polish
#1
3
10 g
4.16 k
5.1%
2.2%
18.1 k
3.5%
2.5%
2.09 M
26.0%
9.7%
9.19 M
6.6%
2.9%
1.01 k
4.5%
2.6%
42.1 k
2.2%
1.4%
19.2 k
4.1%
1.4%
74.6
6.8%
3.1%
12.0
7.5%
4.5%
55.6 k
6.3%
2.8%
1.98 M
6.8%
3.0%
36.1
0.9%
2.2%
1.17 k
5.0%
2.5%
745 k
3.4%
2.5%
3
20 g
2.05 k
2.2%
1.7%
10.6 k
2.2%
1.4%
5.79 M
25.0%
12.0%
4.37 M
4.6%
2.9%
587
2.8%
1.7%
25.2 k
2.5%
1.8%
11.3 k
2.6%
1.6%
49.0
7.1%
2.1%
6.75
6.6%
1.5%
28.9 k
2.4%
2.0%
860. k
4.7%
2.1%
24.1
4.9%
2.2%
779.
6.0%
2.2%
358 k
1.4%
2.0%
5
B
886.
1.2%
…
6.05 k
0.9%
…
4.36 M
20.0%
…
1.59 M
6.5%
…
316
2.0%
…
15.4 k
2.2%
…
7.14 k
0.4%
…
24.0
1.7%
…
3.88
0.8%
…
12.7 k
4.5%
…
470. k
0.0%
…
12.2
0.7
…
411.
2.1%
…
219 k
2.9%
…
14
1.69 k
0.4%
1.6%
9.22 k
0.3%
1.6%
1.09 M
1.6%
1.2%
4.16 M
5.1%
10.9%
728
0.8%
3.8%
15.8 k
0.3%
1.0%
9.51 k
0.3%
1.3%
35.1
0.5%
0.9%
5.34
0.5%
2.3%
21.3 k
0.8%
1.8%
487. k
0.2%
1.1%
17.6
1.3%
1.1%
1.01 k
1.1%
4.6%
215 k
2.4%
8.5%
Diamond-Bevel Polish
#1
1
2.20 k
5.6%
4.6%
10.4 k
1.4%
3.4%
6.15 M
1.8%
28.0%
6.15 M
11.8%
14.4%
744.
2.3%
3.6%
24.5 k
1.2%
2.0%
11.1 k
1.9%
2.0%
54.8
8.1%
4.0%
9.51
20.0%
6.0%
27.2 k
6.8%
5.6%
888 k
0.9%
6.1%
26.2
0.6%
1.9%
726
2.5%
4.0%
370 k
2.5%
5.8%
3
10 g
3.36 k
1.6%
3.0%
17.9 k
2.1%
2.7%
7.21 M
3.5%
3.5%
15.8 M
5.3%
4.2%
1.22 k
1.5%
3.6%
45.2 k
4.2%
1.7%
21.3 k
1.4%
3.6%
72.4
3.6%
3.8%
9.89
4.4%
4.6%
58.2 k
3.6%
3.6%
2.46 M
4.0%
4.0%
42.2
6.2%
3.0%
1.36 k
3.0%
2.6%
1.01 M
2.3%
3.5%
3
20 g
2.33 k
2.5%
2.5%
10.5 k
1.3%
1.8%
2.48 M
6.90%
3.9%
7.10 M
5.5%
3.7%
698.
3.6%
3.2%
24.0 k
1.5%
1.7%
11.8 k
2.4%
2.4%
49.4
4.6%
3.3%
6.35
4.9%
1.7%
11.3 k
2.4%
2.4%
1.04 M
5.8%
2.9%
25.0
3.0%
2.3%
824
1.8%
2.3%
424 k
2.3%
2.2%
4
5.43 k
1.8%
2.9%
22.5 k
2.4%
2.6%
20.5 M
3.8%
4.6%
13.6 M
18.0%
9.8%
1.54 k
1.7%
3.1%
67.3 k
1.8%
2.4%
27.6 k
1.8%
2.4%
105
1.4%
1.9%
14.2
4.5%
1.8%
70.0 k
4.4%
4.2%
3.03 M
8.4%
8.0%
…
…
…
…
…
…
1.06 M
1.6%
3.4%
6
4.09 k
2.2%
5.9%
17.9 k
3.1%
4.5%
3.24 M
2.60%
8.0%
10.2 M
17.9%
12.6%
1.52 k
16.2%
10.0%
39.1 k
0.7%
3.4%
15.7 k
0.8%
2.0%
108
11.0%
8.1%
20.4
12.6%
19.4%
54.4 k
7.4%
8.7%
1.48 M
22.0%
15.5%
58.6
6.9%
10.7%
1.40 k
2.0%
8.8%
647 k
2.5%
13.1%
9
22 g
2.30 k
4.2%
4.0%
13.2 k
4.4%
7.6%
33.9 M
10.7%
46.0%
3.79 M
7.7%
9.9%
877
5.3%
6.3%
28.3 k
2.4%
1.3%
15.1 k
2.3%
5.4%
44.6
2.8%
2.1%
6.48
2.7%
3.2%
30.9 k
2.9%
3.8%
1.16 M
5.2%
3.4%
27.5
2.2%
2.3%
1.05 k
3.5%
5.0%
525 k
1.8%
4.6%
9
5 g
7.84 k
5.6%
9.7%
62.6 k
9.0%
18.4%
12.6 M
11.0%
10.2%
16.0 M
6.2%
5.1%
3.96 k
1.7%
18.7%
60.3 k
1.4%
1.5%
35.8 k
3.7%
5.3%
122
21.0%
5.3%
15.9
9.0%
8.0%
92.8 k
9.7%
5.2%
6.89 M
16.0%
8.7%
86.5
5.6%
8.1%
3.36 k
9.9%
20.0%
1.67 M
15.0%
6.2%
12
4.91 k
1.8%
5.2%
14.8 k
3.9%
8.0%
40.7 M
6.5%
35.0%
28.8 M
5.1%
13.3%
830
4.9%
3.3%
31.1 k
1.5%
3.6%
14.9 k
2.8%
5.6%
47.9
5.4%
3.5%
8.45
5.1%
4.4%
41.3 k
0.6%
8.7%
3.39 M
6.5%
9.9%
49.2
3.2%
5.1%
1.69 k
8.5%
7.3%
1.48 M
11.9%
6.8%
Silica-Bevel Polish
#1
3
10 g
3.82 k
14.0%
2.6%
65.8 k
30.0%
4.7%
888 k
80.0%
6.4%
616 k
3.0%
12.3%
1.88 k
11.3%
3.7%
38.2 k
17.8%
2.3%
87.8 k
17.8%
2.3%
73.8
6.3%
2.0%
10.3
5.4%
3.3%
34.0 k
21.6%
3.1%
468 k
14.7%
6.0%
30.9
3.1%
1.7%
1.57 k
2.0%
1.7%
573 k
33.0%
6.3%
3
10 g
baked
2.95 k
12.5%
2.8%
31.1 k
8.5%
2.3%
943 k
25.0%
7.8%
723 k
23.0%
6.7%
1.45 k
4.1%
3.6%
30.9 k
14.6%
2.7%
35.4 k
7.0%
2.2%
79.2
3.8%
1.9%
10.7
0.7%
3.2%
31.1 k
9.2%
2.8%
610 k
49.0%
6.1%
30.7
1.5%
1.3%
1.27 k
6.6%
1.5%
365 k
29.0%
6.4%
SEMI MF525-0705 © SEMI 2003, 2005 14
Specimen Identification
Lab
#
C D E F G H J K L M N P R T
3
20 g
2.09 k
7.3%
2.3%
22.1 k
4.7%
2.4%
749 k
95.0%
7.1%
327 k
20.0%
8.3%
857
3.7%
2.4%
22.4 k
13.6%
1.5%
28.4 k
8.7%
3.4%
43.9
2.3%
1.2%
5.88
1.6%
1.7%
21.8 k
13.5%
3.0%
270 k
4.9%
5.7%
20.4
1.6%
1.0%
904
2.6%
1.8%
291 k
11.4%
4.4%
3
20 g
baked
1.73 k
9.8%
2.4%
15.3 k
6.7%
1.7%
606 k
27.0%
8.0%
439 k
27.0%
4.0%
75.6
7.6%
2.6%
18.7 k
9.5%
1.8%
16.8 k
6.9%
1.7%
45.9
4.5%
1.5%
6.01
1.1%
2.3%
20.0 k
8.7%
1.8%
403 k
40.0%
5.1%
20.5
2.5%
1.0%
803
5.5%
1.1%
229 k
9.7%
6.5%
7
Instru-
ment
1
2.07 k
5.4%
3.5%
15.6 k
2.4%
2.4%
1.38 M
38.0%
7.8%
665 k
25.0%
5.7%
1.31 k
14.0%
4.7%
20.6 k
14.7%
2.1%
22.1 k
5.3%
4.7%
69.4
9.7%
4.4%
10.5
14.0%
5.8%
22.9 k
7.8%
4.7%
337 k
24.0%
3.6%
30.7
12.0%
1.9%
1.61 k
1.1%
4.6%
181 k
13.0%
3.7%
7
Instru-
ment
2
2.43 k
4.7%
2.5%
14.2 k
4.9%
2.1%
1.40 M
30.0%
5.6%
734 k
18.0%
3.4%
1.11 k
5.3%
3.9%
22.4 k
7.66%
1.8%
14.4 k
5.3%
3.5%
58.2
1.5%
1.8%
9.64
20.0%
4.1%
23.8 k
7.5%
2.2%
303 k
23.0%
3.5%
35.0
4.2%
3.2%
832
0.7%
3.3%
186 k
4.90%
2.9%
15
1.95 k
4.4%
2.3%
13.5 k
6.2%
2.5%
29.7 M
73.0%
6.0%
2.02 M
33.0%
3.2%
641
11.0%
2.6%
16.0 k
3.5%
0.8%
8.00 k
5.6%
1.2%
31.9
2.3%
1.8%
4.64
1.2%
0.6%
22.1 k
3.8%
2.1%
608 k
16.9%
2.7%
15.6
1.2%
0.7%
647
4.7%
2.3%
304 k
16.5%
2.6%
11
3.51 k
11.0%
3.5%
1.37 M
18.0%
9.0%
2.66 M
49.0%
10.0%
1.42 M
50.0%
6.0%
260 k
22.0%
4.6%
33.8 k
16.0%
2.7%
235 k
16.0%
5.8%
1.19 k
26.0%
6.5%
22.6
36.0%
7.4%
27.5 k
5.1%
2.9%
585 k
33.0%
8.1%
89.9
33.0%
5.0%
5.67 k
28.0%
4.4%
327 k
14.0%
3.5%
Aluminum-Oxide Lap
#1
10
1.22 k
3.3%
6.6%
9.79 k
1.6%
12.0%
5.26 M
18.0%
36.0%
981 k
7.9%
8.9%
53.0
8.2%
10.0%
13.0 k
2.8%
5.3%
10.7 k
4.8%
10.0%
41.6
2.3%
7.3%
4.48
6.6%
6.2%
10.5 k
0.8%
6.8%
191 k
3.6%
8.7%
17.1
2.1%
7.2%
588
2.4%
6.2%
89.1 k
4.2%
7.2%
#1
In each box, the first value is grand average spreading resistance value (for the record only, not used in analysis of test); second entry is
“reproducibility,”
R
, that is, the percent relative standard deviation of four averages (of 25 measurements each), the third entry is the
“repeatability,”
r
, that is, the average of four relative standard deviations (of sets of 25 measurements).
#2
Reported graphical data and averages;
r
could not be calculated.
(b) Reproducibility (a) Repeatability
Figure R1-1
Round-Robin Averages as a Function of Resistivity and Specimen Preparation